Converting Excel CSV Coordinates into Shapefiles Programmatically with Python

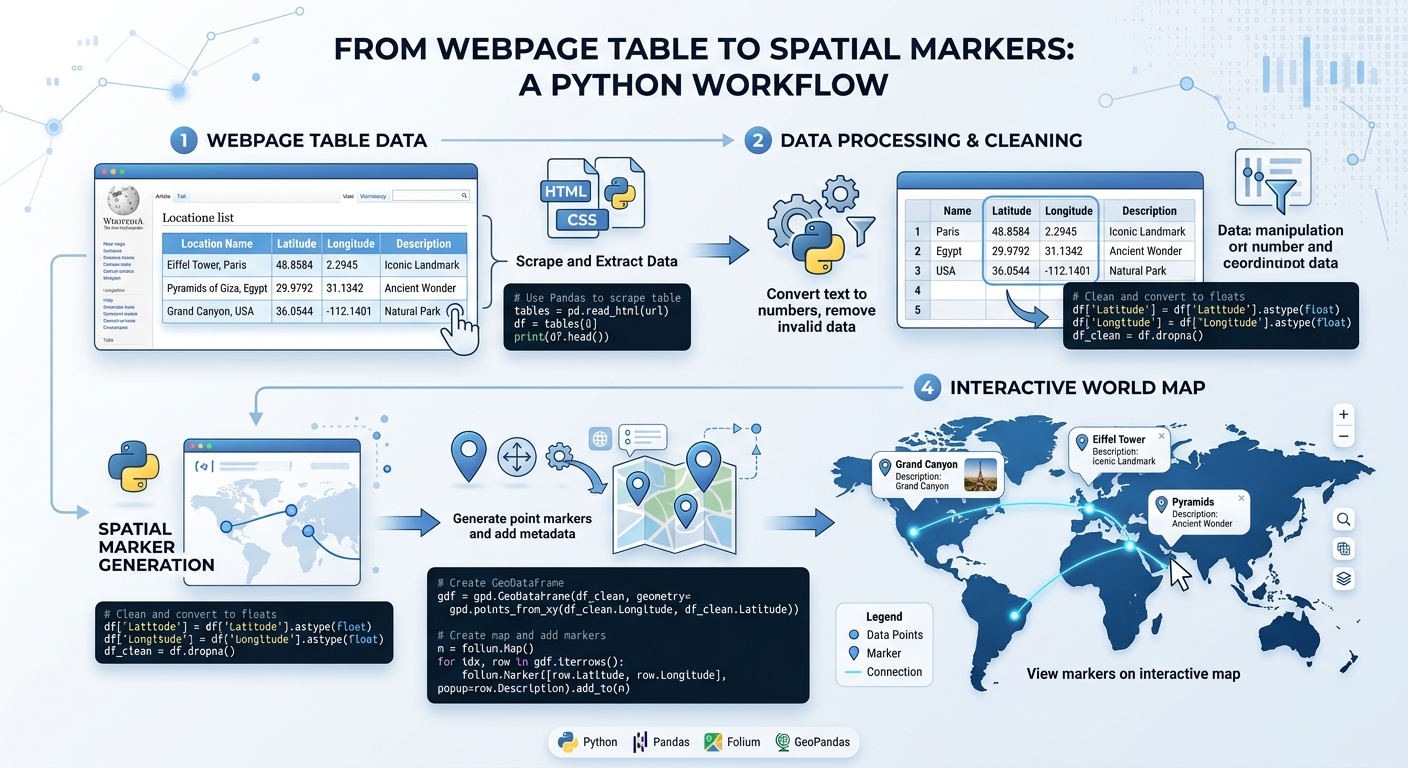
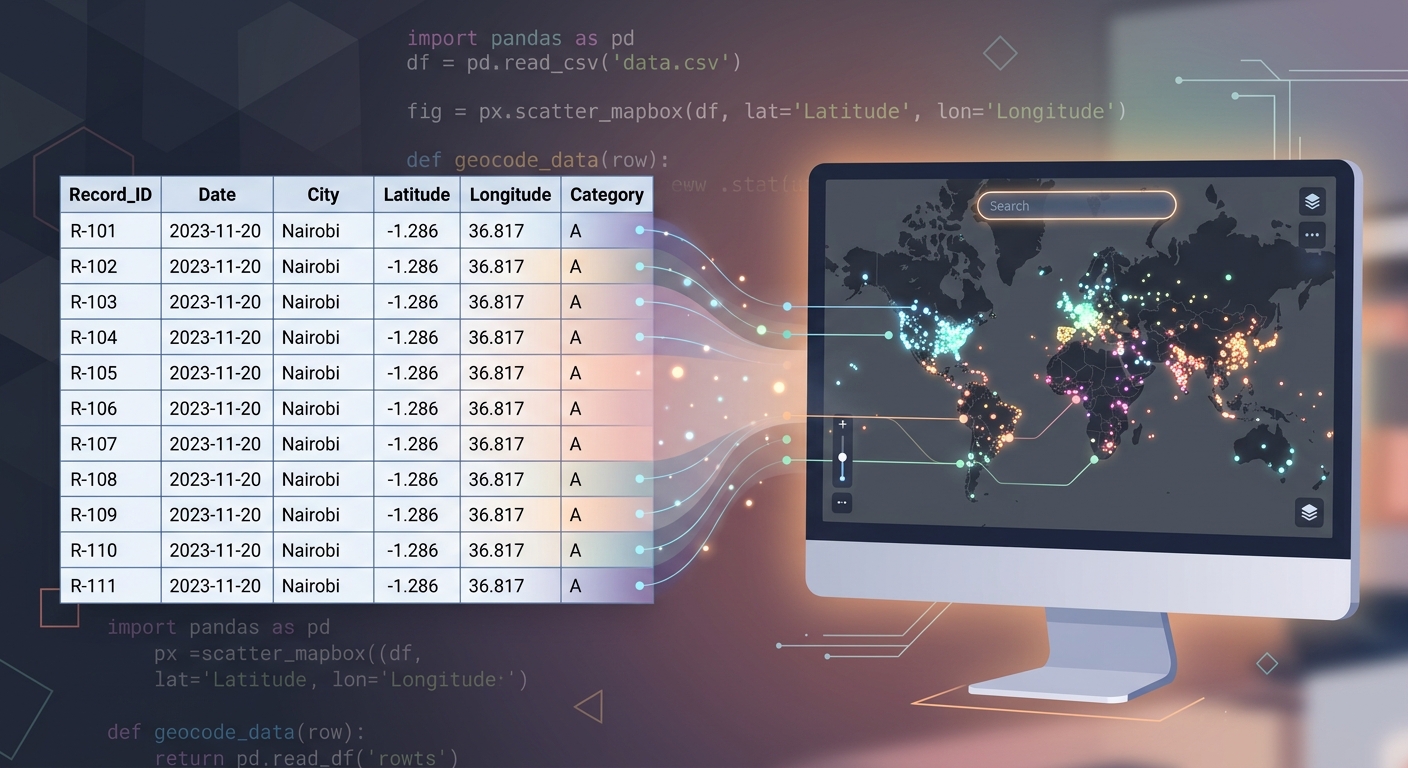
Conceptual workflow showing how to Convert Excel CSV Coordinates into Shapefiles Programmatically with Python.

Converting Excel CSV Coordinates into Shapefiles Programmatically with Python Converting Excel CSV Coordinates into Shapefiles Programmatically with Python saves time when you regularly receive tabular GIS data as spreadsheets containing latitude and longitude values. With Python, pandas, GeoPandas, and Shapely, you can automate the entire workflow: read the table, clean the coordinates, create point geometries, … Read more
Buffer Analysis vs. Service Area Analysis: Which Proximity Tool Should You Use?

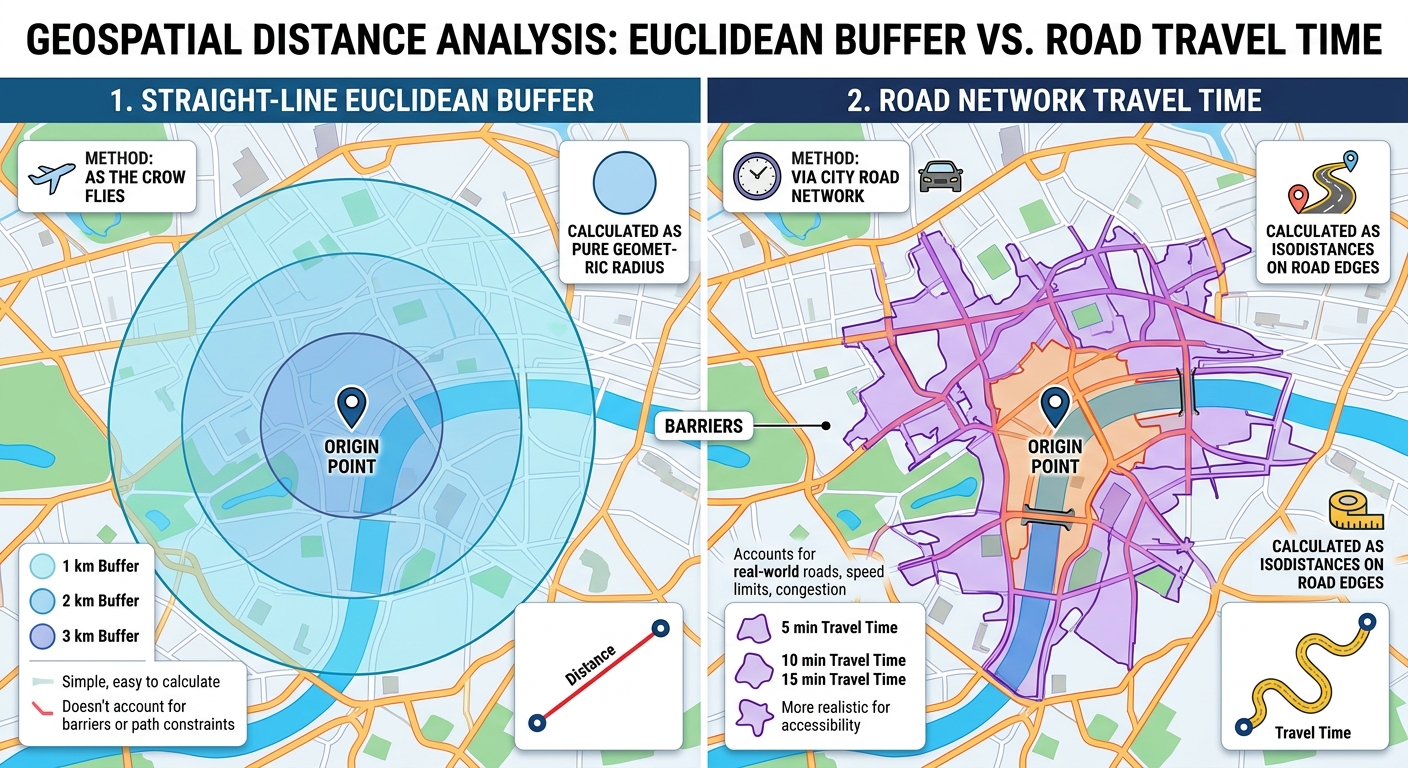
Buffer Analysis vs Service Area Analysis

Buffer Analysis vs. Service Area Analysis: Which Proximity Tool Should You Use? Introduction: Understanding Proximity Analysis in GIS Buffer Analysis vs Service Area Analysis is one of the most important comparisons when examining proximity and accessibility in Geographic Information Systems (GIS). . It helps researchers, planners, and decision-makers understand how locations relate to nearby features, … Read more

How to Create an Interactive Web Dashboard with ArcGIS Dashboards

ArcGIS Dashboards

How to Create an Interactive Web Dashboard with ArcGIS Dashboards Introduction: What Is ArcGIS Dashboards? ArcGIS Dashboards is a web-based application within the ArcGIS platform that allows GIS professionals to present spatial data, operational indicators, charts, and interactive maps in one place. It helps decision-makers monitor activities, identify spatial patterns, and understand changing conditions without … Read more

PyGIS Starter Guide: GeoPandas vs. Shapely for Vector Data Analysis

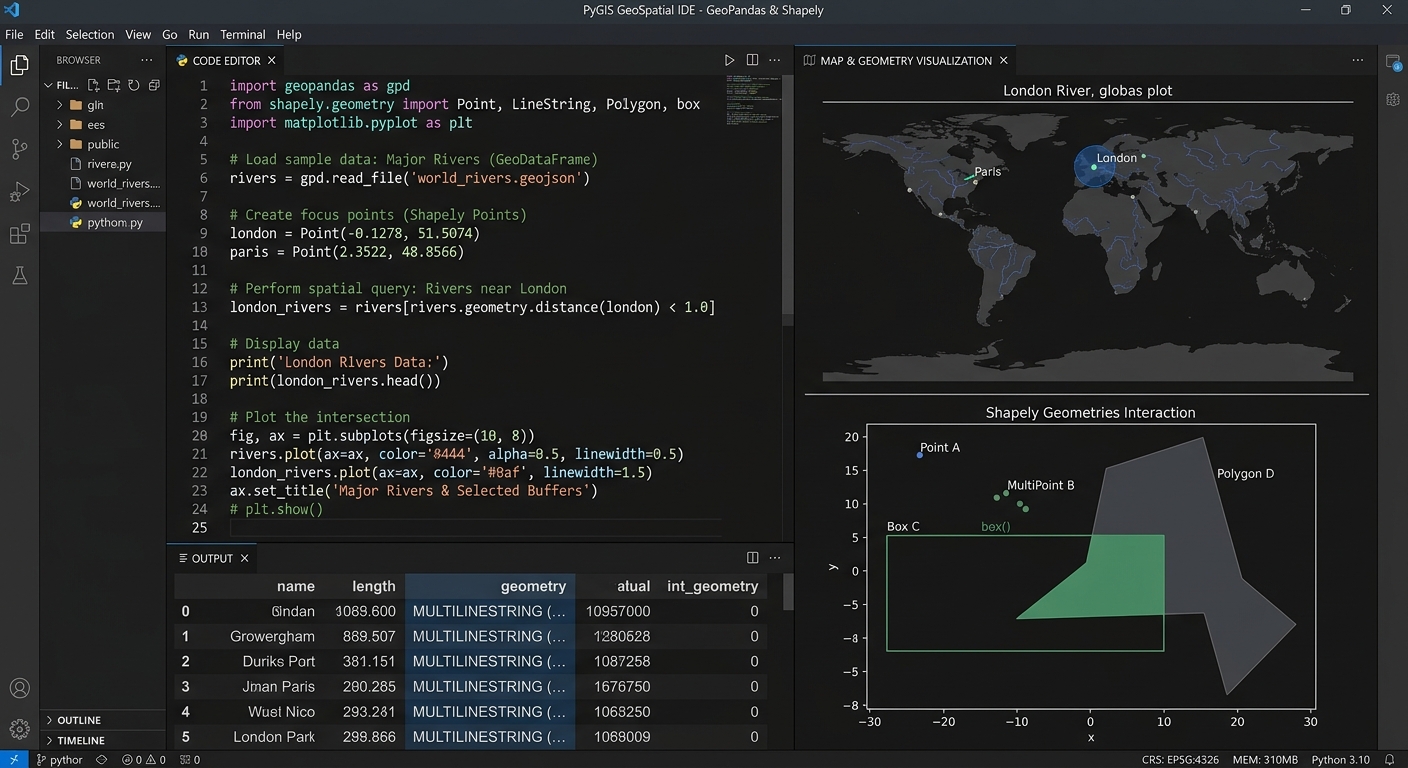
GeoPandas vs Shapely PyGIS

PyGIS Starter Guide: GeoPandas vs. Shapely for Vector Data Analysis   1. Introduction: Why Learn Open-Source Python GIS? Using tools like GeoPandas vs Shapely PyGIS, traditional GIS applications such as QGIS and ArcGIS provide powerful frameworks for mapping, spatial analysis, and data management. However, when you need to repeat an analysis across hundreds of datasets, combine … Read more

Spatial Autocorrelation (Global Moran’s I) in GIS: Interpretation Guide

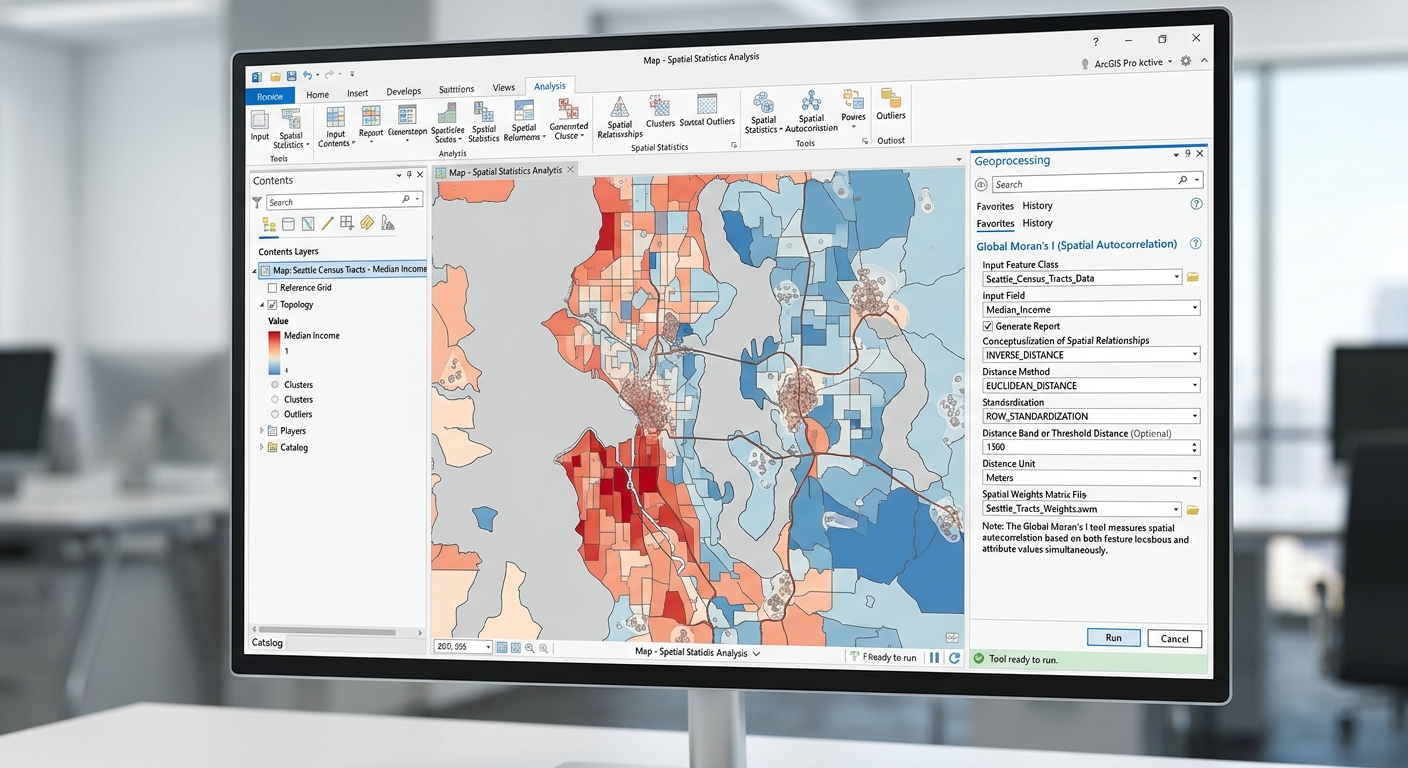
Global Morans I Spatial Autocorrelation GIS

Spatial Autocorrelation (Global Moran’s I) in GIS: Interpretation Guide 1. Introduction: Why Does Location Matter? Imagine mapping malaria incidence across several districts. Some districts report high incidence, while others report low incidence. When the high-incidence districts are located near one another, the pattern may indicate spatial clustering. If neighbouring districts have contrasting incidence levels, the … Read more

Sentinel-2 vs. Landsat 9 for Vegetation Monitoring: Key Differences & Band Combinations

Sentinel-2 vs Landsat 9 Vegetation Monitoring

Sentinel-2 vs. Landsat 9 for Vegetation Monitoring: Key Differences & Band Combinations   1. Introduction: Why Sentinel-2 and Landsat 9 Matter for Vegetation Monitoring Satellite remote sensing has become an essential tool for monitoring vegetation, mapping land use and land cover (LULC), assessing crop health, and studying forest change. Two of the most widely used … Read more

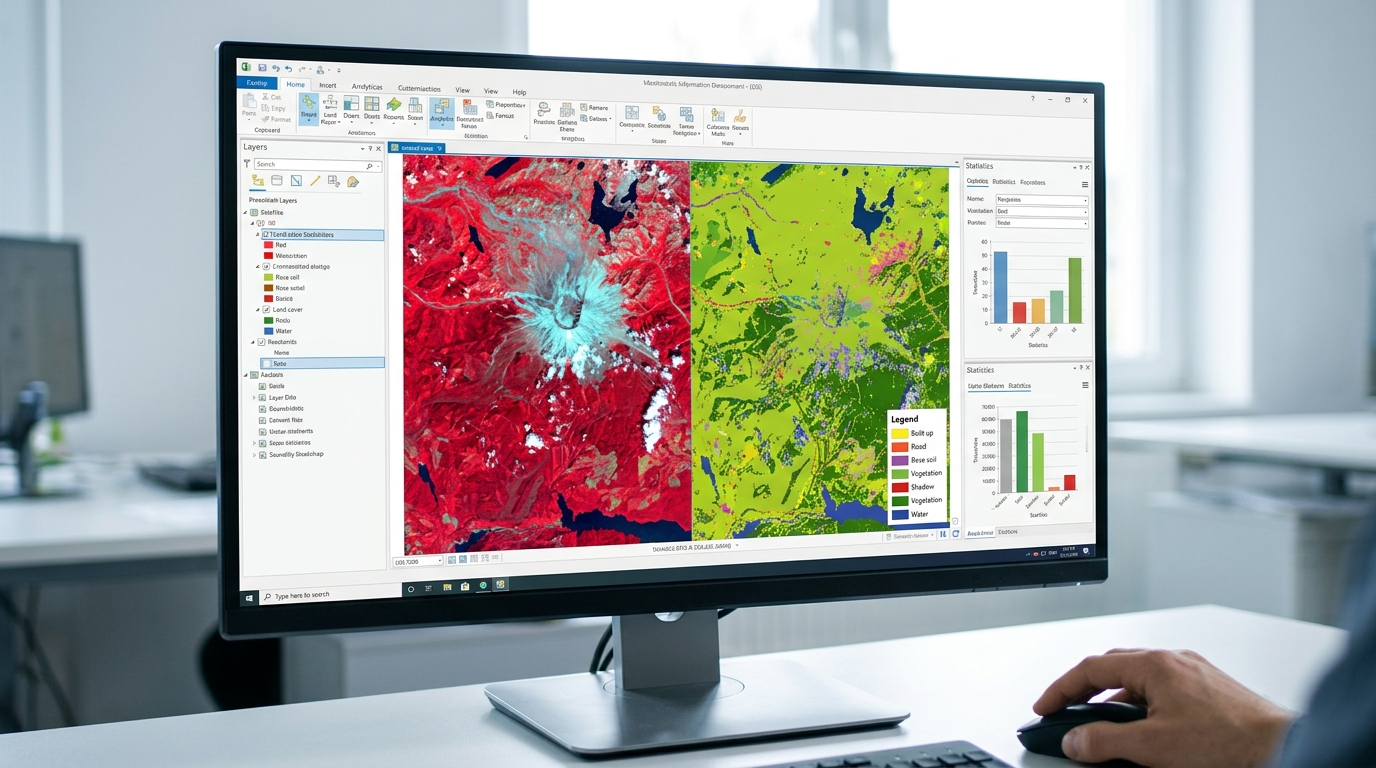
Supervised vs Unsupervised Image Classification GIS methods are essential because satellite images contain enormous amounts of information

Supervised vs. Unsupervised Image Classification: Ultimate Beginner’s Guide Introduction: Why Image Classification Matters Supervised vs Unsupervised Image Classification GIS methods are essential because satellite images contain enormous amounts of information, but a raw image does not automatically tell us which pixels represent forest, water, buildings, cropland, or bare soil. Image classification converts the spectral information … Read more