Moran’s I Spatial Autocorrelation: Beginner GIS Guide

Moran’s I Spatial Autocorrelation: Beginner GIS Guide If you are working with geographic data, simply knowing where high and low values occur is often not enough. You may also need to determine whether those values are clustered, dispersed, or randomly distributed across space. This is where Moran’s I spatial autocorrelation becomes useful. Moran’s I provides … Read more
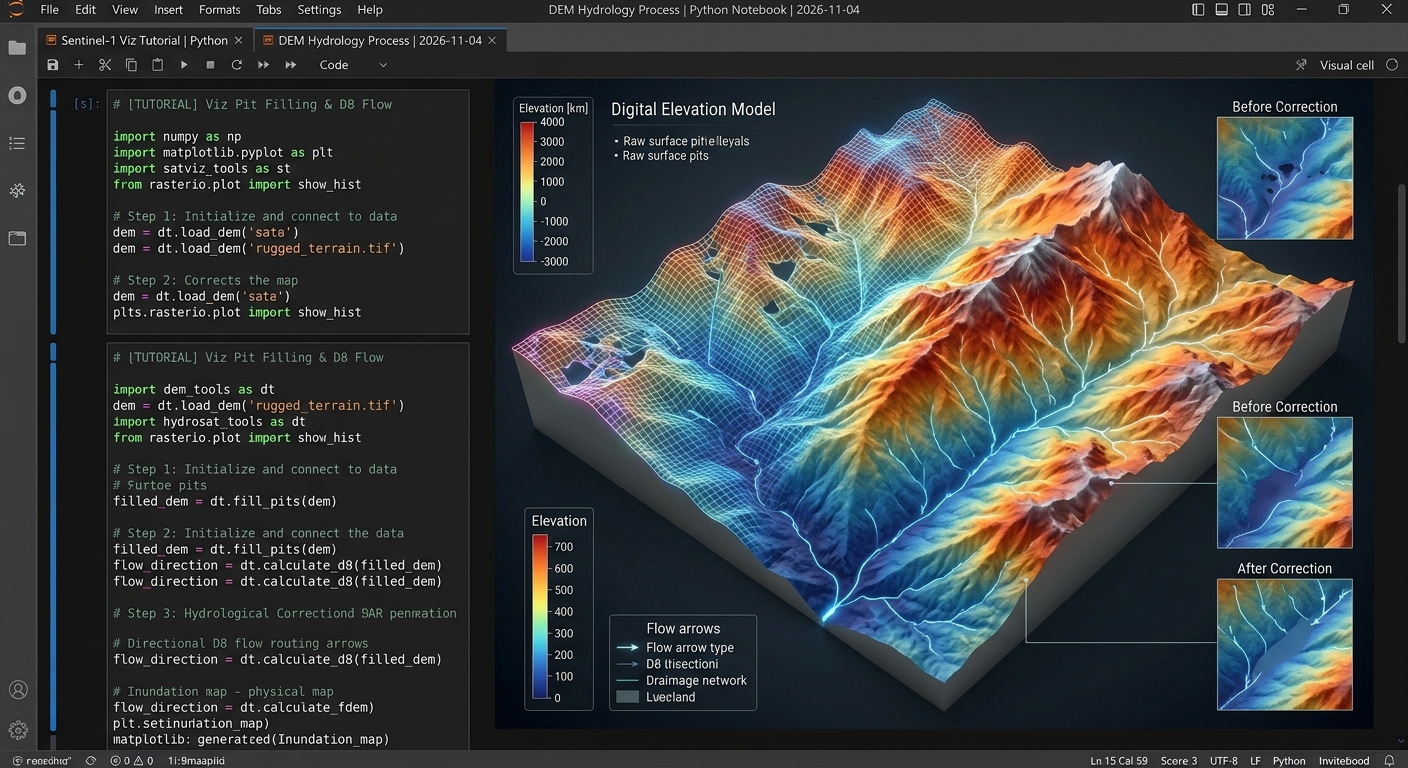
DEM conditioning and flow direction routing steps in Automated Watershed Delineation PySheds DEM Python workflows.

Automated Watershed Delineation and Stream Network Extraction Using PySheds and DEMs Automated watershed modeling is a foundational pillar of modern hydro-environmental engineering. Whether managing regional water resources, evaluating urban flood risks, or planning ecological conservation reserves, spatial analysts and hydrologists rely heavily on Digital Elevation Models (DEMs) to reconstruct surface drainage topologies. Traditionally, extracting catchments … Read more

Spatial Autocorrelation in Practice: Calculating Global and Local Moran’s I for Disease Cluster Analysis

Spatial Autocorrelation in Practice: Calculating Global and Local Moran’s I for Disease Cluster Analysis In epidemiological surveillance and public health spatial analytics, traditional aspatial statistical models frequently fall short. Standard regression techniques assume that observations are independent and identically distributed (i.i.d.). However, health outcomes, infectious disease transmissions, chronic morbidity rates, and environmental toxic exposures rarely … Read more

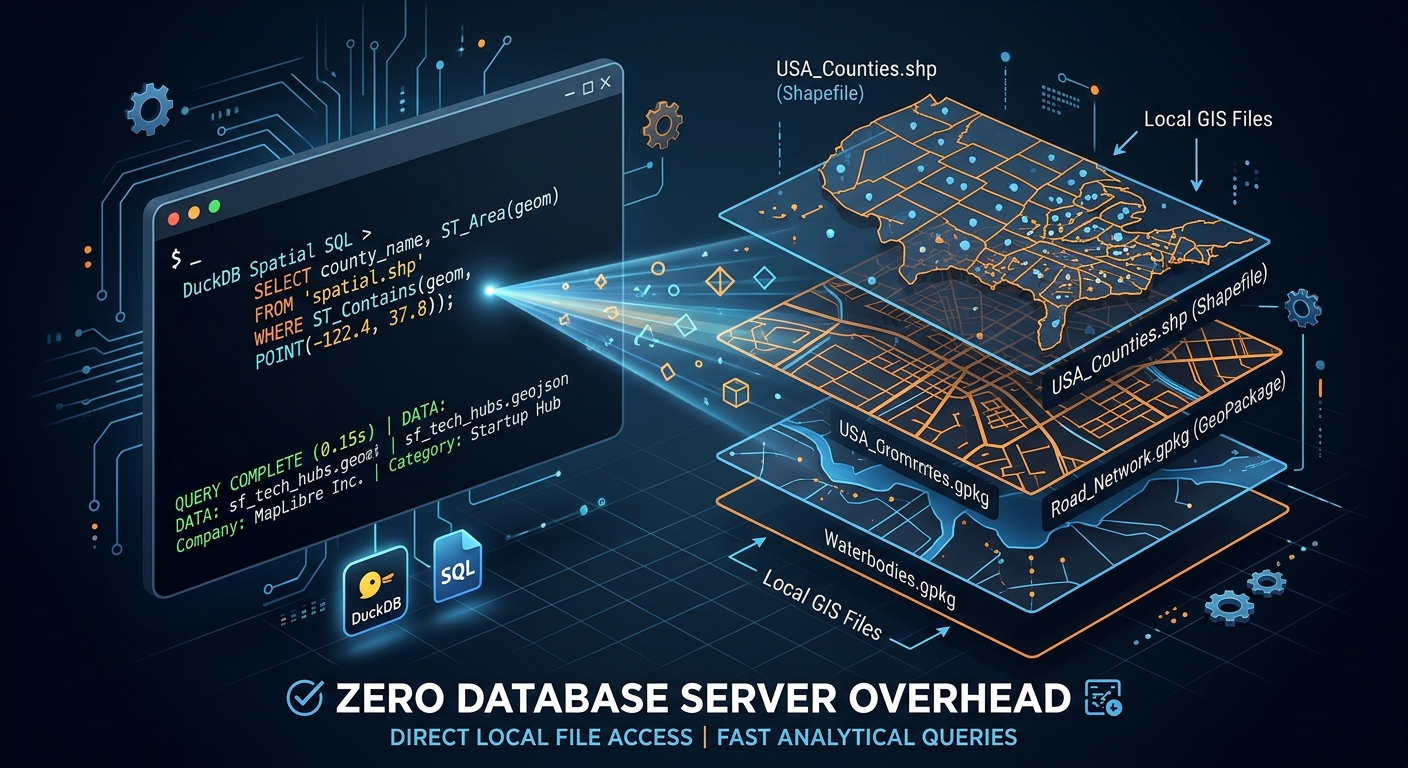
DuckDB Spatial Query Shapefiles GeoPackages featured image

Spatial Analysis at Speed: Querying Shapefiles and GeoPackages Directly with DuckDB Spatial When performing exploratory data work, DuckDB Spatial Query Shapefiles GeoPackages workflows allow developers to execute spatial SQL directly against local files without database overhead. The key architectural advantage of DuckDB Spatial is that you can query vector datasets instantly without first loading them … Read more

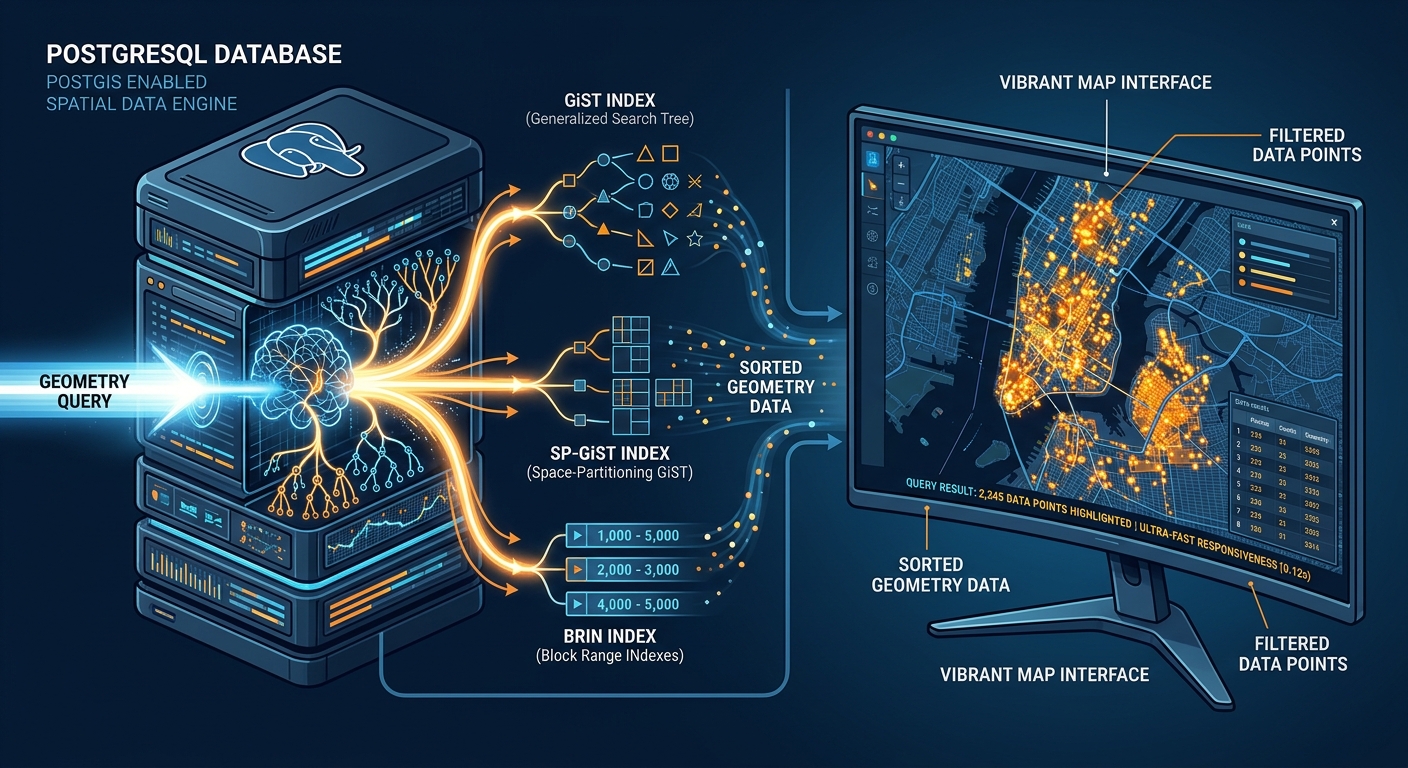
Advanced Spatial Index Tuning in PostGIS: GiST vs. SP-GiST vs. BRIN Indexes for Million-Row Tables

Advanced Spatial Index Tuning in PostGIS Featured Image

Advanced Spatial Index Tuning in PostGIS: GiST vs. SP-GiST vs. BRIN Indexes for Million-Row Tables Introduction Spatial query performance can deteriorate dramatically when geographic datasets grow from thousands to millions of records. A query that once returned nearby infrastructure assets in milliseconds may eventually trigger expensive sequential scans, consume excessive memory and disk bandwidth, or … Read more

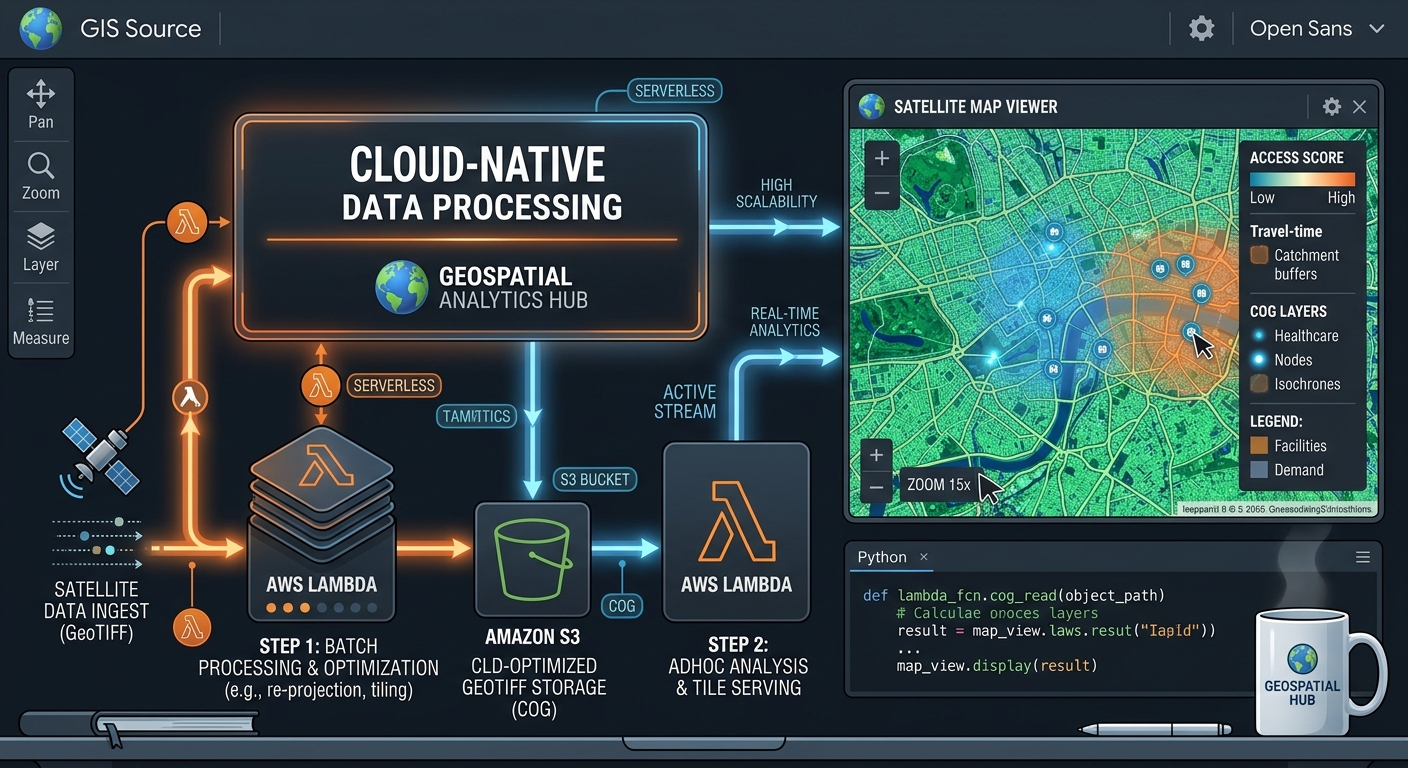
Building a Serverless Cloud-Optimized GeoTIFF (COG) Dynamic Mosaicing Pipeline with AWS Lambda and TiTiler

Serverless COG Dynamic Mosaicing TiTiler AWS Lambda featured map

Building a Serverless Cloud-Optimized GeoTIFF (COG) Dynamic Mosaicing Pipeline with AWS Lambda and TiTiler Introduction Pre-rendering an XYZ tile pyramid has traditionally been a practical way to publish satellite imagery to web mapping applications. However, maintaining static tile pyramids becomes increasingly expensive when a platform manages millions of raster scenes, multiple acquisition dates, overlapping satellite … Read more

Building Automated Spatial ETL Pipelines with Python, GeoPandas, and Apache Airflow In modern data infrastructure, managing fragile, manual desktop GIS workflows is a major bottleneck for spatial organizations. When analysts rely on ad-hoc Python scripts executed manually on local machines, data updates become slow, error-prone, and impossible to scale. Establishing robust, automated Extract, Transform, Load … Read more

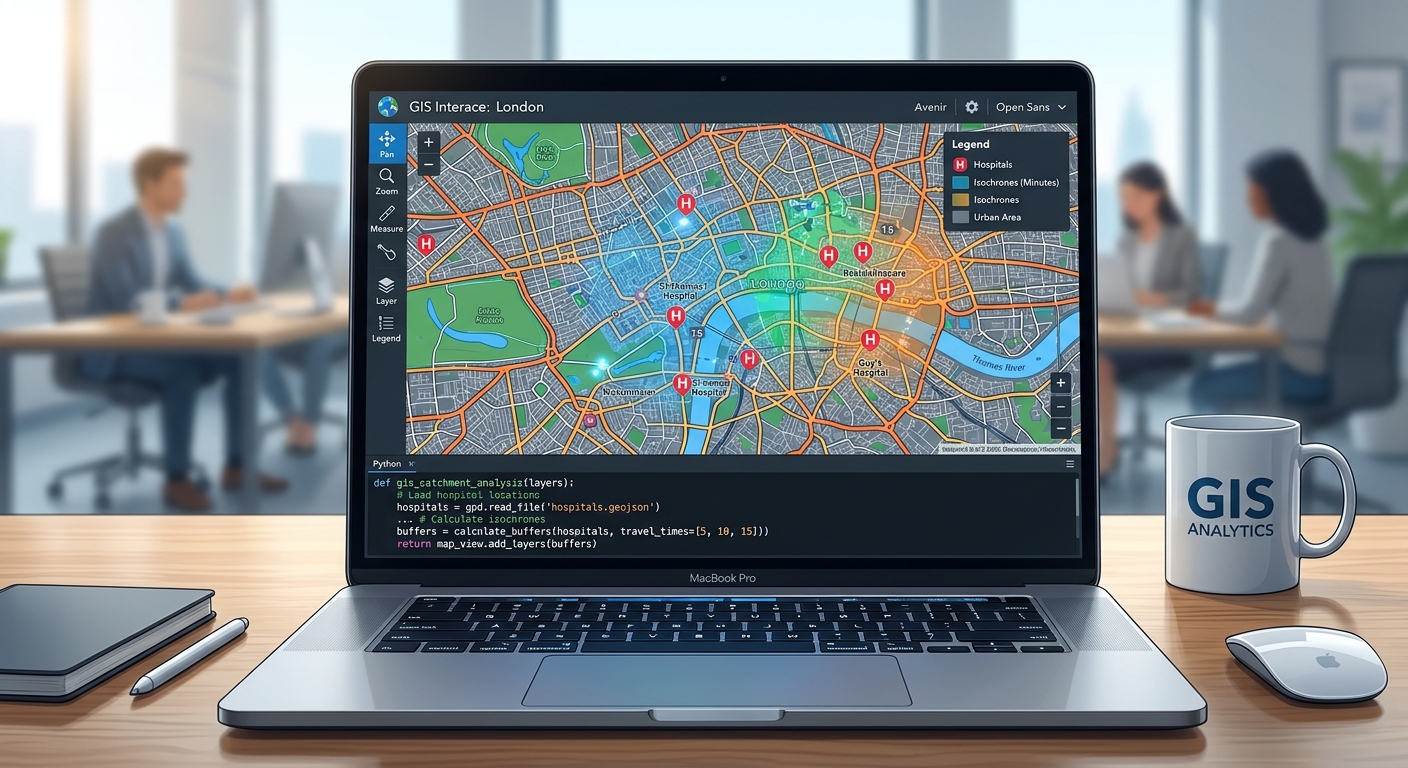
spatial accessibility Python dashboard map

Spatial Accessibility Modeling: Calculating the Two-Step Floating Catchment Area (2SFCA) for Healthcare Deserts By leveraging spatial accessibility Python tools, urban planners and health researchers can effectively model healthcare deserts and evaluate spatial equity in public health infrastructure. Spatial equity in public health infrastructure remains one of the most pressing challenges in modern urban planning and … Read more

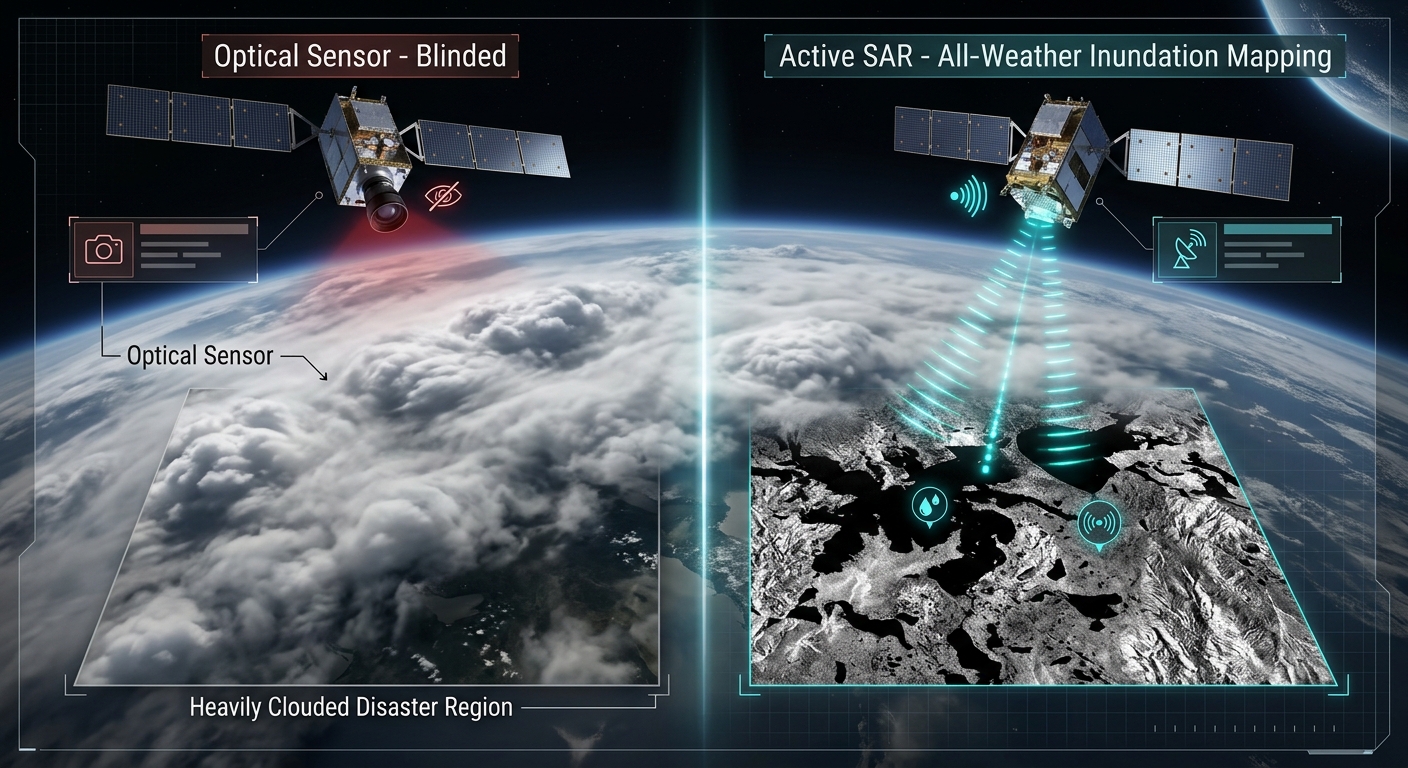
Processing Sentinel-1 Synthetic Aperture Radar (SAR) Data for Flood Inundation Mapping in Python

Visualizing how active Sentinel-1 SAR penetrates cloud cover to perform flood inundation mapping in Python, contrasted with blinded optical sensors.

Processing Sentinel-1 Synthetic Aperture Radar (SAR) Data for Flood Inundation Mapping in Python During extreme hydro-meteorological emergencies and riverine overflow events, optical satellite constellations (such as Sentinel-2 or Landsat) are frequently rendered blind. Persistent heavy cloud cover, dense atmospheric moisture, and torrential precipitation obscure the ground surface precisely when disaster response teams require high-resolution situational … Read more

Building Interactive Spatial Analytics Dashboards in Python with Streamlit and PyDeck

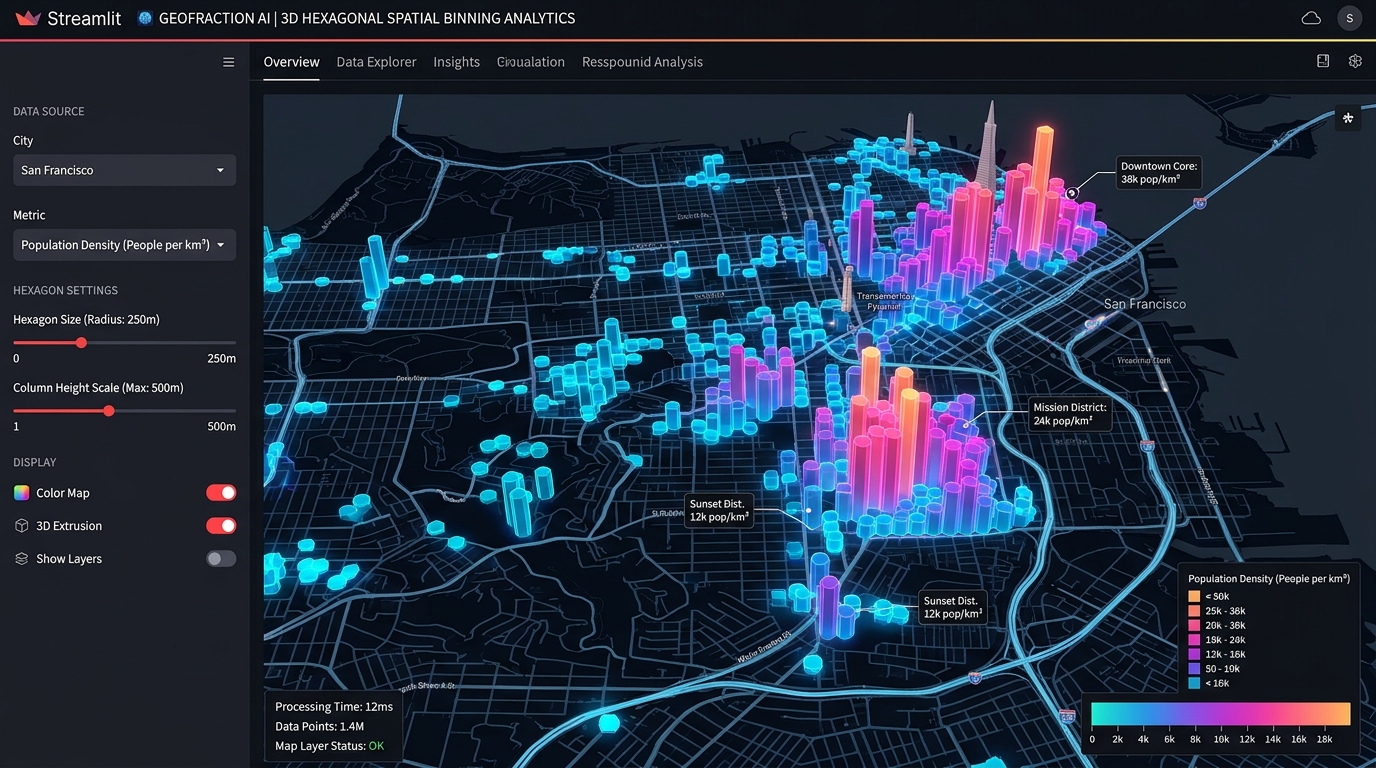
Streamlit PyDeck spatial analytics dashboards 3D hexagon aggregation and column extrusion layer

Building Interactive Spatial Analytics Dashboards in Python with Streamlit and PyDeck Streamlit PyDeck spatial analytics dashboards bridge the gap between heavy desktop GIS software and custom web application development, allowing data scientists to prototype and deploy high-performance 3D spatial visualizations entirely in Python. Data scientists and geospatial analysts frequently face a frustrating architectural bottleneck: transforming … Read more