
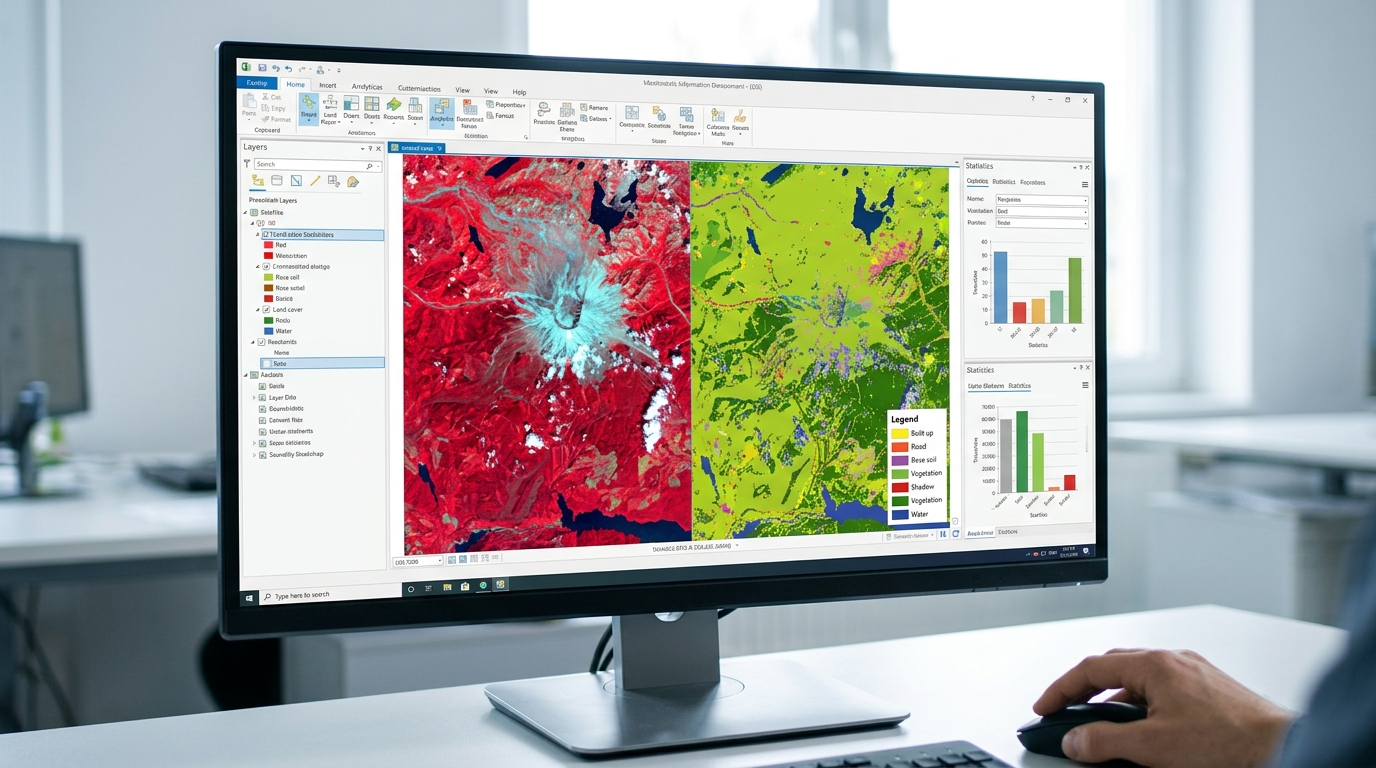
Sentinel-2 vs. Landsat 9 for Vegetation Monitoring: Key Differences & Band Combinations
1. Introduction: Why Sentinel-2 and Landsat 9 Matter for Vegetation Monitoring
Satellite remote sensing has become an essential tool for monitoring vegetation, mapping land use and land cover (LULC), assessing crop health, and studying forest change. Two of the most widely used free satellite datasets for these applications are Sentinel-2 and Landsat 9. If you are handling spatial operations programmatically alongside your imagery, check out this guide on vector data analysis using Python.
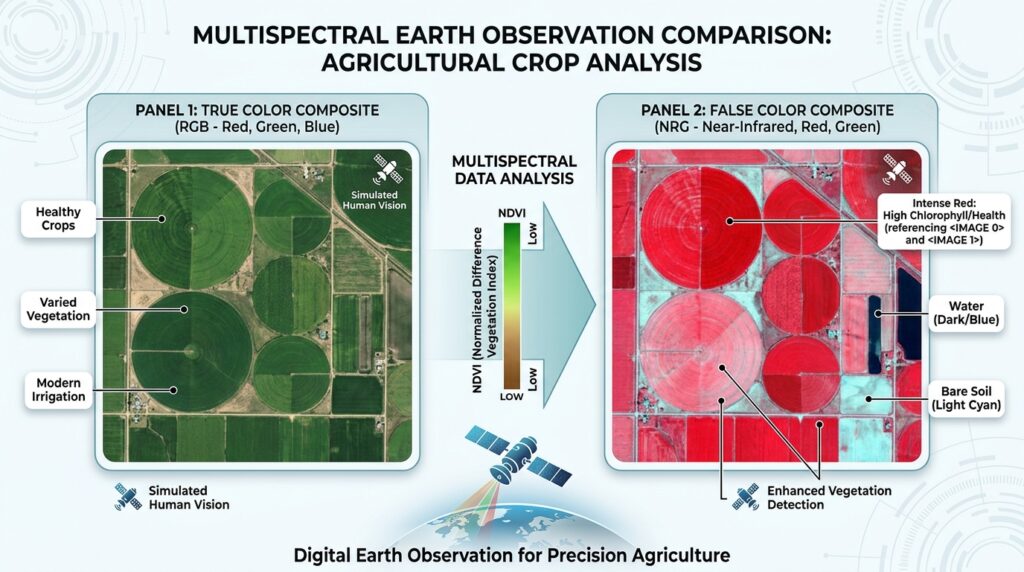
Both missions collect multispectral imagery that allows researchers to distinguish vegetation from bare soil, water, and built-up surfaces. By examining how vegetation reflects visible, near-infrared (NIR), and shortwave-infrared (SWIR) radiation, researchers can estimate vegetation greenness, identify changes in canopy moisture, and monitor seasonal patterns.
However, Sentinel-2 and Landsat 9 are designed with different strengths.
Sentinel-2, operated within the European Union’s Copernicus Programme, provides high-resolution multispectral imagery with dedicated red-edge bands that are particularly valuable for agricultural and forestry research. Landsat 9, operated by the United States Geological Survey (USGS) in partnership with NASA, combines visible and infrared imagery with thermal infrared observations and continues the long-running Landsat Earth observation record.
Both missions provide open-access data at no charge, making them accessible to university students, environmental scientists, and GIS researchers. Copernicus Sentinel-2 and USGS Landsat 9 are suitable starting points for remote sensing projects.
The main question in Sentinel-2 vs Landsat 9 Vegetation Monitoring is not simply which satellite is better. Rather, it is which dataset is best suited to the size of your study area, the vegetation characteristics you need to measure, and the time period you want to investigate.
2. Core Technical Comparison
2.1 Spatial Resolution: 10 m vs. 30 m
Spatial resolution describes the ground area represented by an image pixel. For vegetation monitoring, it determines how well a satellite can distinguish individual fields, forest patches, vegetation corridors, and small land-cover features.
Sentinel-2 offers four bands at 10 m resolution, six at 20 m, and three at 60 m. Landsat 9’s visible, NIR, and SWIR reflective bands generally have a 30 m resolution. Its panchromatic band has a 15 m resolution, while its two thermal bands are acquired at 100 m and distributed in standard products resampled to 30 m.
| Feature | Sentinel-2 MSI | Landsat 9 OLI-2/TIRS-2 |
|---|---|---|
| Standard multispectral resolution | 10 m, 20 m, and 60 m, depending on band | 30 m for reflective multispectral bands |
| Panchromatic band | None | 15 m |
| Thermal infrared | No thermal infrared imaging band | Two thermal bands, 100 m native resolution |
| Small agricultural fields | Better suited to field-level mapping | More mixed pixels in small fields |
| Forest boundary mapping | More detail for smaller patches | Suitable for broader forest patterns |
| Red-edge bands | Four relevant 20 m bands: B5, B6, B7, and B8A | No dedicated red-edge bands |
Sources: Copernicus Sentinel-2 specifications and USGS Landsat 9 specifications.
Why does the difference matter?
A 10 m Sentinel-2 pixel represents 100 m² of ground, whereas a 30 m Landsat 9 reflective pixel represents 900 m². That means a Landsat pixel covers nine times the area of a Sentinel-2 10 m pixel.
For example, a hypothetical 1-hectare agricultural field contains approximately 100 10 m pixels, compared with about 11 complete 30 m pixel-equivalents. Actual usable pixel counts depend on field geometry, alignment, and cloud contamination.
This difference matters when a thesis investigates smallholder farms, fragmented landscapes, narrow riparian vegetation, or changes along forest edges.
Practical recommendation: Choose Sentinel-2 for detailed vegetation mapping where field boundaries and small vegetation patches matter. Landsat 9 is often sufficient for regional land-cover mapping, larger farms, and broad forest-cover assessments.
Remember that resampling a 20 m Sentinel-2 red-edge band to 10 m does not create new 10 m spectral detail.
2.2 Revisit Time and Swath Width
Temporal resolution describes how frequently a satellite can observe the same location. More frequent observations can improve the chances of obtaining cloud-free imagery during important growing stages.
| Characteristic | Sentinel-2 | Landsat 9 |
|---|---|---|
| Swath width | 290 km | 185 km |
| Individual satellite revisit | Approximately 10 days under the nominal mission configuration | 16 days |
| Nominal constellation revisit | 5 days at the equator with two satellites | 8 days when combined with Landsat 8 |
| Vegetation monitoring advantage | More frequent observations under typical conditions | Strong long-term continuity with the Landsat archive |
Sources: Sentinel-2 mission specifications and USGS Landsat acquisition schedules.
As of October 2026, Sentinel-2’s nominal two-satellite configuration uses Sentinel-2B and Sentinel-2C. Sentinel-2A is also operating under an extension campaign that provides additional observations over selected regions, including tropical regions of Africa. Therefore, actual observation frequency can exceed the nominal two-satellite baseline in some areas.
For university projects in Kenya and other cloud-prone tropical environments, the higher observation frequency can be especially useful because clouds may obscure vegetation during key periods of crop development.
However, revisit time is not the same as cloud-free revisit time. A satellite may pass over your study area without providing a usable image. Always inspect cloud cover, cloud shadows, and the availability of observations for your actual dates.
Landsat 9 also benefits from working with Landsat 8. Because their orbits are offset, the two satellites together provide an approximately eight-day observation interval. This is useful for seasonal monitoring when a research project needs consistent 30 m data.
2.3 Spectral Bands: Red Edge vs. Thermal Infrared
Spectral resolution describes the wavelengths a sensor measures. This distinction is particularly important when deciding how to assess vegetation health.
Sentinel-2’s MSI sensor provides 13 spectral bands, including dedicated red-edge bands. Landsat 9 provides nine OLI-2 bands, including visible, NIR, SWIR, panchromatic, and cirrus bands, plus two TIRS-2 thermal infrared bands.
Key Sentinel-2 vegetation bands
| Band | Spectral region | Approximate wavelength | Native resolution | Typical application |
|---|---|---|---|---|
| B2 | Blue | 490 nm | 10 m | Water and atmospheric effects |
| B3 | Green | 560 nm | 10 m | Vegetation reflectance and true-color imagery |
| B4 | Red | 665 nm | 10 m | Chlorophyll absorption and NDVI |
| B5 | Red edge | 705 nm | 20 m | Chlorophyll-sensitive vegetation analysis |
| B6 | Red edge | 740 nm | 20 m | Canopy condition and vegetation differentiation |
| B7 | Red edge | 783 nm | 20 m | Vegetation structure and spectral response |
| B8 | Broad NIR | 842 nm | 10 m | Vegetation vigour and NDVI |
| B8A | Narrow NIR | 865 nm | 20 m | Red-edge indices and vegetation analysis |
| B11 | SWIR 1 | 1610 nm | 20 m | Vegetation and surface moisture |
| B12 | SWIR 2 | 2190 nm | 20 m | Canopy moisture and vegetation disturbance |
Source: Copernicus Sentinel-2 band specifications.
Why are Sentinel-2 red-edge bands important?
Healthy green vegetation absorbs much of the incoming red light for photosynthesis while reflecting strongly in the near-infrared. The transition between red absorption and NIR reflectance is commonly called the red edge.
Red-edge bands capture this transition and can help researchers assess chlorophyll-related differences and vegetation condition. They are particularly useful in crop monitoring, precision agriculture, and some forestry applications.
For example, a researcher studying maize growth could compare red-edge responses across different growth stages to investigate canopy development. Red-edge indices may also help distinguish vegetation conditions that are harder to separate using NDVI alone, especially in dense canopies.
Sentinel-2’s B5, B6, and B7 are dedicated red-edge bands, while B8A is a narrow NIR band that is frequently used alongside them.
Key Landsat 9 vegetation and thermal bands
| Band | Spectral region | Approximate wavelength | Native resolution | Typical application |
|---|---|---|---|---|
| B2 | Blue | 0.45–0.51 µm | 30 m | Visible imagery |
| B3 | Green | 0.53–0.59 µm | 30 m | Vegetation and true-color imagery |
| B4 | Red | 0.64–0.67 µm | 30 m | NDVI and vegetation mapping |
| B5 | NIR | 0.85–0.88 µm | 30 m | Vegetation vigour and NDVI |
| B6 | SWIR 1 | 1.57–1.65 µm | 30 m | Vegetation and surface moisture |
| B7 | SWIR 2 | 2.11–2.29 µm | 30 m | Moisture-related changes and disturbance |
| B8 | Panchromatic | 0.50–0.68 µm | 15 m | Sharper spatial detail in the visible spectrum |
| B10 | Thermal infrared 1 | 10.6–11.19 µm | 100 m | Surface temperature estimation |
| B11 | Thermal infrared 2 | 11.5–12.51 µm | 100 m | Thermal measurements and surface temperature analysis |
Source: USGS Landsat 9 mission specifications.
Landsat 9’s thermal bands provide an important capability that Sentinel-2 does not have: the measurement of emitted thermal infrared radiation. Suitable processed products can be used to estimate land surface temperature, supporting research into vegetation heat stress, urban heat effects, and land-surface energy patterns.
Thermal measurements are not direct measurements of leaf temperature or plant health. Interpreting them requires attention to surface temperature products, land cover, soil moisture, atmospheric conditions, and other factors.
The central distinction is therefore:
- Sentinel-2: Particularly useful for detailed optical vegetation analysis and red-edge-sensitive indices.
- Landsat 9: Particularly useful when broad-scale vegetation mapping must be combined with thermal information and long-term Landsat comparisons.
3. Best Band Combinations for Agriculture and Forestry
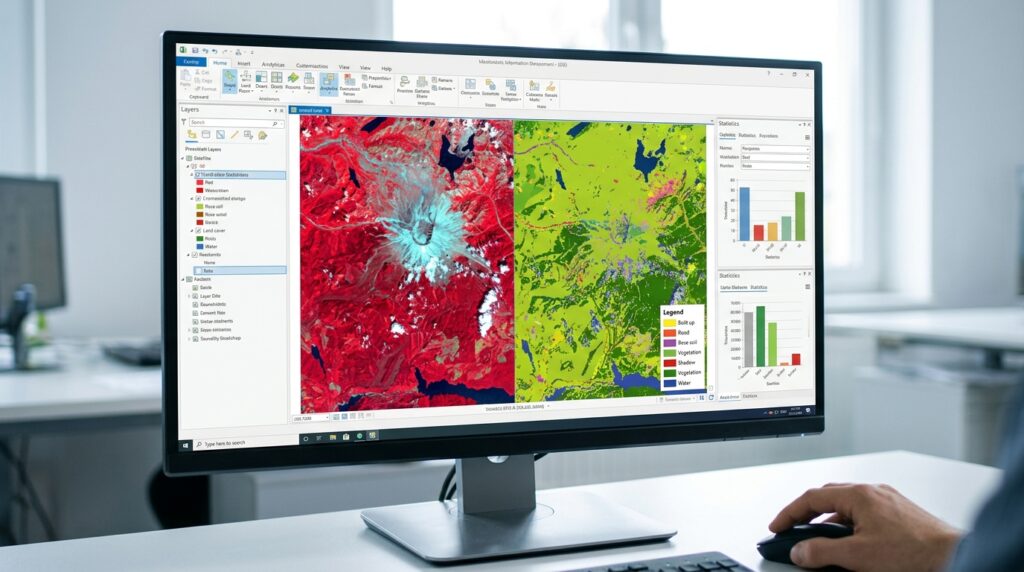
A multispectral image contains measurements from multiple wavelength bands. To display the data as a composite image, the researcher assigns three bands to red, green, and blue display channels.
The resulting colours help interpret the landscape, but they depend on the selected band combination. A false-color composite is an analytical visualization, not a direct representation of how the landscape appears to the human eye.
3.1 Natural Color Composite
Natural-color imagery uses red, green, and blue spectral bands to create an image resembling human vision.
| Satellite | Red display | Green display | Blue display | Band combination |
|---|---|---|---|---|
| Sentinel-2 | B4 | B3 | B2 | 4-3-2 |
| Landsat 9 | B4 | B3 | B2 | 4-3-2 |
For Sentinel-2, this combination uses 10 m bands. For Landsat 9, it uses 30 m bands.
Best uses:
- General land-cover interpretation.
- Identifying settlements, roads, water bodies, and agricultural areas.
- Creating understandable maps for thesis reports and presentations.
- Comparing the broad appearance of an area across dates.
Natural color is a useful first step, but it is not always the best choice for identifying vegetation stress. Healthy and stressed vegetation may look similar in visible wavelengths, especially where field conditions are complex.
3.2 Standard False Color Composite for Vegetation
A standard NIR false-color composite replaces the red display channel with near-infrared data. Since vegetation typically reflects strongly in NIR, vegetated areas commonly appear red or reddish in this visualization.
| Satellite | Red display | Green display | Blue display | Band combination |
|---|---|---|---|---|
| Sentinel-2 | B8 (NIR) | B4 (red) | B3 (green) | 8-4-3 |
| Landsat 9 | B5 (NIR) | B4 (red) | B3 (green) | 5-4-3 |
Source: NASA Earth Observatory, Why Is That Forest Red and That Cloud Blue?.
This is one of the most useful band combinations for vegetation monitoring.
In general, healthy, dense vegetation tends to appear bright red, while sparse vegetation, bare soil, and built-up surfaces have different tones. Water often appears very dark because it absorbs much of the incoming NIR radiation.
The precise colour and brightness depend on the scene, image enhancement, atmospheric conditions, vegetation type, and display stretch.
University application: A student mapping vegetation distribution in a peri-urban area could use Sentinel-2’s 8-4-3 composite to visually distinguish vegetation from built-up land, then use a vegetation index or classification model for quantitative analysis.
Do not rely on colour interpretation alone to determine whether a crop is diseased or water-stressed.
3.3 Red-Edge Vegetation Health Composites
Sentinel-2’s red-edge bands allow researchers to construct composites that emphasize differences in canopy spectral responses.
A useful custom red-edge-enhanced display is:
| Display channel | Sentinel-2 band | Role |
|---|---|---|
| Red | B8A | Narrow NIR response |
| Green | B6 | Red-edge response near 740 nm |
| Blue | B4 | Red reflectance and chlorophyll absorption |
| Composite | 8A-6-4 | Visual examination of vegetation spectral differences |
This is an example of a red-edge-enhanced composite rather than a universal standard. Different band combinations may be more effective for different vegetation types, study objectives, and display settings.
When the objective is to quantify vegetation condition instead of visually comparing colours, consider a red-edge vegetation index.
Normalized Difference Red Edge (NDRE)
One common formulation is:
[
\mathrm{NDRE}=\frac{B8A-B5}{B8A+B5}
]
Here, B8A is narrow NIR reflectance and B5 is red-edge reflectance. NDRE values are typically bounded between -1 and +1 when the input reflectances are non-negative and the denominator is non-zero.
The index can help characterize differences in vegetation canopy conditions and chlorophyll-related responses. It is especially useful to investigate where NDVI becomes less sensitive to changes in dense vegetation.
For comparison, the Normalized Difference Vegetation Index (NDVI) is commonly calculated as:
[
\mathrm{NDVI}=\frac{B8-B4}{B8+B4}
]
Both Sentinel-2 and Landsat 9 can support NDVI calculations, but only Sentinel-2 provides the dedicated red-edge bands needed for this NDRE formulation.
Important processing advice: B5 and B8A are both native 20 m bands, so the NDRE product has a 20 m native spatial resolution. Do not describe it as a genuine 10 m product simply because other Sentinel-2 bands are available at 10 m.
For a forestry thesis, NDRE can complement NDVI when investigating canopy condition, but it should not be treated as a direct measurement of tree health without validation or supporting evidence.
3.4 SWIR Composites for Vegetation Moisture and Disturbance
Shortwave-infrared bands respond to water-related absorption and help differentiate vegetation, soil, and other land-surface conditions.
A useful display can assign SWIR 2 to red, NIR to green, and red reflectance to blue.
| Satellite | Red display | Green display | Blue display | Band combination |
|---|---|---|---|---|
| Sentinel-2 | B12 | B8A | B4 | 12-8A-4 |
| Landsat 9 | B7 | B5 | B4 | 7-5-4 |
The Sentinel-2 composite operates at 20 m native detail because B12 and B8A are 20 m bands. The Landsat 9 reflective composite uses 30 m bands.
These combinations can help distinguish vegetation from bare land, explore moisture-related spectral variation, and investigate disturbances such as burned areas or vegetation loss. They should be interpreted alongside local knowledge and other evidence rather than used as stand-alone proof of a specific disturbance.
4. Which Satellite Should You Choose?
The best dataset depends on the spatial scale and scientific question of your project.
| Research objective | Recommended starting point | Reason |
|---|---|---|
| Smallholder farm mapping | Sentinel-2 | More detailed 10 m visible and NIR imagery |
| Crop growth and seasonal monitoring | Sentinel-2 | Frequent observations and red-edge bands |
| Dense crop canopy analysis | Sentinel-2 | NDRE and other red-edge-sensitive approaches |
| Regional forest-cover mapping | Either | Select based on pixel size and temporal needs |
| Forest monitoring over several decades | Landsat archive, including Landsat 9 | Long historical record |
| Vegetation combined with land surface temperature | Landsat 9 | Includes thermal infrared bands |
| Large-area land-cover classification | Either | Both provide multispectral imagery suitable for classification |
| Comparing changes between recent dates | Sentinel-2 or Landsat 8/9 | Prioritize suitable cloud-free acquisitions and consistent processing |
Choose Sentinel-2 when:
- Your study area contains small farms or fragmented vegetation patches.
- Your research requires red-edge indices such as NDRE.
- You need detailed optical vegetation mapping.
- Your study examines crop phenology and benefits from frequent observations.
Choose Landsat 9 when:
- Your study focuses on regional or landscape-scale patterns.
- You need thermal information for a land surface temperature component.
- Your research benefits from a consistent Landsat-based archive.
- A 30 m reflective pixel size is adequate for your mapping objective.
For long-term studies, distinguish between using Landsat 9 alone and using the broader Landsat archive. Landsat 9 observations begin in 2021, whereas the wider Landsat programme provides a much longer historical record. If the thesis investigates forest loss since the 1990s, for example, Landsat 9 alone cannot provide the entire time series.
Should You Combine Sentinel-2 and Landsat 9?
Yes, combining them can be useful, but it introduces additional processing requirements.
You should not assume that bands with similar names have identical spectral responses or that images with different native resolutions can be compared directly. Differences in wavelength ranges, pixel size, acquisition dates, viewing geometry, and atmospheric correction may influence the results.
For a defensible multi-sensor study:
- Use atmospherically corrected surface reflectance products where appropriate.
- Select acquisitions from comparable seasons and, as far as possible, similar vegetation growth stages.
- Apply cloud and cloud-shadow masking consistently.
- Choose a common analysis grid and document your resampling method.
- Use sensor harmonization or a carefully justified cross-sensor calibration method when comparing quantitative values.
- Validate the resulting maps or indices against field observations, reference data, or another suitable independent dataset.
For an undergraduate thesis, using one primary sensor often produces a simpler and more reproducible methodology. A cross-sensor comparison is best when differences between the datasets are themselves part of the research question.
5. Practical Workflow for a University Thesis
Suppose your thesis investigates seasonal vegetation changes around agricultural land in Kiambu County, Kenya.
A defensible starting workflow would be:
Step 1: Define the research question. Decide whether you are mapping vegetation distribution, estimating relative canopy condition, investigating land-cover change, or assessing temperature-related patterns.
Step 2: Select the imagery. Start with Sentinel-2 Level-2A surface reflectance data for detailed optical vegetation analysis. Consider Landsat 9 Level-2 data if thermal analysis or Landsat-based comparisons are required.
Step 3: Select suitable dates. Choose scenes that represent your research period and relevant crop or vegetation stages. Review cloud cover rather than relying only on the nominal revisit interval.
Step 4: Prepare the imagery. Mask cloud, cirrus, and cloud-shadow pixels using appropriate quality information. Clip the imagery to your area of interest and confirm that all bands align spatially.
Step 5: Generate visual composites. Create natural-color and NIR false-color composites. For Sentinel-2, add a red-edge-enhanced composite if it serves the research objective.
Step 6: Calculate vegetation indices. Use NDVI as a general vegetation indicator, and evaluate NDRE when the Sentinel-2 red-edge response is relevant to the study.
Step 7: Analyze and validate. Compare vegetation patterns across dates, summarize index values within defined areas, and assess map accuracy or index interpretation using independent reference information where possible.
Step 8: Document limitations. Report the native spatial resolution, acquisition dates, cloud conditions, index equations, preprocessing choices, and uncertainty. This information is essential for reproducibility.
A strong thesis does more than produce colourful satellite maps. It explains why the chosen dataset is appropriate, how the imagery was processed, and what the resulting measurements can—and cannot—demonstrate.
6. Summary
Sentinel-2 and Landsat 9 are complementary free satellite datasets for vegetation monitoring.
Sentinel-2 is generally the stronger starting point for detailed optical vegetation studies because its visible and broad NIR bands provide 10 m imagery and its red-edge bands support additional vegetation-sensitive analyses. Landsat 9 offers 30 m reflective imagery alongside thermal observations and benefits from the extensive historical Landsat programme.
For small agricultural fields, detailed vegetation mapping, and red-edge analysis, start with Sentinel-2. For projects that combine landscape-scale monitoring with thermal information, consider Landsat 9. For long-term change detection, evaluate the relevant historical satellite archive rather than limiting the analysis to a single current satellite.
The most defensible choice is the dataset that matches your research scale, scientific question, observation dates, and validation resources.
7. Useful Links for Downloading Satellite Data
Sentinel-2
- Copernicus Data Space Ecosystem: Official access platform for Sentinel data.
- Copernicus Browser: Explore imagery, inspect locations, and find suitable acquisitions.
- Sentinel-2 technical documentation: Band specifications, spatial resolution, and mission details.
For optical vegetation studies, look for Sentinel-2 Level-2A surface reflectance products when available and appropriate to the analysis.
Landsat 9
- USGS EarthExplorer: Search and download Landsat imagery.
- Landsat 9 mission specifications: Sensor characteristics, bands, and spatial resolution.
- Landsat Collection 2 Surface Reflectance: Information about Landsat surface reflectance products.
- Landsat Collection 2 Level-2 products: Information about surface reflectance and surface temperature products.
For quantitative vegetation analysis, prioritize appropriate surface reflectance products over uncorrected digital numbers or display-stretched images. Consult the corresponding product documentation for scaling, quality flags, and processing requirements before calculating indices.