
Top 7 Open-Source Web GIS Tools Every Student Should Know (Leaflet, Mapbox, QGIS Cloud)
1. Introduction: Why Open Source Web GIS Tools Students Matter
Traditional desktop GIS software such as QGIS and ArcGIS Pro is excellent for spatial analysis, cartography, and data preparation. However, when you want to share your results with someone who does not use GIS software, an interactive web map can be far more accessible.
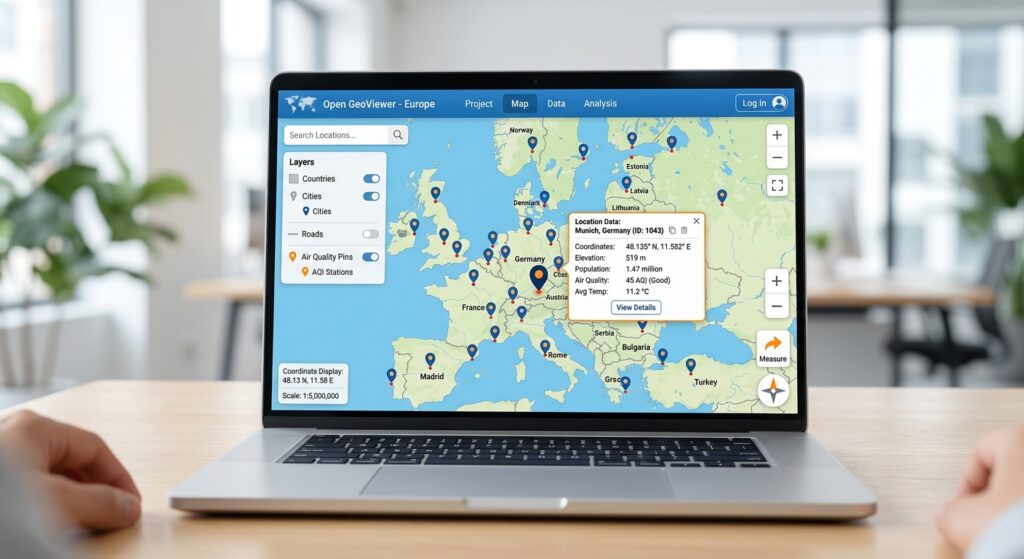
A web map allows users to pan, zoom, select features, filter datasets, explore information through popups, and sometimes interact with spatial analyses directly in a browser.
For GIS students building portfolios, these capabilities offer an opportunity to demonstrate both geographic knowledge and digital development skills.
The good news is that you do not need an expensive desktop GIS licence to begin learning web mapping. Open-source libraries and tools can help you create interactive applications, publish maps online, visualize large spatial datasets, and serve geographic information through standard web services.
There is one important distinction: open-source software does not automatically mean that every basemap, hosting service, or data provider is free. You should always check the relevant licensing, attribution requirements, usage limits, and hosting costs.
This guide introduces seven tools worth exploring. It includes fully open-source libraries and applications, along with useful hosted services and a commercial mapping option that students should understand. As you prepare your spatial files for online publication, you might also want to learn how to export vector formats or handle map interpolation methods.
2. The Seven Essential Web GIS Tools
1. Leaflet.js — Best for Your First Interactive Web Map
<text color=”secondary” size=”sm”>Official website: leafletjs.com</text>
What it does: Leaflet is a lightweight, open-source JavaScript library for building interactive, mobile-friendly web maps. It supports markers, lines, polygons, popups, map controls, and interactions such as clicking on features. See the Leaflet Quick Start Guide.
Leaflet is an excellent starting point if you already know basic GIS but are new to web development.
What can you build?
Imagine you have used QGIS to map healthcare facilities across a county. You can export your point layer to GeoJSON and display it in Leaflet.
Users could click each facility to view its name, type, and other attributes. You could also add layer controls, a search function, or different symbols for different facility categories.
A simple workflow looks like this:
Prepare data in QGIS
        |
        v
Export a clean GeoJSON file
        |
        v
Create an HTML webpage
        |
        v
Add the Leaflet JavaScript library
        |
        v
Display and style the spatial data
        |
        v
Publish the webpage online
Why students should learn Leaflet
- It provides practical experience with HTML, CSS, and JavaScript.
- It supports common vector formats such as GeoJSON.
- It has extensive beginner tutorials and community examples.
- It works well for portfolio maps that need custom popups and simple interactions.
- Its open-source licence makes the library accessible for learning and development.
What do you need to know?
You will need basic HTML and JavaScript to customize a Leaflet application. You also need a source of map tiles or another basemap. Leaflet does not automatically provide a free, unlimited basemap service.
If using OpenStreetMap tiles, follow the provider’s attribution and usage requirements rather than treating its public tile servers as unrestricted hosting infrastructure.
My recommendation: Start here if you want to progress from static GIS maps to real web applications. Build one map with a GeoJSON layer, informative popups, a legend, and a layer control before attempting more advanced features.
Learning resource: Leaflet tutorials and examples.
2. Mapbox GL JS — Best for Sophisticated Vector Map Styling
<text color=”secondary” size=”sm”>Official website: docs.mapbox.com/mapbox-gl-js</text>
What it does: Mapbox GL JS is a JavaScript library for building interactive maps using GPU-accelerated rendering of vector tiles. It supports custom map styles, interactive layers, data-driven styling, and other features useful for modern web applications. See the Mapbox GL JS documentation.
You can use it to create highly customized maps, including detailed urban maps, thematic visualizations, and applications with multiple interactive layers.
What makes it useful?
- Custom basemap styling and visual design.
- Vector-tile rendering for detailed, interactive maps.
- Data-driven symbolization and layer styling.
- Integration with other Mapbox services.
- Support for sophisticated web mapping applications.
For example, you could create an urban planning application that uses different colours for land-use categories, dynamically displays building information, and allows users to switch between customized map styles.
An important open-source distinction
Mapbox GL JS is not open-source software in the strict sense under its current licensing model. Its current service follows Mapbox’s terms, and Mapbox GL JS usage is measured through map loads under its pricing model. Review the Mapbox GL JS pricing documentation before deploying a public application.
For students specifically seeking a free and open-source alternative, consider MapLibre GL JS, an open-source library that also renders vector tiles using WebGL. It has its own ecosystem and documentation at maplibre.org. <text color=”secondary” size=”sm”>(MapLibre documentation)</text>
Mapbox GL JS vs. Leaflet
Leaflet is often the simpler choice for beginners and traditional interactive maps. Mapbox GL JS is useful when you want sophisticated vector rendering and styling integrated with Mapbox’s services. MapLibre GL JS is a strong alternative when open-source licensing is a priority.
My recommendation: Learn Leaflet first, then explore Mapbox GL JS or MapLibre GL JS when you need advanced styling, vector tiles, or more demanding visualizations.
3. QGIS Cloud — Best for Publishing QGIS Maps Quickly
<text color=”secondary” size=”sm”>Official website: qgiscloud.com</text>
What it does: QGIS Cloud is a hosted mapping service that allows users to publish QGIS projects as web maps and make spatial data available through web mapping services.
Unlike a JavaScript mapping library, QGIS Cloud is primarily a publishing service. It is useful when you have already created a map in QGIS and want to share it online without building a complete web application from scratch.
A basic QGIS Cloud publishing workflow
- Open your project in QGIS.
- Install the QGIS Cloud plugin through Plugins → Manage and Install Plugins.
- Create an account and sign in through the plugin.
- Prepare the project, including layer names, symbology, and the desired map extent.
- Use the plugin’s Publish Map function.
- Upload local data when prompted.
- Open the published web map through the link provided by the plugin.
- Inspect the map in a browser to confirm that its layers, styling, and queries work as expected.
Follow the official QGIS Cloud Quickstart for the current publishing workflow.
What can you use it for?
- Publishing a university research map.
- Sharing a local environmental dataset with a project team.
- Demonstrating thematic mapping from QGIS in a portfolio.
- Providing browser-based access to geographic layers and attributes.
- Publishing spatial services without managing your own GIS server.
What are the limitations?
QGIS Cloud is not an entirely open-source, self-hosted platform; it is a hosted service associated with the open-source QGIS ecosystem.
Its free plan has usage restrictions. The published plan information includes public maps for non-commercial and non-government use and a database storage limit, while access-controlled publishing and other features are available through paid offerings. Check the current QGIS Cloud plans before choosing it for a project.
Also remember that a successful upload does not guarantee that every desktop QGIS feature will behave identically in the browser.
My recommendation: If your main goal is to publish a QGIS map quickly rather than learn web programming, begin here. It is particularly useful for getting your first GIS portfolio map online.
4. OpenLayers — Best for Complex Web Mapping Applications
<text color=”secondary” size=”sm”>Official website: openlayers.org</text>
What it does: OpenLayers is a free, open-source JavaScript library for displaying dynamic geographic data in web browsers. It supports tiled maps, vector features, raster layers, coordinate systems, and multiple geospatial data sources. It is released under the BSD 2-Clause licence. See the OpenLayers overview.
OpenLayers offers extensive control over how spatial layers are loaded, displayed, queried, and transformed.
Why use OpenLayers?
Suppose you are building a web GIS application for environmental monitoring. You need to display several datasets, switch between basemaps, examine feature attributes, and integrate services from different sources.
OpenLayers provides a framework for this type of application.
It supports formats and services such as:
- GeoJSON and TopoJSON.
- KML and GML.
- Raster and vector-tile layers.
- OGC web mapping services, including WMS.
- Multiple projections and map-view configurations.
Practical student project
Create a web application that displays rivers, watersheds, rainfall stations, and flood-risk zones. Allow users to switch layers, inspect attributes, and change the view.
You would typically prepare your data first, then write JavaScript to configure the map, create layers, and manage interaction.
My recommendation: Choose OpenLayers when you want greater controYou are not using rich media like images or videos.l over a feature-rich web mapping application and have already become comfortable with JavaScript. For a first simple map, Leaflet is often easier to learn.
Learning resource: OpenLayers examples.
5. Kepler.gl — Best for Exploring Large Geospatial Datasets
<text color=”secondary” size=”sm”>Official website: kepler.gl</text>
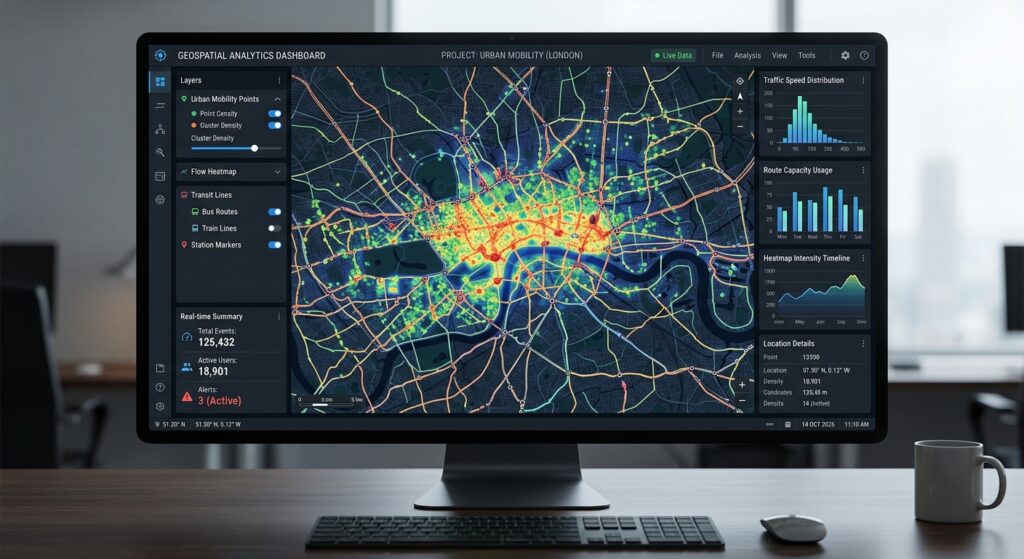
What it does: Kepler.gl is an open-source geospatial visualization tool designed for interactive exploration of large location datasets. It can handle large numbers of points and support spatial aggregations and visualizations directly in the browser.
The project is available under the MIT licence and can also be embedded in applications using React. See the Kepler.gl GitHub repository.
When should you use it?
Kepler.gl is especially valuable when your dataset contains many observations and you want to investigate spatial patterns before building a custom application.
Example projects include:
- Mapping thousands of public transport trips.
- Exploring GPS movement records.
- Visualizing vehicle movements and traffic patterns.
- Comparing spatial distributions of environmental observations.
- Displaying aggregated point patterns using heatmaps or hexagon layers.
A practical workflow
- Load a supported spatial dataset into Kepler.gl.
- Inspect the spatial distribution of the features.
- Choose a visualization type, such as points, arcs, heatmaps, or aggregated cells.
- Configure the appearance and filtering options.
- Explore the distribution at different map scales.
- Save or export the visualization using the available application or integration workflow.
Kepler.gl is primarily a visualization and analysis tool rather than a complete replacement for a web GIS backend. If you want a permanent public application, confirm the appropriate deployment method and hosting requirements.
My recommendation: Use Kepler.gl when your project involves many records and the goal is exploratory visual analysis. It is especially useful for students working with mobility, transport, GPS tracking, or large event datasets.
Learning resource: Kepler.gl documentation.
6. GeoServer — Best for Publishing and Sharing Spatial Data Services
<text color=”secondary” size=”sm”>Official website: geoserver.org</text>
What it does: GeoServer is an open-source server application that publishes spatial data through standardized web interfaces. It allows GIS datasets stored in supported formats and databases to be made available to desktop GIS clients and web applications.
GeoServer supports standards including Web Map Service (WMS), Web Feature Service (WFS), Web Coverage Service (WCS), and Web Map Tile Service (WMTS). See the GeoServer overview.
Why is GeoServer important?
Imagine you are building a web map that needs to access a large administrative boundary dataset stored in a database.
You could download a GeoJSON file directly into the browser, but this becomes less practical as the dataset grows or when several applications need access to the same source.
GeoServer can expose the data through a service:
- WMS: Delivers rendered map images.
- WFS: Provides access to vector features and their attributes.
- WCS: Provides access to supported raster or coverage data.
- WMTS: Delivers map tiles through a standardized interface.
Your Leaflet or OpenLayers application can then request the relevant data from these services instead of loading every dataset directly into the webpage.
What do you need to set up?
- Install GeoServer on an appropriate computer or server.
- Configure a workspace and datastore.
- Connect the spatial dataset or database.
- Publish a layer.
- Configure its CRS and other metadata.
- Test the resulting service endpoint.
- Connect a web mapping client to the published service.
GeoServer’s official user manual provides detailed installation and publication instructions.
GeoServer software is open-source, but operating a public instance requires hosting, configuration, maintenance, and suitable security controls.
My recommendation: Learn GeoServer once you understand basic web maps and want to show that you can publish and manage spatial services. It is an important skill for more advanced web GIS development roles.
7. qgis2web — Best for Turning QGIS Projects into Web Maps Without Coding
<text color=”secondary” size=”sm”>Official project: qgis2web</text>
What it does: qgis2web is a QGIS plugin that exports a QGIS project as a web map using Leaflet or OpenLayers. It attempts to reproduce supported layer styles, the map extent, and relevant layer information, without requiring you to write JavaScript manually.
It is particularly helpful for students who know desktop GIS but have not started learning web programming.
What can you do with it?
You can prepare and symbolize a map in QGIS, export it as an interactive webpage, and then publish the generated files using a suitable static hosting service.
For example, you could create a map of public facilities, configure categorized symbols and popups, and use qgis2web to generate the initial interactive map.
Practical workflow
- Prepare your spatial layers in QGIS.
- Choose appropriate symbology and remove unnecessary attributes from popups.
- Give your layers descriptive names.
- Install qgis2web through Plugins → Manage and Install Plugins.
- Open the qgis2web export interface through its toolbar or menu.
- Choose Leaflet or OpenLayers as the export library.
- Configure the available controls, popups, and other export options.
- Export the web map to a folder.
- Test the generated
index.htmland associated files. - Publish the resulting files to an appropriate static web host.
See the qgis2web official repository and QGIS plugin listing.
What should you know before using it?
qgis2web does not reproduce every QGIS feature or processing operation. Complex symbology, certain labeling behaviours, advanced rendering, and large datasets may require simplification or further coding.
For GeoJSON-based exports, qgis2web does not require a GIS server. However, the exported files still need a place to be hosted if you want to make the map publicly accessible.
My recommendation: This is one of the best ways for a desktop GIS student to build a first interactive portfolio project. Use it to publish something quickly, then inspect the generated HTML and JavaScript to learn how web maps work behind the scenes.
3. Summary Comparison Table
The tools below are not identical categories: some are JavaScript libraries, some are applications, and others are hosting or server solutions. Use this table to choose the right starting point.
| Tool | Skill level | Hosting requirement | Best use case | Coding required? |
|---|---|---|---|---|
| Leaflet.js | Beginner to intermediate | Static web host; basemap source as needed | Lightweight interactive maps and simple web applications | Yes |
| Mapbox GL JS | Intermediate | Web host and Mapbox service/account as needed | Custom vector maps and advanced map styling | Yes |
| QGIS Cloud | Beginner | Managed cloud service | Publishing QGIS maps quickly | No, for basic publishing |
| OpenLayers | Intermediate to advanced | Web host; data services as needed | Complex applications and multi-source data integration | Yes |
| Kepler.gl | Beginner for its hosted or browser interface; advanced for custom integration | Depends on whether you use the existing application or deploy your own | Large-data exploration and spatial visualization | No for basic exploration; yes for custom apps |
| GeoServer | Intermediate to advanced | A server or managed deployment | Publishing WMS, WFS, WCS, and related spatial services | Configuration required; coding is not necessary for basic publishing |
| qgis2web | Beginner | Static web host for public access | Exporting QGIS maps as interactive webpages | No for basic export |
Open-source note: Mapbox GL JS and QGIS Cloud need to be treated differently from the fully open-source libraries and applications. Mapbox GL JS operates under Mapbox’s current licensing and pricing model; MapLibre GL JS is the open-source alternative. QGIS Cloud offers a hosted service with free and paid plans, rather than being a wholly self-hosted open-source publishing stack.
Hosting, basemaps, data services, and storage can have their own fees and restrictions even when the main mapping software is free.
4. Recommended Learning Path for GIS Students
The best learning path depends on what you already know. A student who is comfortable with QGIS but has never coded should start differently from someone who already knows Python and JavaScript.
Path A: You know QGIS but have no programming experience
Start with qgis2web.
Your first goal is to publish one interactive map with informative popups and a clear legend. This lets you practice preparing web-friendly spatial data without having to learn JavaScript immediately.
Then:
- Publish a second map using QGIS Cloud.
- Learn how to prepare clean GeoJSON datasets.
- Study basic HTML and CSS.
- Build your first Leaflet application.
At this point, you will understand both desktop-based web-map publishing and the basics of coding your own application.
Path B: You know basic Python but not JavaScript
Begin with Kepler.gl to explore spatial datasets visually, while learning how GeoJSON and spatial attributes are structured.
Then:
- Use GeoPandas to prepare and export spatial data.
- Learn basic HTML and JavaScript.
- Follow the Leaflet Quick Start Guide.
- Connect your own GeoJSON file to a Leaflet map.
- Add popups, layer controls, and a simple filter.
This pathway combines your data-processing skills with the ability to present spatial results interactively.
Path C: You already know HTML, CSS, and JavaScript
Start with Leaflet or MapLibre GL JS.
- Choose Leaflet for straightforward vector overlays, markers, popups, and interactive controls.
- Choose MapLibre GL JS if you want a modern, GPU-accelerated vector-tile workflow and custom style definitions.
Next, learn OpenLayers if you need broader support for complex data sources and map-service integration.
Finally, learn GeoServer and a spatial database such as PostGIS when your applications require centralized datasets, reusable services, or more sophisticated data management.
A practical four-project portfolio roadmap
<box gap={3}> <row gap={3} align=”start”> <AsyncImage query=”interactive Leaflet map with point markers and popups web GIS beginner project screenshot” aspectRatio=”4:3″ width=”112px”/> <box flex=”1″ gap={1}> **Project 1: Interactive facility map** <text color=”secondary” size=”sm”>Build a map of schools, hospitals, or water points with popups and a layer control. Use Leaflet or qgis2web.</text> </box> </row> <divider color=”subtle”/> <row gap={3} align=”start”> <AsyncImage query=”interactive choropleth web GIS map administrative regions with legend clean web mapping portfolio screenshot” aspectRatio=”4:3″ width=”112px”/> <box flex=”1″ gap={1}> **Project 2: Thematic web map** <text color=”secondary” size=”sm”>Publish a choropleth or environmental map with a meaningful legend and well-prepared GeoJSON data.</text> </box> </row> <divider color=”subtle”/> <row gap={3} align=”start”> <AsyncImage query=”kepler.gl geospatial data visualization map showing thousands of transit trip lines and point clusters dashboard” aspectRatio=”4:3″ width=”112px”/> <box flex=”1″ gap={1}> **Project 3: Spatial data exploration** <text color=”secondary” size=”sm”>Explore a large mobility or environmental dataset in Kepler.gl and explain the patterns in your findings.</text> </box> </row> <divider color=”subtle”/> <row gap={3} align=”start”> <AsyncImage query=”OpenLayers web GIS application with multiple spatial layers and geospatial server data overlay developer interface” aspectRatio=”4:3″ width=”112px”/> <box flex=”1″ gap={1}> **Project 4: Web GIS with spatial services** <text color=”secondary” size=”sm”>Build a more advanced map using OpenLayers or Leaflet connected to a GeoServer service.</text> </box> </row> </box>
For each project, include a screenshot, a working link where possible, a short explanation of the research question, your data sources, and the methods used. Link the source code or describe how the map was generated.
5. Final Recommendations
You do not need to learn all seven tools at once. The most effective approach is to start with one tool that matches your current skills, finish a small project, and build on what you learn.
- Best starting point for QGIS users: qgis2web.
- Best first coding library: Leaflet.
- Best quick publishing service: QGIS Cloud, subject to its current plan restrictions.
- Best for complex web mapping: OpenLayers.
- Best for large geospatial visualizations: Kepler.gl.
- Best for publishing spatial services: GeoServer.
- Best advanced vector-rendering options: MapLibre GL JS for an open-source approach, or Mapbox GL JS if its services and licensing fit your requirements.
The larger lesson is that web GIS combines geographic knowledge with data preparation, visualization, application development, and publishing. Those skills can complement desktop GIS experience and help you produce projects that are easier for other people to explore.
For a first web GIS portfolio, build one complete application before collecting more tools. A well-designed, working map with clean data, readable popups, clear attribution, and a concise project explanation will teach you more—and demonstrate more—than seven unfinished experiments.