
Supervised vs. Unsupervised Image Classification: Ultimate Beginner’s Guide
Introduction: Why Image Classification Matters
Supervised vs Unsupervised Image Classification GIS methods are essential because satellite images contain enormous amounts of information, but a raw image does not automatically tell us which pixels represent forest, water, buildings, cropland, or bare soil. Image classification converts the spectral information in satellite imagery into meaningful land-cover categories.
This process is fundamental to remote sensing land cover mapping and Land Use/Land Cover (LULC) analysis. For example, a student studying urban expansion might classify an image into built-up areas, vegetation, water, and bare land. The resulting classified map can then be used to measure how land cover has changed over time.
There are two major approaches: unsupervised classification and supervised classification. The main difference is simple:
Unsupervised classification lets the computer find spectral groups. Supervised classification lets the user tell the computer what the important land-cover classes look like.
Understanding this difference is essential when choosing a classification method for a GIS or remote-sensing project.
1. Unsupervised Classification Explained
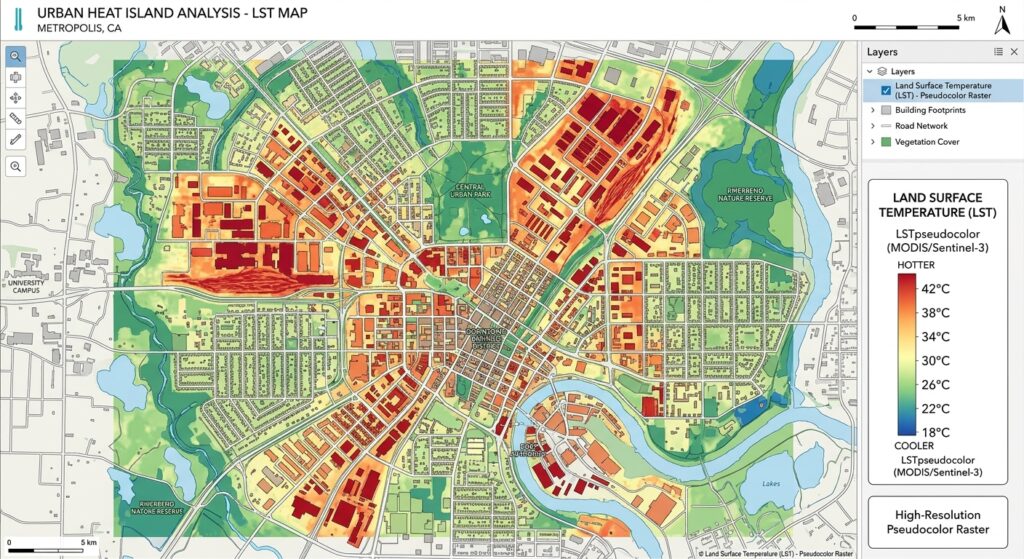
What Is Unsupervised Classification?
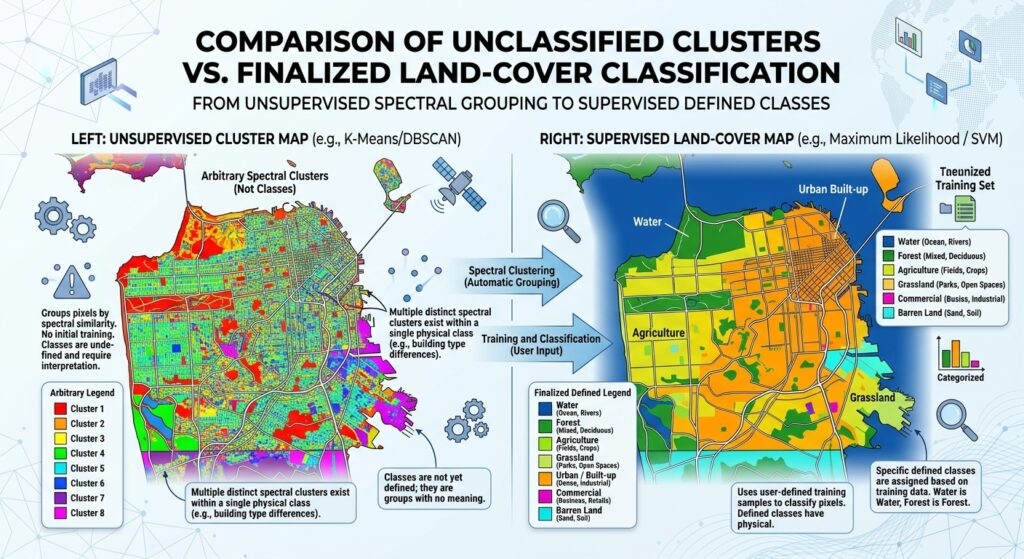
In unsupervised image classification, the algorithm analyzes the spectral values of pixels and automatically groups pixels that have similar characteristics.
The user does not initially provide training samples identifying forests, buildings, water, or other classes.
Instead, the computer asks:
“Which pixels have similar spectral characteristics?”
It then creates groups called clusters.
For example, an algorithm might divide an image into 10 spectral clusters:
Satellite Image
      ↓
Spectral analysis
      ↓
Cluster 1
Cluster 2
Cluster 3
...
Cluster 10
      ↓
User interprets the clusters
      ↓
Forest / Water / Urban / Soil / etc.
The important point is that the initial clusters are spectral classes, not necessarily meaningful land-cover classes.
For example:
- Cluster 1 might mostly represent water.
- Cluster 2 might represent vegetation.
- Cluster 3 might contain buildings.
- Cluster 4 could contain both bare soil and some urban surfaces.
You must inspect and interpret the clusters afterward.
K-Means Clustering GIS
K-Means is one of the most commonly discussed unsupervised classification algorithms.
You first specify the number of clusters you want, such as:
Number of clusters = 8The algorithm then attempts to organize pixels into eight groups based on their spectral similarity.
Conceptually:
Pixels
 ↓
Choose K clusters
 ↓
Find cluster centers
 ↓
Assign pixels to nearest center
 ↓
Recalculate centers
 ↓
Repeat until clusters stabilize
The algorithm does not know that you want “forest” or “buildings.” It only knows that some pixels have similar spectral values.
ISODATA
ISODATA (Iterative Self-Organizing Data Analysis Technique) is another unsupervised approach.
Like K-Means, it groups pixels based on spectral similarity, but it can perform additional operations such as splitting or merging clusters depending on their characteristics.
This makes ISODATA useful when you do not know in advance exactly how many meaningful spectral groups exist in your imagery.
Advantages of Unsupervised Classification
1. Minimal user input
You do not need to create detailed training polygons before running the classification.
2. Fast initial exploration
Unsupervised classification can quickly reveal patterns in an unfamiliar satellite image.
3. Useful when reference information is limited
If you do not have reliable field observations or existing land-cover samples, clustering can provide a starting point.
4. Good for exploratory analysis
It can help you understand the spectral complexity of a study area before designing a more detailed supervised classification.
Disadvantages of Unsupervised Classification
1. Spectral clusters are not automatically land-cover classes
A cluster does not necessarily equal “forest” or “urban.”
2. Different land covers can have similar spectral signatures
For example, dry vegetation and bare soil may have similar spectral responses in some imagery.
3. One land-cover type can appear in multiple clusters
Vegetation may vary because of:
- Species
- Growth stage
- Moisture
- Shadows
- Soil background
As a result, one “forest” class may be divided into several clusters.
4. Interpretation is still required
The computer creates the clusters, but the analyst must determine what those clusters actually represent.
Best Uses for Unsupervised Classification
Use unsupervised classification when:
- You are exploring a new study area.
- You have limited training data.
- You want a quick preliminary classification.
- You do not know the spectral variability of the study area.
- You want to identify potential classes before creating training samples.
For beginners, it is particularly useful as an exploratory tool.
2. Supervised Classification Explained
What Is Supervised Classification?
In supervised classification, you provide the computer with examples of the land-cover classes you want it to identify.
These examples are called training samples, training polygons, or Regions of Interest (ROIs).
For example, you might create training samples for:
- Water
- Forest
- Cropland
- Built-up area
- Bare soil
The algorithm examines the spectral characteristics of these known samples and learns how to distinguish the classes.
The workflow looks like this:
Satellite Image
      ↓
Create training samples
      ↓
Water / Forest / Urban / Soil
      ↓
Train classification algorithm
      ↓
Classify remaining pixels
      ↓
Land-cover map
The quality of your training samples has a major influence on the final classification.
3. Creating Training Samples
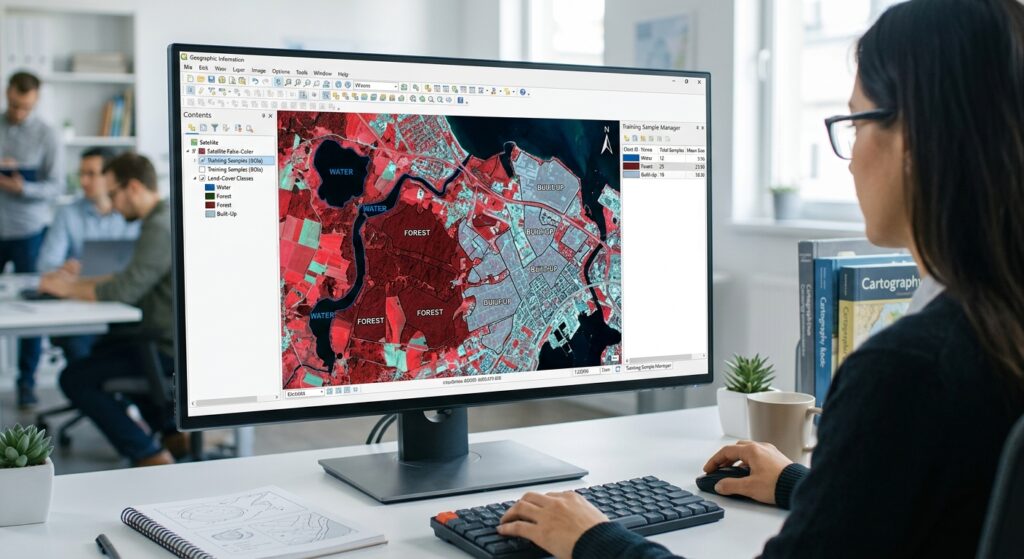
What Is an ROI?
An ROI (Region of Interest) is an area of the image that you identify as belonging to a particular land-cover class.
For example, if you want a water class, you might draw several polygons over clearly visible lakes or rivers.
You could create:
Class 1 → Water
Class 2 → Forest
Class 3 → Cropland
Class 4 → Built-up
Class 5 → Bare soil
Try to collect training samples from different parts of the study area rather than drawing one tiny polygon for each class.
Good training samples should be:
- Clearly identifiable.
- Representative of the class.
- Spatially distributed across the study area.
- Large enough to capture spectral variability.
- Free from mixed pixels where possible.
For example, a forest training sample should preferably be placed well inside a forest rather than directly along a forest-road boundary.
4. Supervised Classification Algorithms
Several algorithms can use your training samples.
Random Forest
Random Forest is a machine-learning classification method based on many decision trees.
Instead of relying on a single decision tree, Random Forest combines the predictions of multiple trees to produce the final class.
It is popular because it can handle:
- Multiple input bands
- Nonlinear relationships
- Complex spectral patterns
- Large classification problems
Random Forest is particularly useful when your classes have complicated spectral characteristics.
Maximum Likelihood Classification
Maximum Likelihood Classification (MLC) is a traditional statistical supervised classification method.
It uses the statistical characteristics of your training samples, including their spectral means and variability, to estimate the most likely class for each pixel.
Conceptually:
“Given this pixel’s spectral values, which training class is it statistically most likely to belong to?”
This is why Maximum Likelihood QGIS workflows are often introduced in university remote-sensing courses: the method provides a clear connection between training data, spectral statistics, and classification.
However, Maximum Likelihood generally relies on assumptions about the statistical distribution of the classes. These assumptions may not always match real-world satellite data.
5. Advantages of Supervised Classification
1. Greater control
You define the classes that the final map should contain.
2. Classes have real-world meaning
Instead of simply receiving “Cluster 1,” you can directly create classes such as Forest or Built-up Area.
3. Can produce accurate results
When training samples are representative and the algorithm is appropriate, supervised classification can produce highly useful land-cover maps.
4. Suitable for specific research questions
If your project specifically requires five defined land-cover classes, supervised classification gives you direct control over those categories.
6. Disadvantages of Supervised Classification
1. Requires training data
You need reliable examples of each land-cover class.
2. Training sample quality matters
Poor training samples can produce poor classifications.
3. Requires prior knowledge
You need to understand the study area well enough to identify representative examples of each class.
4. Can introduce analyst bias
Because the analyst chooses the training samples, their decisions can influence the final map.
7. Supervised vs. Unsupervised Classification: Direct Comparison
| Attribute | Unsupervised Classification | Supervised Classification |
|---|---|---|
| User Input | Minimal initial input; user specifies clustering parameters | Requires training samples/ROIs |
| Speed | Usually fast for initial exploration | Requires additional time for training and preparation |
| Accuracy | Depends heavily on how clusters are interpreted and merged | Can be high when training data and algorithm are appropriate |
| Required Prior Knowledge | Lower | Higher |
| Best For | Exploring unknown areas and discovering spectral patterns | Producing defined LULC maps for specific project objectives |
The simplest way to remember it
Unsupervised:
Computer finds the groups → Student interprets the groups.
Supervised:
Student defines the classes → Computer learns the classes.
8. Accuracy Assessment
Creating a classified image is not the end of the project.
You need to determine:
How accurate is my classification?
This is called accuracy assessment.
Training Samples vs. Validation Samples
Do not use exactly the same samples for both training and validation.
Training samples
These are used to teach the classification algorithm what each class looks like.
Validation samples
These are independent reference points or polygons used to test the final classified map.
The basic workflow is:
Training data
     ↓
Train classifier
     ↓
Classified image
     ↓
Independent validation data
     ↓
Accuracy assessment
Using independent validation data gives you a more realistic estimate of classification performance.
9. Confusion Matrix
A Confusion Matrix compares the classified result with reference data.
For example:
| Reference / Classified | Water | Forest | Urban | Soil |
|---|---|---|---|---|
| Water | 95 | 2 | 1 | 2 |
| Forest | 3 | 88 | 5 | 4 |
| Urban | 1 | 4 | 91 | 4 |
| Soil | 2 | 5 | 6 | 87 |
The diagonal values represent correctly classified samples.
For example:
- 95 water samples were correctly classified as water.
- 88 forest samples were correctly classified as forest.
- 91 urban samples were correctly classified as urban.
- 87 soil samples were correctly classified as soil.
Values outside the diagonal represent classification errors.
Overall Accuracy
A basic measure is Overall Accuracy:
Overall Accuracy =
Correctly Classified Samples
----------------------------
Total Validation Samples
For example, if 361 out of 400 validation samples were correctly classified:
Overall Accuracy = 361 / 400 × 100

                 = 90.25%
Kappa Coefficient
The Kappa Coefficient has traditionally been used to measure agreement between the classified map and reference data while accounting for agreement that could occur by chance.
A simplified interpretation is:
| Kappa | General interpretation |
|---|---|
| < 0 | Poor agreement |
| 0–0.20 | Very low |
| 0.21–0.40 | Fair |
| 0.41–0.60 | Moderate |
| 0.61–0.80 | Substantial |
| 0.81–1.00 | Very high |
These categories should be treated as general guidelines rather than universal scientific thresholds.
Important: Modern remote-sensing accuracy assessment increasingly emphasizes the confusion matrix, class-specific accuracy measures, sampling design, and confidence intervals rather than relying on Kappa alone. If your university assignment specifically requires Kappa, report it, but also include overall accuracy and class-level measures where possible.
10. Which Method Should a Student Choose?
The right choice depends on your assignment.
Choose Unsupervised Classification If:
- Your instructor asks you to investigate spectral patterns.
- You have little reference information.
- You are unfamiliar with the study area.
- You want to explore the image before designing a classification.
- You need a quick preliminary land-cover classification.
For example:
“Identify major spectral clusters in a Landsat image and interpret their likely land-cover types.”
An unsupervised method such as K-Means clustering GIS would be appropriate.
Choose Supervised Classification If:
- Your assignment specifies particular land-cover classes.
- You can identify reliable training areas.
- You have reference data or high-resolution imagery.
- You need a final LULC map.
- Accuracy assessment is an important part of the project.
For example:
“Produce a land-cover map containing water, forest, cropland, urban areas, and bare soil.”
A supervised algorithm such as Random Forest or Maximum Likelihood would be a logical choice.
11. A Practical Student Workflow
If you are unsure which approach to use, this workflow is useful:
1. Obtain satellite imagery
          ↓
2. Inspect the study area
          ↓
3. Run an unsupervised classification
          ↓
4. Examine spectral clusters
          ↓
5. Identify major land-cover types
          ↓
6. Create representative training samples
          ↓
7. Run supervised classification
          ↓
8. Validate the classification
          ↓
9. Produce the final LULC map
This approach allows unsupervised classification to act as an exploratory step, while supervised classification produces a more controlled final product.
Conclusion: Which One Should You Use?
The difference between supervised vs. unsupervised image classification GIS methods comes down to who defines the classes.
With unsupervised classification, the computer searches for groups of spectrally similar pixels using algorithms such as K-Means or ISODATA. It is useful when you are exploring an unfamiliar image or have limited prior information.
With supervised classification, you provide training samples representing known land-cover classes. Algorithms such as Random Forest and Maximum Likelihood then use those samples to classify the rest of the image.
For most university LULC projects, ask yourself three questions:
- Do I already know the land-cover classes I need?
- Can I create reliable training samples for those classes?
- Do I need to produce and validate a specific land-cover map?
If the answer is yes, supervised classification is usually the better starting point.
If you are still exploring the image and do not have reliable training information, begin with unsupervised classification.
Most importantly, remember that the classification algorithm is only one part of the workflow. Good imagery, representative training or reference samples, appropriate preprocessing, and a rigorous accuracy assessment can matter just as much as the choice between K-Means, Maximum Likelihood, Random Forest, or another classifier.