

How to Create an Interactive Web Dashboard with ArcGIS Dashboards
Introduction: What Is ArcGIS Dashboards?
ArcGIS Dashboards is a web-based application within the ArcGIS platform that allows GIS professionals to present spatial data, operational indicators, charts, and interactive maps in one place. It helps decision-makers monitor activities, identify spatial patterns, and understand changing conditions without having to open desktop GIS software.
For example, a county government might use a dashboard to monitor reported incidents, track response times, compare activity across administrative wards, and identify areas requiring additional resources. A logistics company could use one to visualize deliveries, monitor vehicle statuses, and summarize outstanding orders.
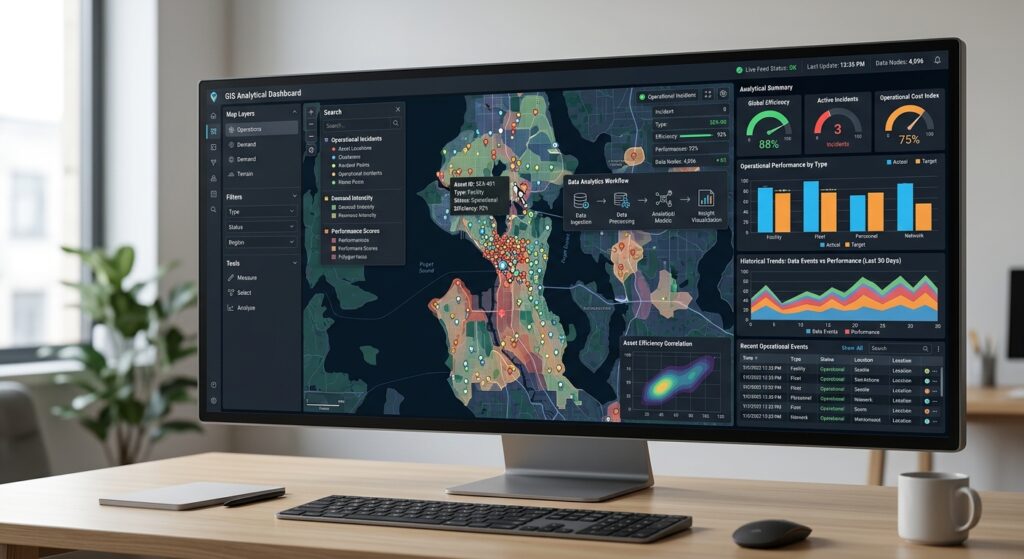
An effective dashboard combines several visual elements:
- Interactive maps to show where events or assets are located.
- Indicators to summarize important numbers, such as total incidents or completed inspections.
- Gauges to show performance against a target or acceptable range.
- Serial charts to compare categories or track changes over time.
- Actions and filters to let users explore the data and focus on specific locations, dates, or categories.
These elements work together, allowing users to move from a high-level overview to more detailed spatial information.
This tutorial explains how to create an interactive web dashboard using ArcGIS Online and ArcGIS Dashboards, from preparing a web map to configuring actions, arranging the layout, and sharing the final application.
Official reference: Introduction to ArcGIS Dashboards.
1. Prerequisites
Before you begin, prepare the following resources.
1.1 An ArcGIS Online account
You need an ArcGIS Online account with the privileges required to create dashboard content and access the data you intend to use. Publishing a hosted feature layer may require additional organizational privileges.
Sign in at ArcGIS Online.
1.2 A hosted feature layer
A hosted feature layer stores geographic features and their attributes in ArcGIS Online. It can provide the data used by your map, indicators, gauges, and charts.
For this tutorial, assume that you have an incident dataset containing the following fields:
| Field | Description | Example |
|---|---|---|
Incident_ID |
Unique incident identifier | INC001 |
Status |
Current incident status | Open |
Priority |
Incident priority | High |
District |
Administrative district | Central |
Reported_Date |
Date and time reported | 2026-10-14 |
Response_Minutes |
Response duration in minutes | 35 |
The dataset should also contain the required geographic information, such as point coordinates or existing feature geometry.
If you have a CSV, Excel file, Shapefile, GeoJSON, or supported geodatabase, you can publish the data as a hosted feature layer. The exact publishing workflow depends on the source format.
See Publish hosted feature layers in ArcGIS Online.
1.3 A web map
A web map combines spatial layers, a basemap, symbology, pop-ups, and map settings. ArcGIS Dashboards can use its operational layers as data sources for other dashboard elements.
Before creating the dashboard, it is good practice to prepare and save your web map.
1.4 A clear dashboard objective
For this exercise, the objective is to create an Incident Monitoring Dashboard that allows users to:
- View the geographic distribution of incidents.
- Monitor the total number of open incidents.
- Review average response time.
- Compare incident volumes by district.
- Select a district in a chart and filter the map to that district.
Defining this objective first helps determine which elements are essential and which would create unnecessary clutter.
2. Step One: Prepare a Web Map in ArcGIS Online

The web map is the foundation of the dashboard. Configuring it before opening ArcGIS Dashboards helps ensure that your layers, symbols, and pop-ups are ready for use.
Step 2.1: Open Map Viewer
- Sign in to ArcGIS Online.
- Open Content → My content.
- Find your hosted feature layer.
- Open it in Map Viewer, or create a new map and add the layer.
Depending on your interface, you can also open Map Viewer from the application launcher.
Confirm that the layer displays in the correct geographic location.
Step 2.2: Configure layer symbology
In Map Viewer, open the Layers pane and select your incident layer.
Use the layer’s styling settings to distinguish features by an attribute such as Priority or Status.
For example:
- High priority: red.
- Medium priority: orange.
- Low priority: blue.
- Resolved: a muted color.
Choose colors that remain distinguishable against the basemap. Avoid using color alone to communicate critical information when labels or other visual cues could improve accessibility.
For point layers, consider whether clustering is appropriate. Clustering may reduce visual clutter when many features are close together, although it can affect the types of interactive layer actions available in a dashboard.
Step 2.3: Configure pop-ups
Pop-ups display descriptive information when a user selects a feature on the map.
To configure them:
- In Map Viewer, select the incident layer in the Layers pane.
- Open the Pop-ups settings from the Settings toolbar.
- Ensure that pop-ups are enabled.
- Set a descriptive title, such as
{Incident_ID}. - Select the fields that users should see.
- Configure field labels and number or date formats as needed.
- Save the web map.
For example, a useful incident pop-up might display:
- Incident identifier.
- Status.
- Priority.
- District.
- Reported date.
- Response time.
Remove unnecessary fields such as internal IDs that are not useful to the intended audience. Keep sensitive information out of pop-ups unless the audience is explicitly authorized to view it.
Esri provides additional options for configuring fields, charts, text, and other pop-up content in its Configure pop-ups documentation.
Step 2.4: Set the default extent and save
Zoom to the geographic area you want users to see when the dashboard opens.
Ensure that the important operational layer is visible and has appropriate scale visibility settings. If useful, create bookmarks or configure other map settings that help users return to important locations.
Save the web map with a clear name, such as:
Incident Monitoring Web Map
You now have a prepared web map that can serve as the primary spatial element in your dashboard.
3. Step Two: Create a New Dashboard
Once the web map is ready, create the dashboard in ArcGIS Dashboards.
Step 3.1: Open ArcGIS Dashboards
- Return to ArcGIS Online.
- Open the application launcher in the site header.
- Select Dashboards.
- Click Create dashboard.
The dashboard creation interface may also provide ways to start from your content or an existing map.
Step 3.2: Enter the dashboard details
Provide a descriptive title:
Incident Monitoring Dashboard
You can also add:
- A summary explaining the purpose of the dashboard.
- Search tags such as
GIS,incident monitoring, andoperations. - A folder for organizing the item.
Click Create dashboard.
The dashboard editor opens with a layout where you can add maps, charts, indicators, gauges, and other elements.
Step 3.3: Understand the dashboard layout
ArcGIS Dashboards uses a docking layout that organizes elements into rows and columns. Elements can be resized, moved, grouped, or stacked into tabs.
The dashboard editor also provides a view or layout pane that helps you manage the structure of the page.
A practical desktop layout for this tutorial is:
+------------------------------------------------------+
|             INCIDENT MONITORING DASHBOARD            |
+----------------+----------------+--------------------+
| Open Incidents | Avg Response   | Incidents Reported |
|   Indicator    |    Gauge       |    Indicator       |
+-------------------------+----------------------------+
|                         |                            |
|      Interactive Map    |   Incidents by District   |
|                         |       Serial Chart        |
|                         |                            |
+-------------------------+----------------------------+
This is a conceptual layout rather than an exact screenshot of the editor.
The key principle is to arrange information in the order that supports decision-making: summary values first, then the map and the visualizations that explain the patterns behind those values.
Esri’s dashboard layout documentation explains how to move, resize, stack, and group elements.
4. Step Three: Add the Map Element
The map provides geographic context and can supply operational layers for other dashboard elements.
Step 4.1: Add a map
From the dashboard editor, click Add element and choose Map.
Select the web map you created earlier:
Incident Monitoring Web Map
The map appears in the dashboard layout.
Step 4.2: Configure map settings
Open the map element’s configuration and review the available settings.
Depending on the map and configuration, options may include:
- Legend visibility.
- Scale bar visibility.
- Operational layer visibility controls.
- Basemap switching.
- Default extent and bookmarks.
- Pop-up behavior.
For the incident-monitoring example, enable the legend if users need help interpreting incident categories. Enable the scale bar when approximate geographic distances are important.
Avoid adding unnecessary map controls that distract from the primary monitoring task.
Step 4.3: Verify the map’s operational layer
Check that the incident layer is present in the selected web map and that its features display correctly.
This is particularly important because you will use the same hosted feature layer as the data source for the chart and summary indicators.
Using a common source helps make the dashboard easier to configure and supports compatible interactions between its elements.
Click Done to apply the configuration.
5. Step Four: Add an Indicator for Open Incidents
An indicator is a compact visual element that displays an individual numeric value or a calculated statistic. It is particularly useful for key performance indicators (KPIs).
In this example, the first indicator will show the total number of open incidents.
Step 5.1: Add the indicator
- Click Add element.
- Select Indicator.
- Choose the incident layer as the data source.
If you added the map first, its operational layer may be available as a convenient data source.
Step 5.2: Configure the data
In the indicator configuration, open the Data tab.
Choose the statistic used to calculate the indicator.
For a total incident count, use a count-based summary of the incident records. Then apply a data filter to include only records where:
Status is Open.
The exact filter controls depend on the layer fields and the available configuration options. Confirm that the filter is applied to the correct status field and that the count represents the records you intend to monitor.
If the layer contains multiple records per incident, a raw feature count may not equal the number of distinct incidents. In that situation, prepare a dataset or summary that appropriately represents the unique incidents before using the indicator.
Step 5.3: Customize the indicator appearance
Open the Indicator configuration tab.
Set the title to:
Open Incidents
Use the available top, middle, and bottom display areas to show the numeric value and optional explanatory text.
For example:
- Top:
CURRENT STATUS - Middle: the calculated value.
- Bottom:
Awaiting resolution
You can also configure icons, number formatting, and conditional formatting. For instance, a reference value can indicate a predefined target or threshold, with the indicator changing appearance when the current value moves above or below it.
Click Done.
The indicator now communicates an important operational measure at a glance. For this example, the number is a live summary of the current layer data, not a historical total unless the data and filtering logic are designed to measure historical values.
Esri’s Indicator element documentation provides details about reference values and formatting.
6. Step Five: Add a Gauge for Response Time
A gauge shows a single metric within a defined numerical context. Unlike a chart, which is useful for comparing categories or trends, a gauge is designed to communicate a current value relative to a range, target, or threshold.
For the incident-monitoring example, the gauge will show average response time.
Step 6.1: Add a gauge
- Click Add element.
- Select Gauge.
- Choose the incident hosted feature layer as the data source.
- Open the Data tab.
Select Response_Minutes as the numeric field and choose the Average statistic.
If the field contains text instead of numeric values, correct the source data or prepare a suitable numeric field before proceeding.
Step 6.2: Configure the gauge range
Open the Gauge tab and choose a gauge type.
ArcGIS Dashboards supports progress and meter gauges.
For an example response-time gauge, configure a meaningful range, such as:
- Minimum: 0 minutes.
- Maximum: 120 minutes.
These values are illustrative. Set the actual minimum, maximum, and thresholds using an operational target, policy, service-level agreement, or documented analytical assumption.
You can also configure threshold bands or guides to indicate different performance states.
For response time, for example, a lower value might represent better performance. Make sure your chosen colors and threshold labels communicate that interpretation correctly.
Step 6.3: Format the result
Give the gauge a clear title:
Average Response Time
Ensure that the displayed unit is minutes, not an unlabeled numeric value.
Click Done.
The gauge now provides a quick view of how the average response time compares with the chosen range. Note that a mean can hide extreme delays, so a distribution chart or maximum-response-time indicator may be useful in a more advanced dashboard.
See the ArcGIS Dashboards Gauge documentation.
7. Step Six: Add a Serial Chart for Incidents by District
A serial chart displays one or more data series across a horizontal and vertical axis. It can use columns to compare discrete categories or lines to show values over a continuous sequence, such as dates.
For this tutorial, the serial chart will compare the number of incidents across districts.
Step 7.1: Add a serial chart
- Click Add element.
- Select Serial chart.
- Choose the incident hosted feature layer as the data source.
- Open the Data tab.
Step 7.2: Configure the chart categories
Configure the chart to group incident records by the District field.
Set the statistic to count the incident records in each district.
For example, the chart may display:
| District | Incident count |
|---|---|
| Central | 145 |
| East | 98 |
| North | 121 |
| West | 76 |
These numbers are illustrative, not real operational data.
Use the chart’s data configuration to select the appropriate category and statistic options. The exact labels may vary with the category source and data type.
Step 7.3: Configure the series
Open the Series tab and choose a column chart to compare incident counts across districts.
Then configure the chart display:
- Chart title:
Incidents by District - Category axis:
District - Value axis:
Number of incidents - Labels: optional, depending on the number of categories
- Legend: include one if the chart’s series or colors require explanation
- Hover text: provide useful details where appropriate
If the purpose is to show changes over time, instead use a date-based category field and select a suitable line chart. Ensure the reported dates are stored and interpreted correctly.
Limit the number of categories shown at once. When many districts exist, a sorted chart or a selector can make the visualization easier to understand.
Click Done.
For more configuration guidance, see Serial chart in ArcGIS Dashboards.
8. Step Seven: Configure Actions Between the Chart and Map
An interactive dashboard becomes much more useful when its elements respond to user selections.
In this example, selecting a district in the serial chart will filter the map’s incident layer so that the map focuses on incidents from that district.
ArcGIS Dashboards supports actions such as filtering, zooming, panning, flashing features, and displaying pop-ups. The available actions depend on the source element, the target element, and how their data sources are configured.
Step 8.1: Check the chart’s data source
Before configuring actions, ensure that both the serial chart and the map use compatible references to the same hosted incident feature layer.
For this example, configure the serial chart using Categories from Grouped Values, with District as the category field and incident count as the statistic.
Serial charts configured using categories from fields do not support selection actions. Chart actions must use a supported category configuration.
Step 8.2: Open the Actions tab
- Hover over the serial chart.
- Click Configure.
- Open the Actions tab.
The Actions tab shows the interactions available for the chart and the dashboard elements that can act as targets.
Step 8.3: Enable the filter action
Expand the Filter section.
Select the map’s incident operational layer as the target, if it is offered by the editor. Enable the filter action and complete any available selection settings.
For this example, the intended interaction is:
Select Central → show Central incidents on the map
The selected district category should filter the compatible incident layer using the matching district value. Clicking another category should update the selection, and clearing the selection should restore the broader view according to the configured interaction.
For charts based on grouped values, ArcGIS Dashboards supports attribute-filter actions on compatible map operational layers and other elements that use the same data source. Review the available target list in your dashboard configuration. See Esri’s Configure actions for elements documentation.
Step 8.4: Configure supplementary map actions
If users would benefit from a geographic transition when choosing a district, configure a supported chart-to-map action such as zoom, pan, or flash where available.
A filter and a zoom action serve different purposes:
- Filter: Changes which features are included in the target layer’s display or data.
- Zoom or pan: Changes the map’s visible extent.
- Flash: Temporarily highlights the target location.
A map can be zoomed without filtering its features, so choose the action that matches the intended user experience.
Step 8.5: Test the interaction
Save your configuration and test the dashboard.
Select different district categories in the chart and verify that:
- The appropriate district’s incidents remain visible.
- Other dashboard elements update as intended if filter actions are configured.
- Clearing the selection restores the expected overall view.
- The selected values and chart categories match the fields in the hosted layer.
If the map’s operational layer is not offered as a filter target, check the source layer, chart category configuration, and target compatibility. Do not assume that every chart configuration exposes every action.
9. Step Eight: Arrange and Style the Dashboard
Once the core elements work, refine the layout so the dashboard communicates its message clearly.
Step 9.1: Arrange the elements
Use the dashboard editor’s layout controls to move and resize the elements.
A useful desktop structure is:
Top row: Open incidents, average response time, and another important KPI.
Main section: The interactive map beside the incidents-by-district chart.
The map should receive enough space to display the geographic distribution clearly. The chart should be wide enough to show the district labels and values without unnecessary truncation.
Step 9.2: Customize the dashboard header
If a header is enabled, use it for the dashboard title, a short explanation, and a relevant logo or icon if appropriate.
For example:
Incident Monitoring Dashboard
Explore incident locations, operational status, and response performance by district.
Avoid turning the header into a long report. Detailed explanations are better placed in documentation or supporting content.
Step 9.3: Use consistent visual styles
Choose a small set of colors and apply them consistently across the map, charts, and indicators.
For example, use red for high-priority incidents and a matching color to indicate urgent conditions in the KPI section.
Use descriptive titles and captions, format large numbers with appropriate separators, and show units for time, distance, or other measurements.
Avoid using multiple gauges or charts to repeat the same information. Each element should answer a distinct question.
10. Step Nine: Configure a Mobile View
A desktop dashboard and a mobile dashboard have different layout requirements. ArcGIS Dashboards supports an optional mobile view that can be configured separately from the desktop view.
Step 10.1: Open the mobile view
Use the dashboard editor’s view controls to create or switch to the mobile view.
You can use selected elements from the desktop configuration or add new elements specifically for mobile users.
Note that copying elements to the mobile view does not automatically copy all actions. Review the action configuration after adding copied elements.
Step 10.2: Simplify the mobile layout
For this incident dashboard, a useful mobile arrangement could include:
- Open incidents indicator.
- Average response time gauge.
- One map showing incident locations.
- A simplified district chart or selector.
Stack elements into tabs when appropriate to avoid a long and crowded page.
Step 10.3: Test the mobile interactions
Check that titles, labels, and numbers are readable on small screens.
For touch-based use, avoid relying on hover text or interactions that require selecting densely clustered points. A simpler map and fewer charts often provide a better mobile experience.
Esri provides further recommendations in its Dashboard mobile views documentation.
11. Step Ten: Save, Share, and Publish the Dashboard
After configuring and testing the elements, save the dashboard and configure access for the intended audience.
Step 10.1: Save your work
Use the Save control in the dashboard editor to save your latest configuration.
Give the item an appropriate title, summary, and tags so that team members can identify it easily.
Step 10.2: Set the sharing permissions
In ArcGIS Online, open the dashboard item and use its sharing controls.
Choose the audience that should be able to access it, such as:
- Only you.
- Your organization.
- Specific groups.
- Everyone, if public access is appropriate.
The dashboard’s sharing settings must be consistent with the access permissions of the web map and its source data. Sharing a dashboard alone does not guarantee that viewers can access restricted layers referenced by it.
For public dashboards, review the source data and pop-ups carefully to avoid exposing confidential information or exact locations that should remain restricted.
Step 10.3: Test as a viewer
Open the dashboard as an intended viewer rather than relying only on the authoring experience.
Confirm that:
- The map and all data-driven elements load.
- Values match the current source data.
- Pop-ups display the intended fields.
- Chart selections and other actions work.
- No required layer is inaccessible because of sharing settings.
- The desktop and mobile views behave as expected.
This final test helps catch issues that may not be apparent during configuration.
12. Real-Time Spatial Tracking: What to Expect
ArcGIS Dashboards can support operational monitoring and near-real-time spatial tracking, but creating a dashboard does not by itself collect live locations or continuously update the underlying data.
To monitor changing locations or statuses, the connected data source must receive updates through an appropriate collection, integration, or data-refresh workflow. The dashboard’s data and refresh settings must then be configured to reflect those changes.
For example, a fleet-monitoring system may send vehicle positions to a feature layer, while a field inspection workflow may update an inspection record after each submission.
For operational dashboards, document the data-update frequency and distinguish current positions from stale or delayed observations. A dashboard showing the latest available record is not necessarily showing a live location.
13. Summary and Best Practices for Dashboard UX Design
Creating an interactive web dashboard with ArcGIS Dashboards involves preparing a hosted feature layer, creating a web map, adding dashboard elements, linking their actions, and configuring sharing and layout settings.
The workflow can be summarized as follows:
- Publish or identify a hosted feature layer.
- Configure and save a web map in ArcGIS Online.
- Create a dashboard and add the Map element.
- Add an Indicator for open incidents.
- Add a Gauge for average response time.
- Add a Serial chart to compare incidents by district.
- Configure supported actions to connect chart selections with map filtering.
- Refine the layout and configure a mobile view.
- Save the dashboard and share the required items with the intended audience.
- Test the dashboard using viewer-level access.
The most important UX principles are to start with the user’s decision-making needs, prioritize a small number of meaningful metrics, keep the map legible, use consistent visual encoding, and test every interaction.
A well-designed dashboard does more than display spatial information. It helps users understand where activity is occurring, recognize patterns, and move from an overview to a focused operational decision.