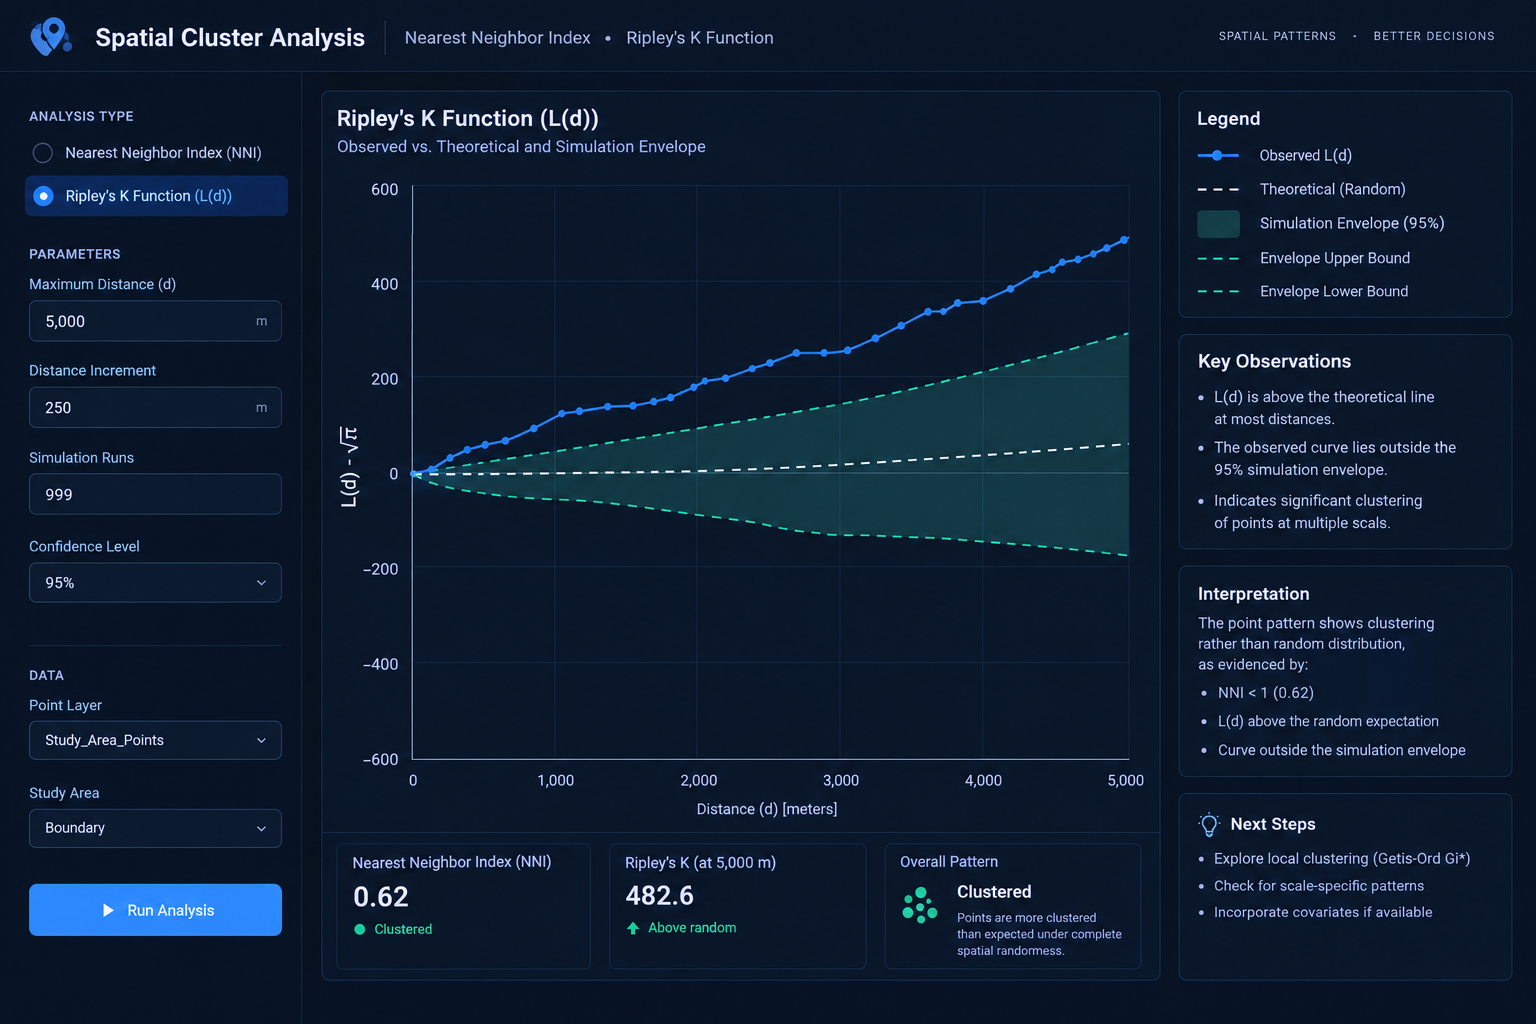
Point Pattern Analysis: Nearest Neighbor Index NNI vs Ripley’s K Function

Nearest Neighbor Index vs Ripley's K Function L(d) curve and simulation envelope analysis.

Point Pattern Analysis: Nearest Neighbor Index NNI vs Ripley’s K Function   1. Introduction: Understanding Point Pattern Analysis in GIS When studying spatial point distributions, comparing tools like the Nearest Neighbor Index vs Ripley’s K Function is critical for understanding whether your data is clustered or dispersed. Imagine mapping 500 crime incidents across a city. … Read more
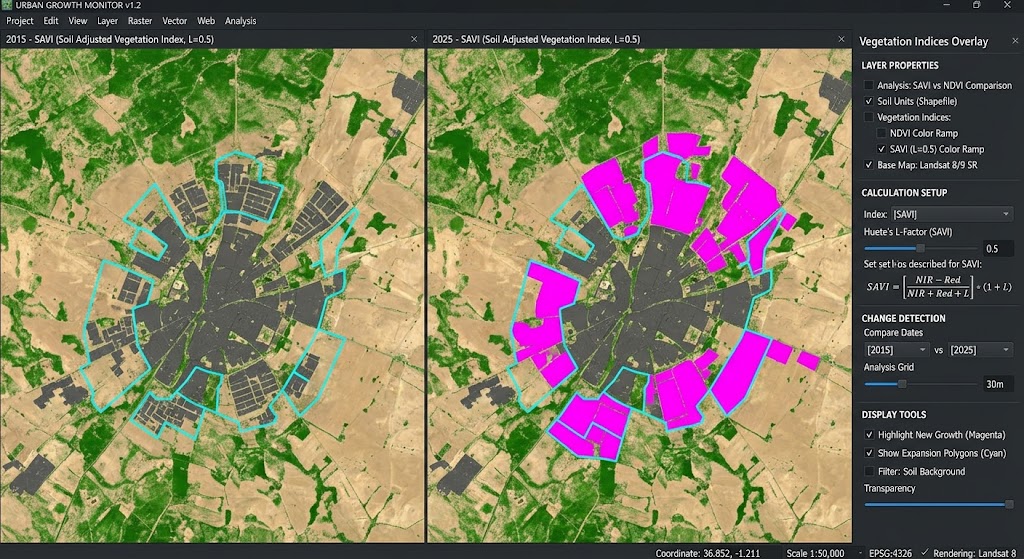
Calculating Built-Up Index (NDBI) in QGIS for Urban Expansion Analysis

Calculating Built-Up Index in QGIS change detection map showing urban expansion analysis.

Calculating Built-Up Index (NDBI) in QGIS for Urban Expansion Analysis   1. Introduction: What Is the Normalized Difference Built-Up Index? Calculating Built-Up Index in QGIS is an essential remote sensing technique for monitoring urban expansion and impervious surfaces over time. Rapid urbanization transforms natural landscapes into buildings, roads, parking areas, and other impervious surfaces. Monitoring … Read more

Soil Adjusted Vegetation Index SAVI vs NDVI GIS

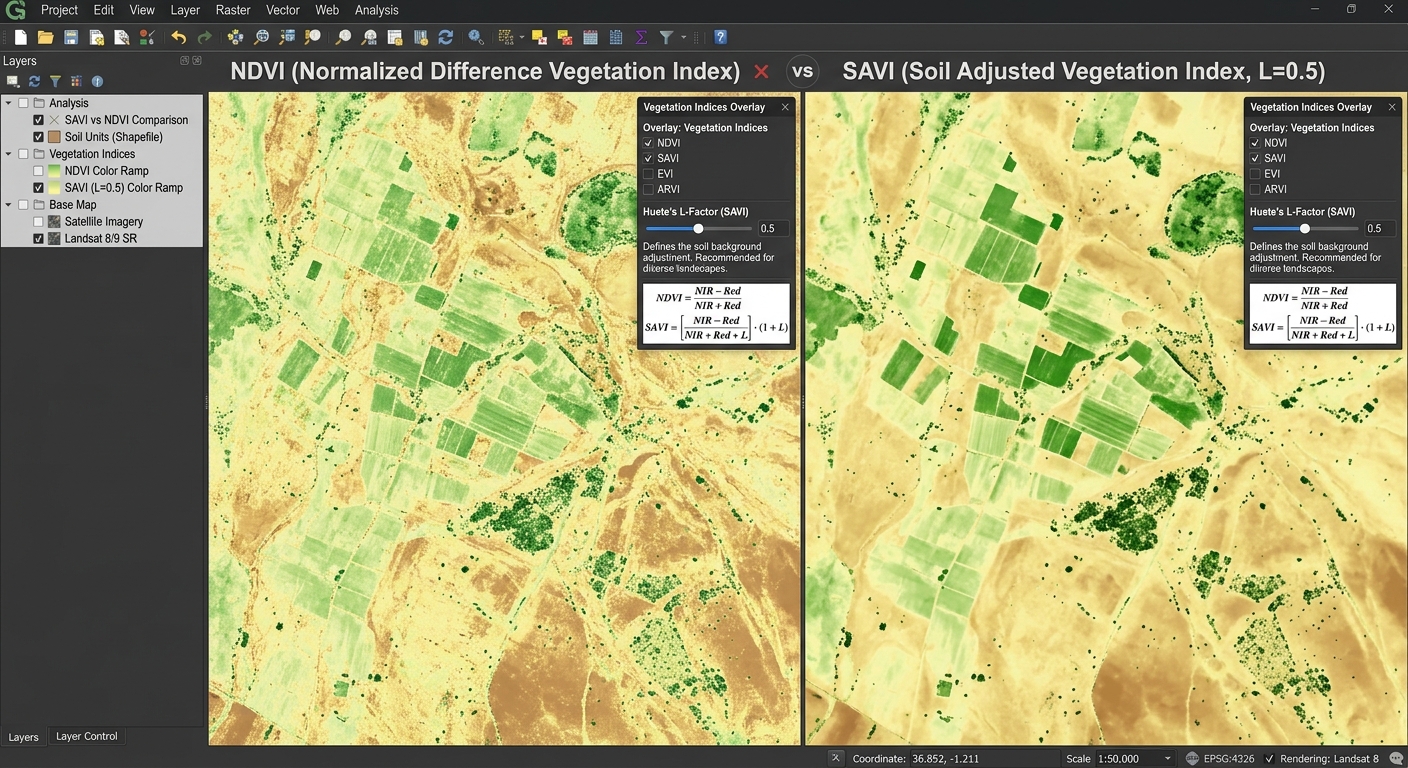
SAVI vs NDVI

Soil Adjusted Vegetation Index SAVI vs NDVI GIS   1. Introduction: Why Compare SAVI and NDVI? Vegetation indices are among the most widely used tools in agricultural remote sensing. They help researchers monitor crop growth, assess vegetation conditions, map rangelands, and investigate land degradation using satellite imagery. The Normalized Difference Vegetation Index (NDVI) is a … Read more

Principal Component Analysis (PCA) on Multi-Spectral Satellite Bands for Dimensionality Reduction

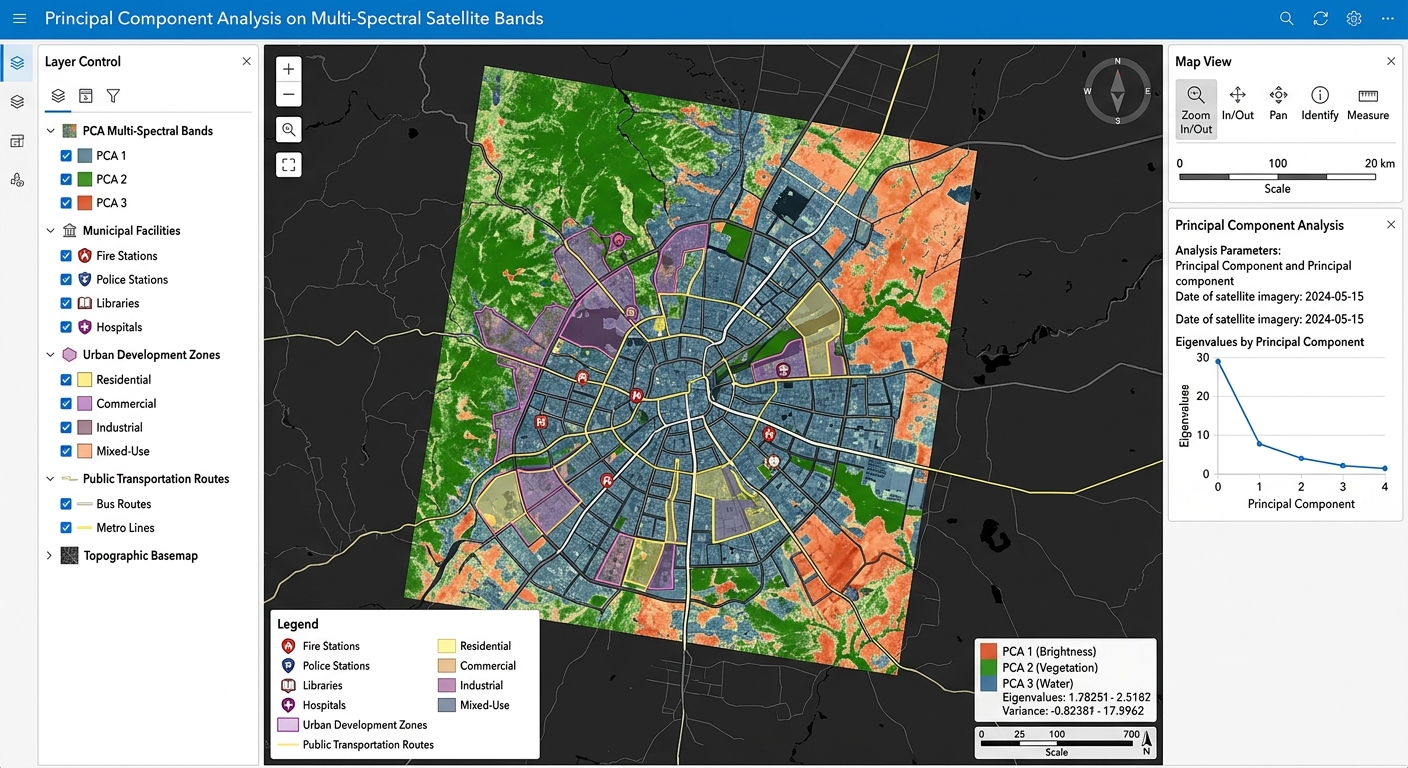
Principal Component Analysis on Multi-Spectral Satellite Bands GIS software canvas showing multi-criteria overlay layers.

Principal Component Analysis (PCA) on Multi-Spectral Satellite Bands for Dimensionality Reduction   1. Introduction: Why Apply PCA to Satellite Imagery? Applying Principal Component Analysis on Multi-Spectral Satellite Bands is a vital technique for reducing dimensionality in remote sensing workflows. Modern Earth observation satellites capture information about the same landscape across multiple spectral bands. Landsat and … Read more

Spatial Indexing Demystified: R-Trees and B-Trees in PostGIS

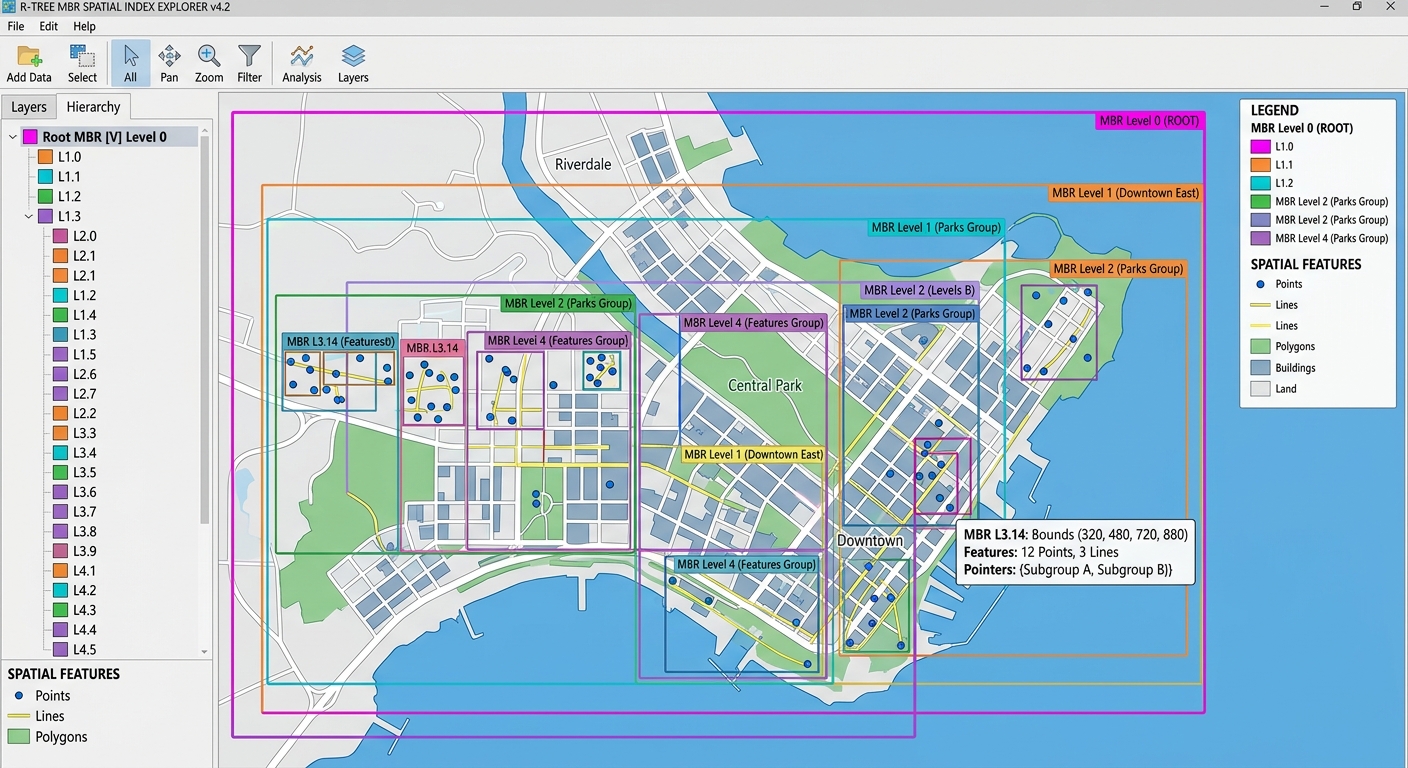
Spatial Indexing in PostGIS R-Tree bounding box hierarchy illustrating spatial candidate filtering.

Spatial Indexing Demystified: R-Trees and B-Trees in PostGIS   1. Introduction: Why Spatial Indexing Matters Understanding Spatial Indexing in PostGIS is critical when managing large geospatial datasets like millions of buildings and road networks. Imagine managing a PostGIS database containing five million buildings, road segments, land parcels, and utility networks. A city planner asks a … Read more

Raster Data in PostGIS: Storing, Querying, and Processing Raster Files with PostGIS Rasters

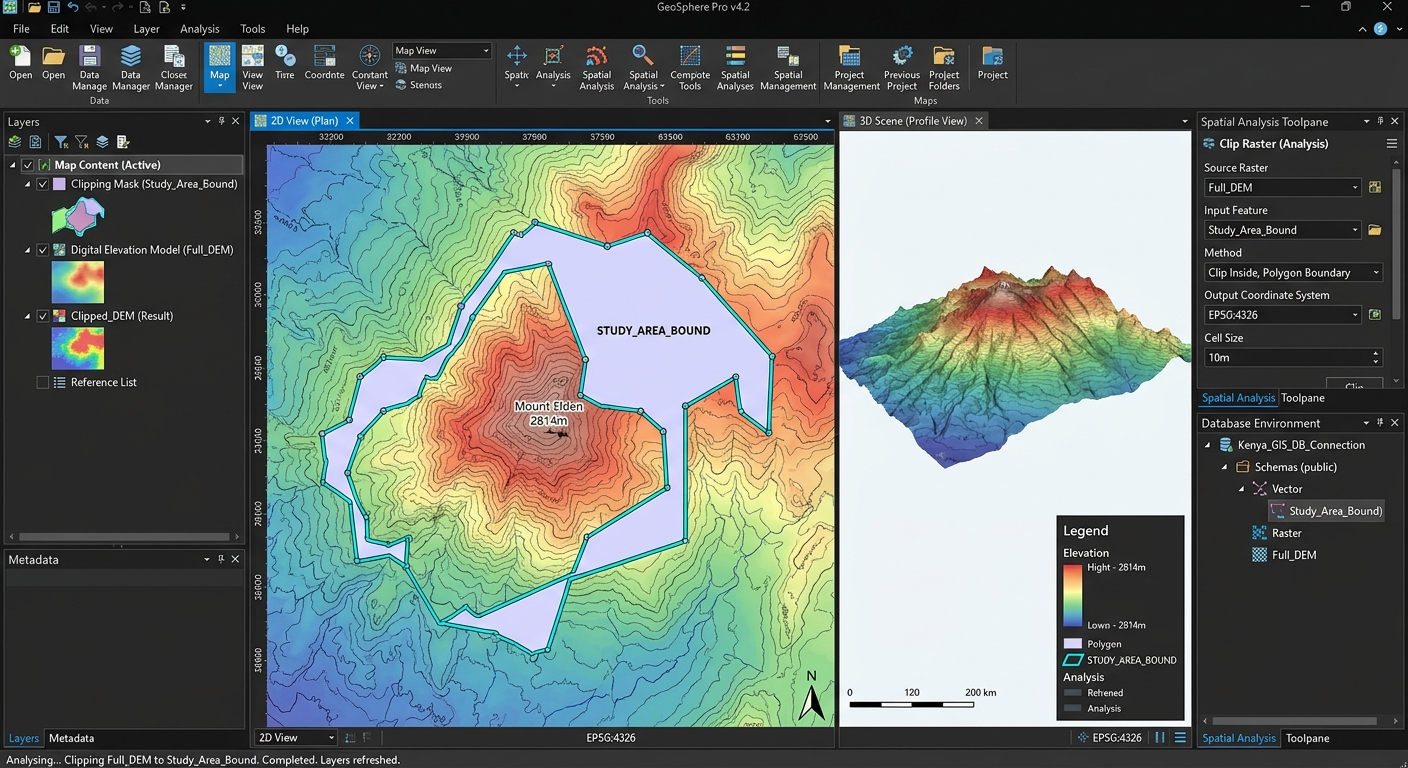
Raster Data in PostGIS spatial query example showing a raster dataset clipped to administrative vector boundaries using SQL.

Raster Data in PostGIS: Storing, Querying, and Processing Raster Files with PostGIS Rasters   1. Introduction: Moving Beyond Flat-File Raster Storage Raster data is fundamental to geospatial analysis. Digital elevation models (DEMs), satellite imagery, land-cover classifications, rainfall surfaces, and temperature grids are typically stored as raster files such as GeoTIFFs (.tif). In a traditional GIS … Read more

Building Multi-User Spatial Databases: Managing User Roles & Permissions in PostgreSQL

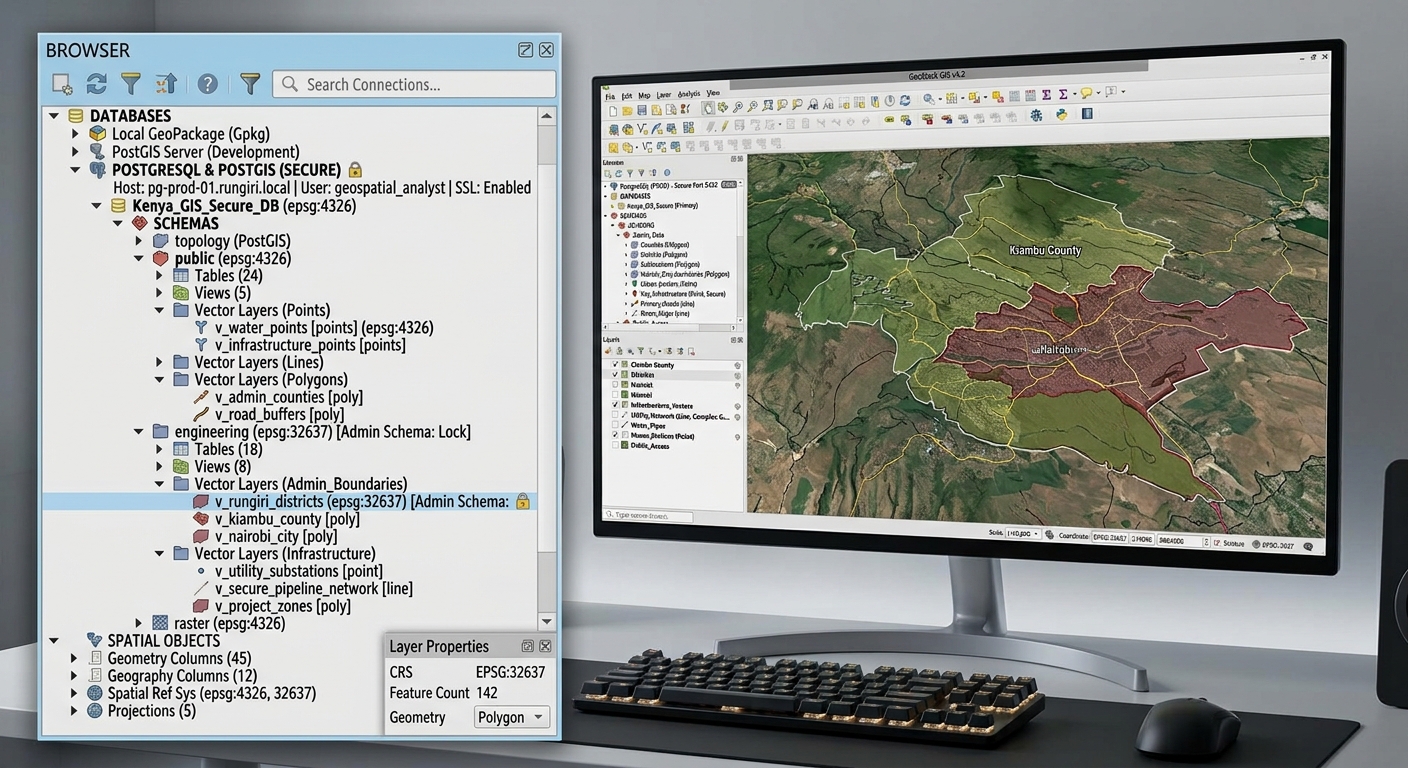
Multi-User Spatial Databases in PostgreSQL connection setup and layer browsing interface in QGIS.

Building Multi-User Spatial Databases: Managing User Roles & Permissions in PostgreSQL   1. Introduction: Managing a Shared Spatial Database Building Multi-User Spatial Databases in PostgreSQL is essential for organizations sharing geospatial datasets securely across teams. Imagine a county government maintaining a central spatial database containing land parcels, roads, water pipelines, building footprints, and zoning boundaries. … Read more

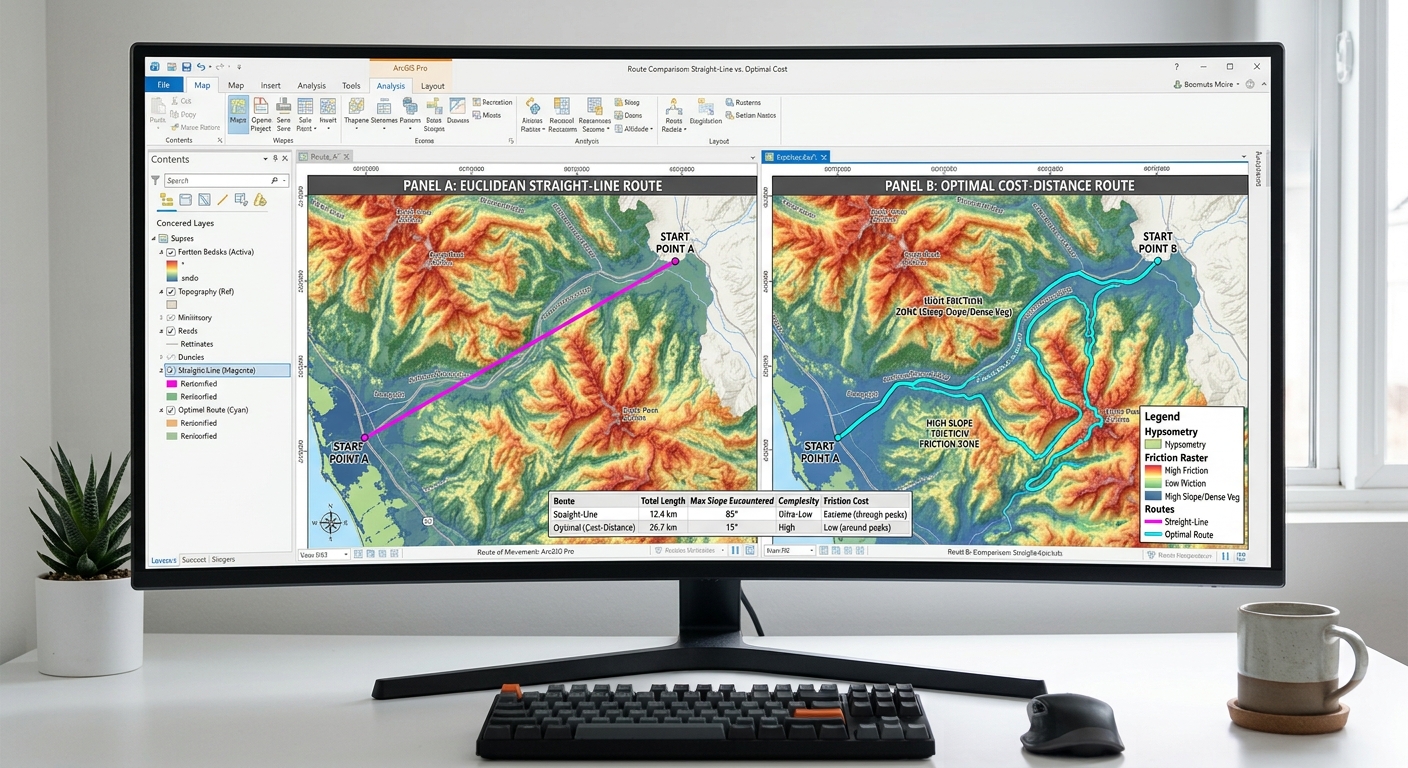
Cost-Distance & Least-Cost Path Analysis in ArcGIS Pro & QGIS

Least-Cost Path Analysis friction surface raster example showing weighted slope and land cover cost inputs.

Cost-Distance & Least-Cost Path Analysis in ArcGIS Pro & QGIS 1. Introduction: What Is Least-Cost Path Analysis? Imagine a transportation agency planning a new road between two towns. The shortest route on a map might cross steep mountains, wetlands, protected habitats, or densely developed neighborhoods. Although geographically short, that route could be expensive to construct … Read more

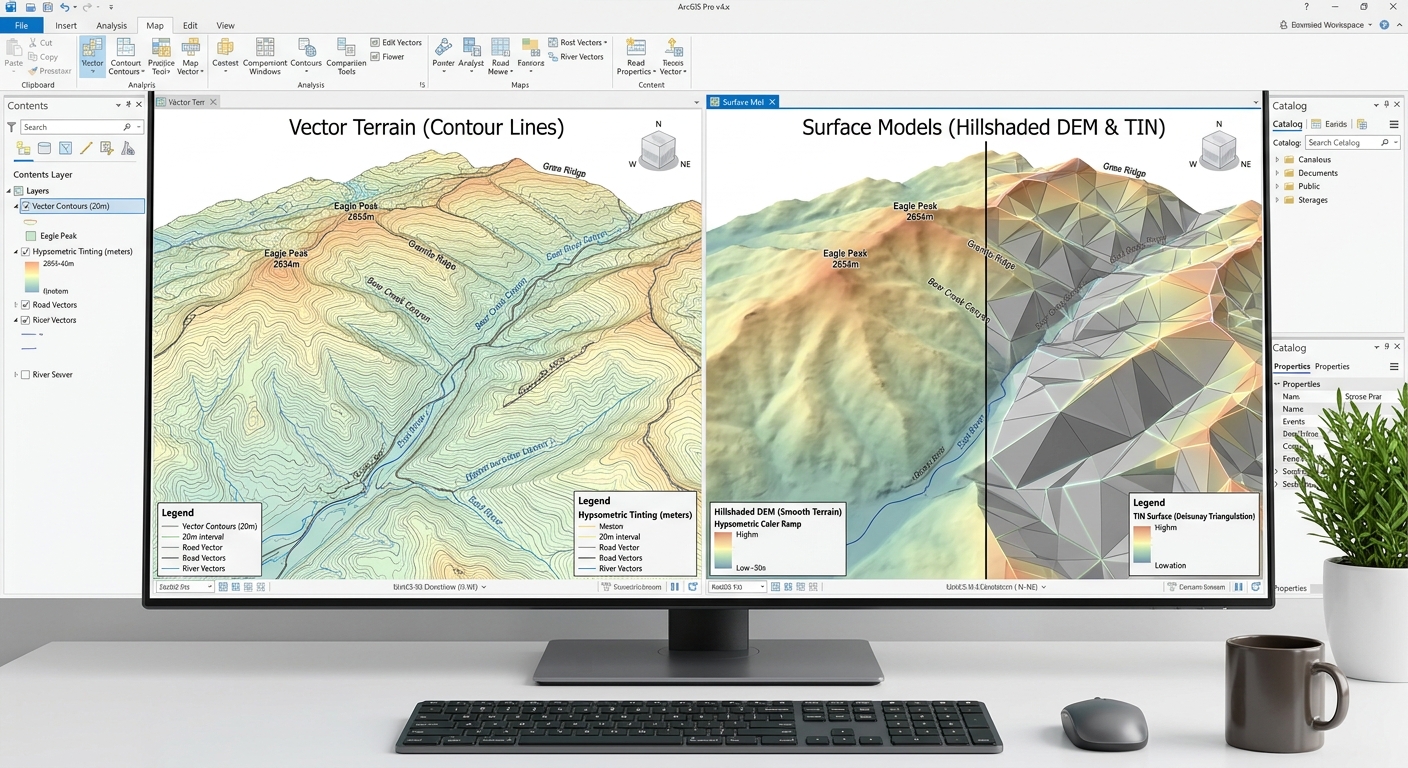
How to Convert Elevation Contour Lines into a DEM/TIN in QGIS & ArcGIS Pro

Side-by-side comparison of spatial models when you Convert Elevation Contour Lines into a DEM TIN in ArcGIS Pro.

How to Convert Elevation Contour Lines into a DEM/TIN in QGIS & ArcGIS Pro Introduction: Why Convert Contour Lines into a Terrain Surface? Convert Elevation Contour Lines into a DEM TIN efficiently using this complete workflow for topographic vector features in GIS. They are commonly found on topographic maps and are used to represent landforms … Read more

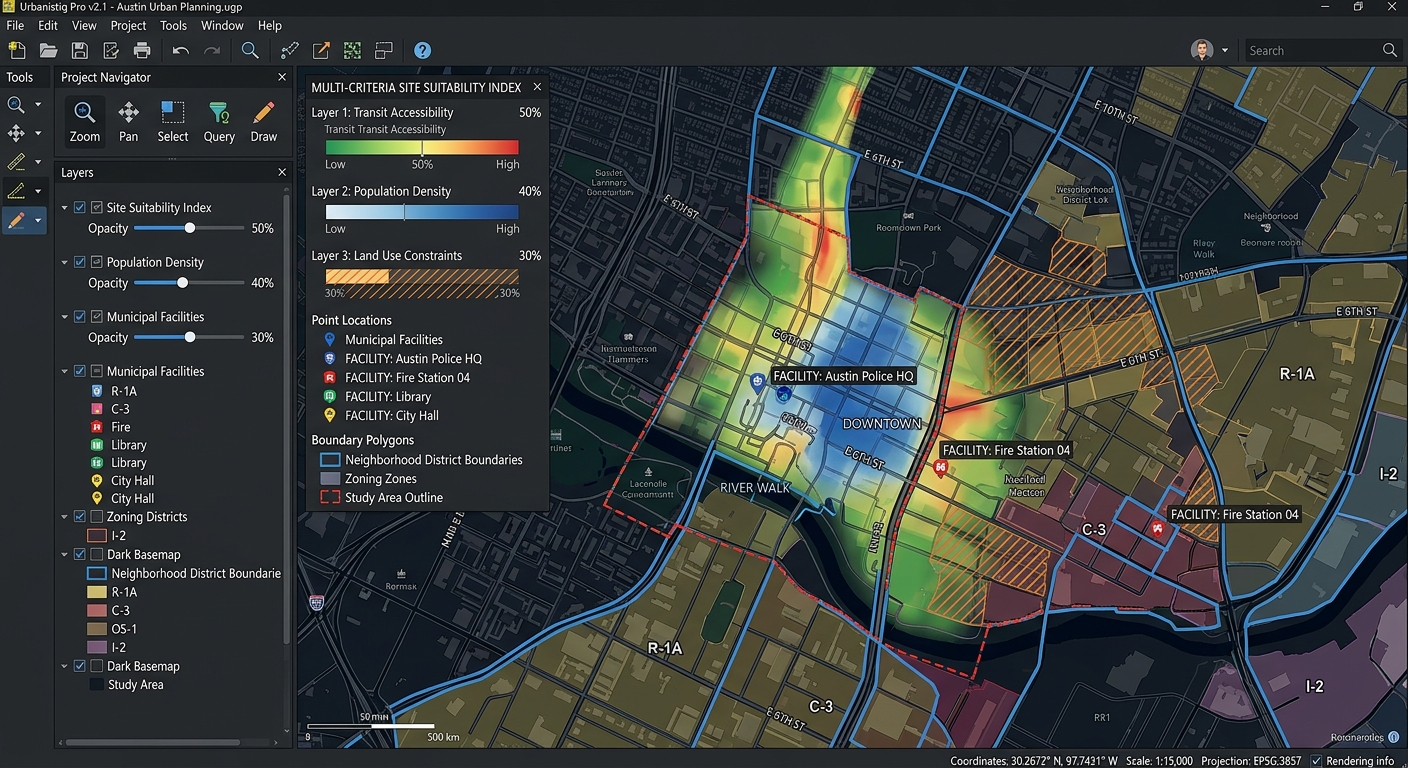
How to Write a GIS Methodology Section for Your University Dissertation or Thesis

Interface view of a GIS software canvas showing multi-criteria spatial overlay analysis layers.

How to Write a GIS Methodology Section for Your University Dissertation or Thesis Introduction: Why Your GIS Methodology Matters How to Write a GIS Methodology Section for Your University Dissertation or Thesis involves much more than being judged solely by the quality of your maps or the sophistication of your spatial analysis. Examiners also need … Read more