Top 5 Freelance GIS Platforms & How to Win Your First Mapping Contract

Top 5 Freelance GIS Platforms & How to Win Your First Mapping Contract
Top 5 Freelance GIS Platforms & How to Win Your First Mapping Contract Top 5 Freelance GIS Platforms & How to Win Your First Mapping Contract is essential when transitioning from a GIS student or recent graduate into a paid professional.. However, geospatial expertise is in high demand globally. Businesses, researchers, real estate developers, and … Read more
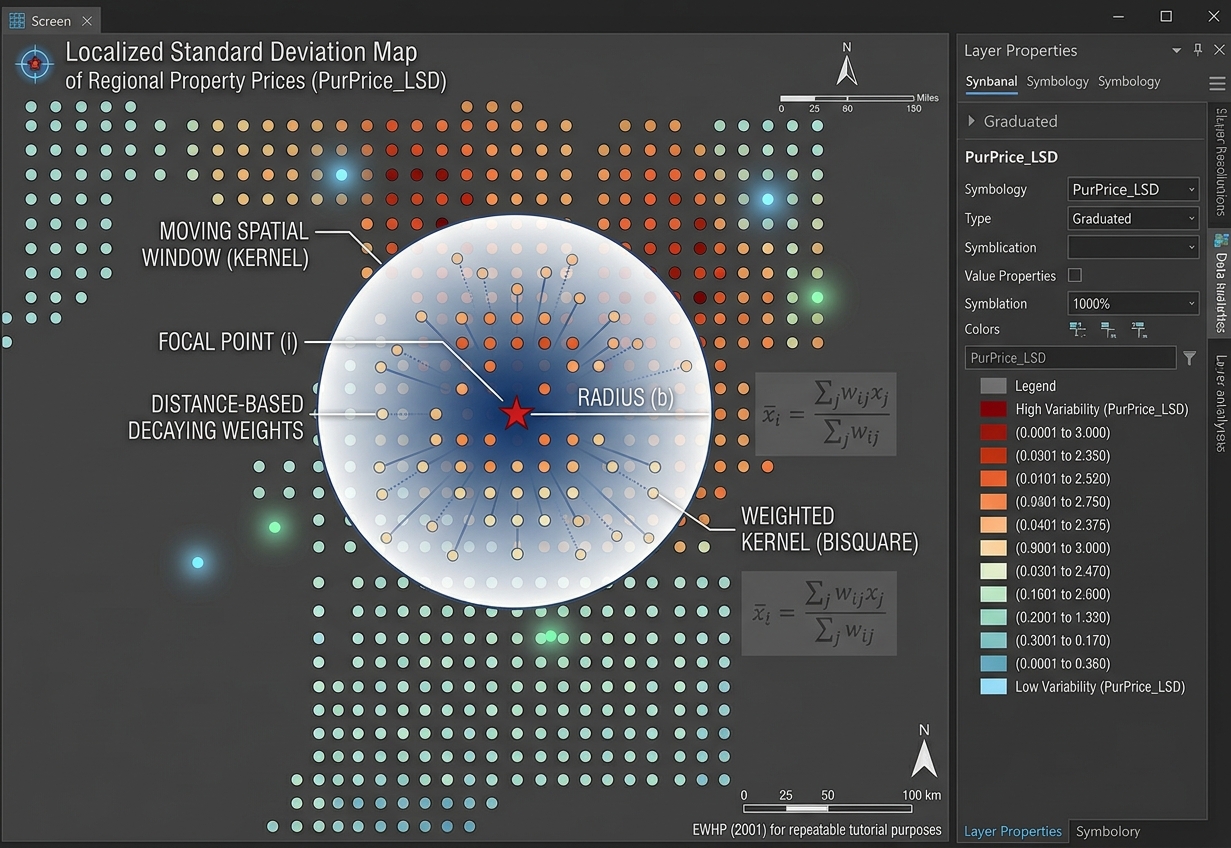
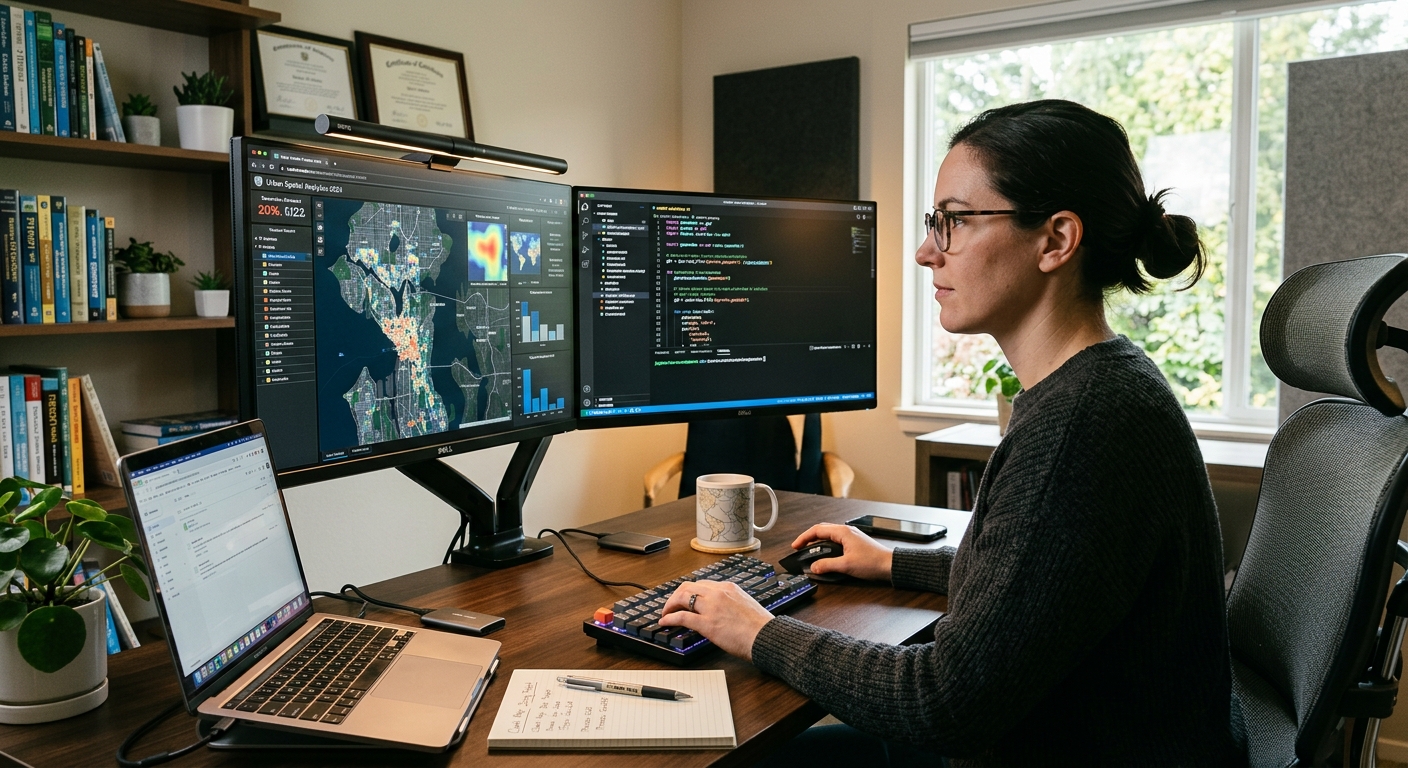
Geographically Weighted Summary Statistics (GWSS) in GIS: Beyond Global Means

GIS map output demonstrating Geographically Weighted Summary Statistics and local standard deviation patterns.

Geographically Weighted Summary Statistics (GWSS) in GIS: Beyond Global Means   1. Introduction: Why Global Summary Statistics Are Not Enough Imagine analyzing household income across an entire city. You calculate an average monthly income of KSh 35,000 and a standard deviation of KSh 15,000. These figures summarize the dataset, but do they tell you which … Read more

Spatial Lag vs. Spatial Error Models: Choosing the Right Spatial Econometric Model

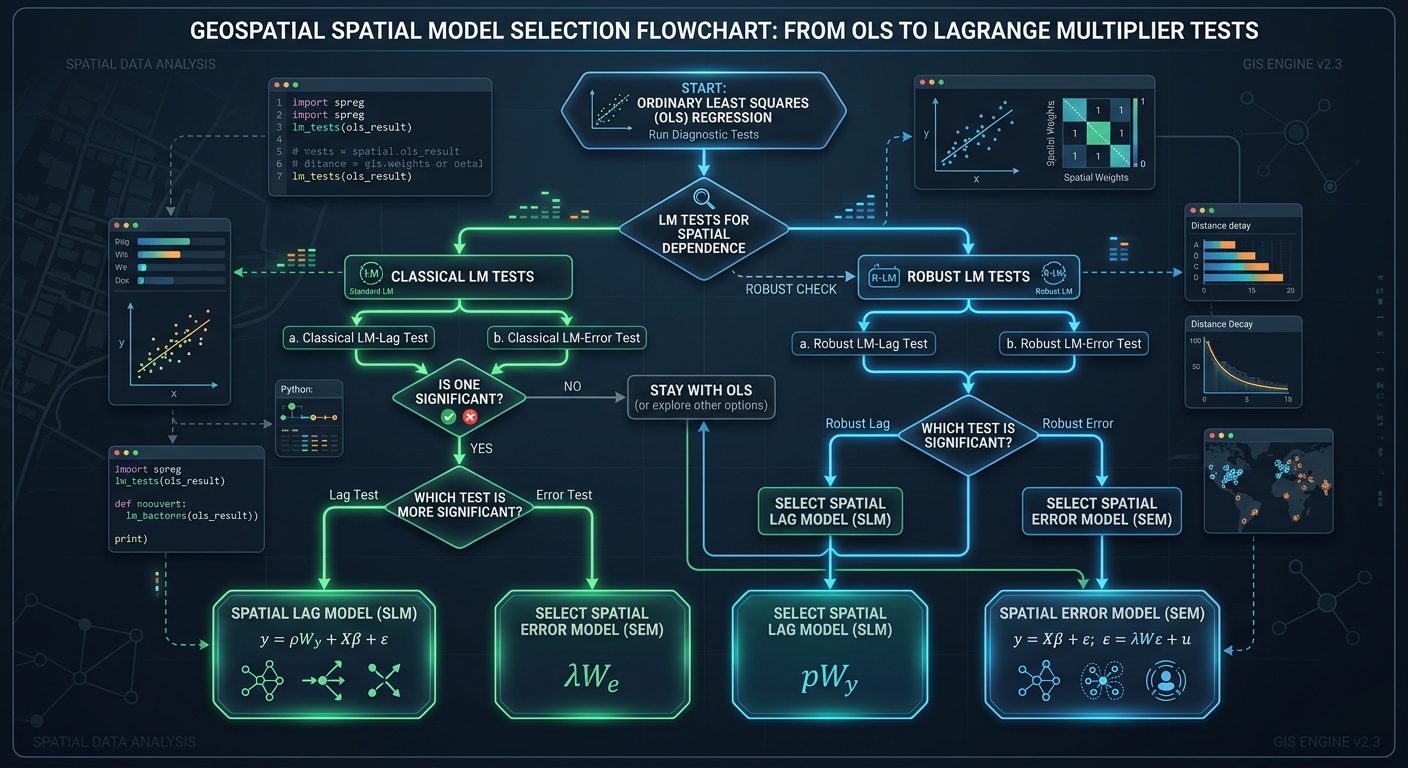
Lagrange Multiplier test workflow and decision guidelines for choosing between Spatial Lag vs Spatial Error Models.

Spatial Lag vs. Spatial Error Models: Choosing the Right Spatial Econometric Model   1. Introduction: Why Standard OLS Regression Can Fail in Spatial Analysis Imagine a researcher studying why property prices differ across neighborhoods. The researcher collects data on house prices, household income, distance to the city center, and access to public transportation. Using Ordinary … Read more

How to Calculate Spatial Distance Matrices with Python SciPy and Shapely

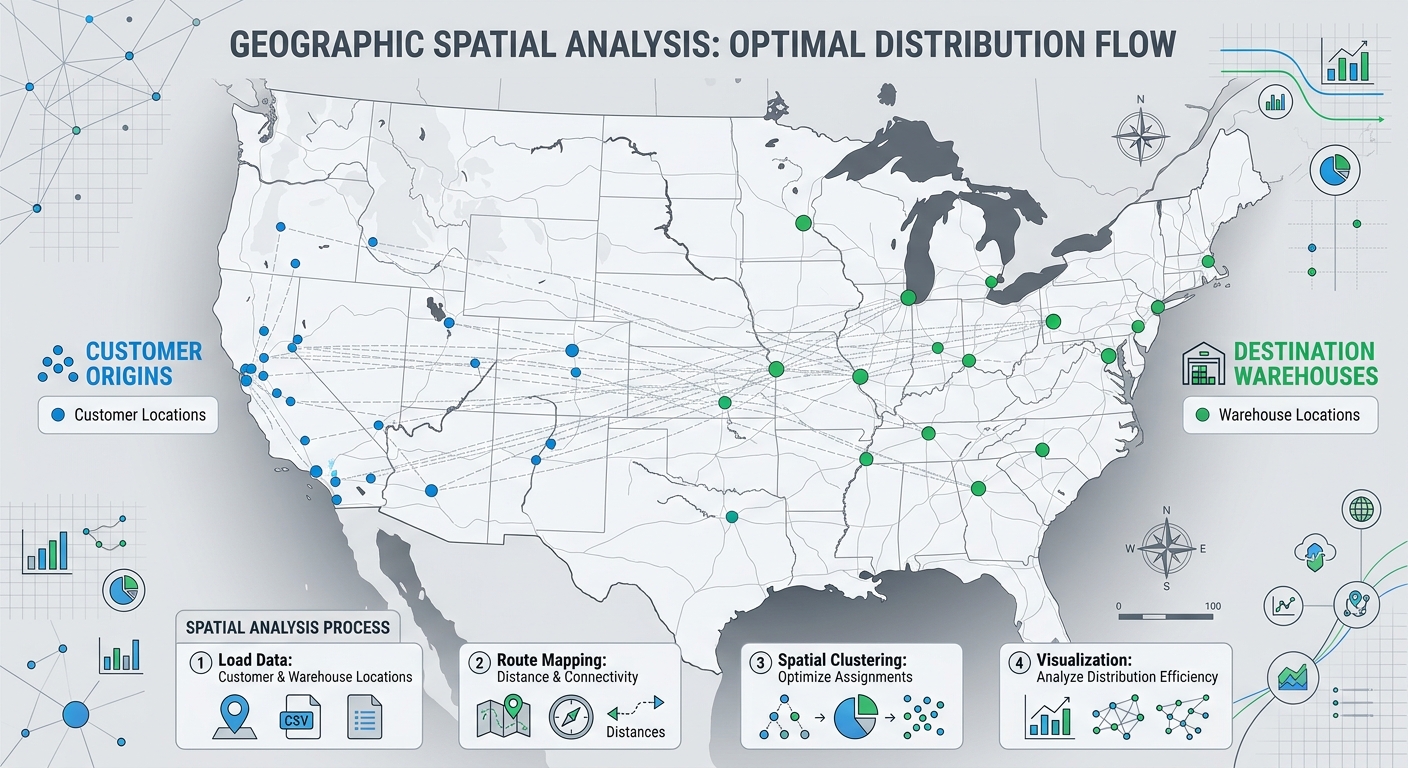
Workflow diagram illustrating how to calculate spatial distance matrices between customer origins and facility destinations using Python SciPy and Shapely.

How to Calculate Spatial Distance Matrices with Python SciPy and Shapely How to Calculate Spatial Distance Matrices with Python SciPy and Shapely is essential for mastering spatial distance calculations in GIS workflows. Whether you are determining which hospital is closest to a patient, matching warehouses to customers, or analyzing the nearest neighboring features, calculating distances between … Read more

Mapping Groundwater Potential Zones Using Analytical Hierarchy Process (AHP) in GIS GIS Research Guide · Hydrogeology · Multi-Criteria Decision Analysis · QGIS & ArcGIS Pro Introduction Groundwater is a critical source of freshwater for domestic consumption, agriculture, and industrial development. However, identifying productive groundwater zones is challenging because groundwater occurrence depends on several interacting factors, … Read more

Visibility Analysis & Viewshed Modeling: Determining Line-of-Sight in GIS

Visibility Analysis & Viewshed Modeling: Determining Line-of-Sight in GIS GIS Tutorial · Spatial Analysis · Environmental Planning · QGIS & ArcGIS Pro Introduction Viewshed analysis is a GIS technique used to determine which locations on a landscape are visible from one or more observation points. It evaluates the terrain between an observer and surrounding locations … Read more

Point Pattern Analysis: Nearest Neighbor Index NNI vs Ripley’s K Function

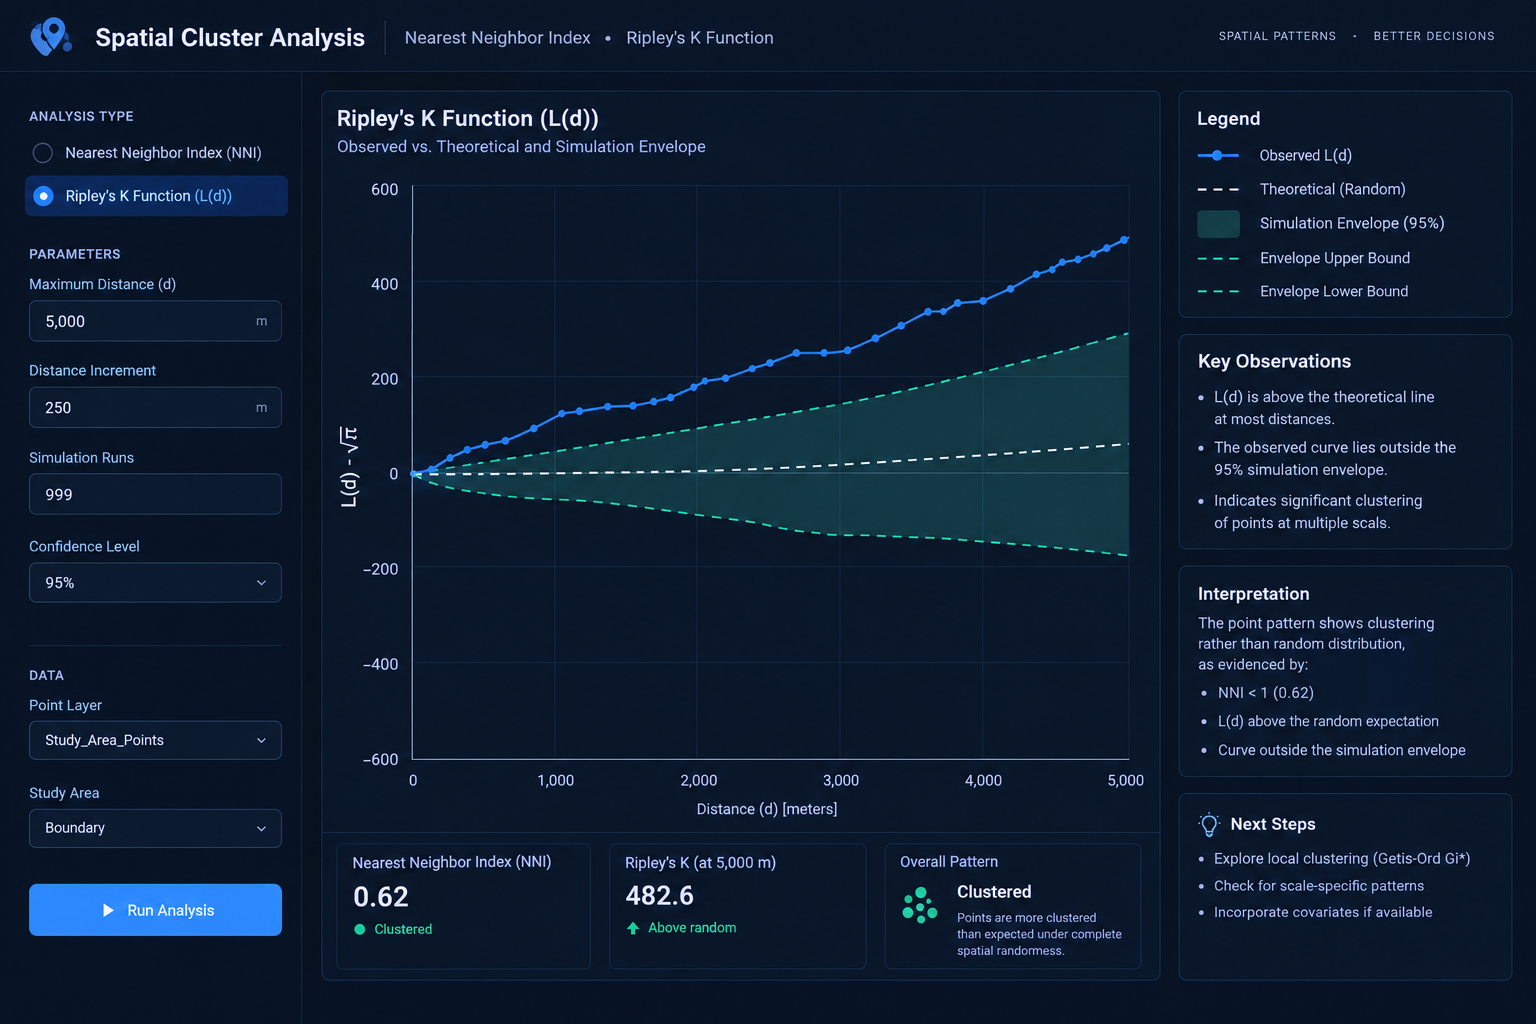
Nearest Neighbor Index vs Ripley's K Function L(d) curve and simulation envelope analysis.

Point Pattern Analysis: Nearest Neighbor Index NNI vs Ripley’s K Function   1. Introduction: Understanding Point Pattern Analysis in GIS When studying spatial point distributions, comparing tools like the Nearest Neighbor Index vs Ripley’s K Function is critical for understanding whether your data is clustered or dispersed. Imagine mapping 500 crime incidents across a city. … Read more

Calculating Built-Up Index (NDBI) in QGIS for Urban Expansion Analysis

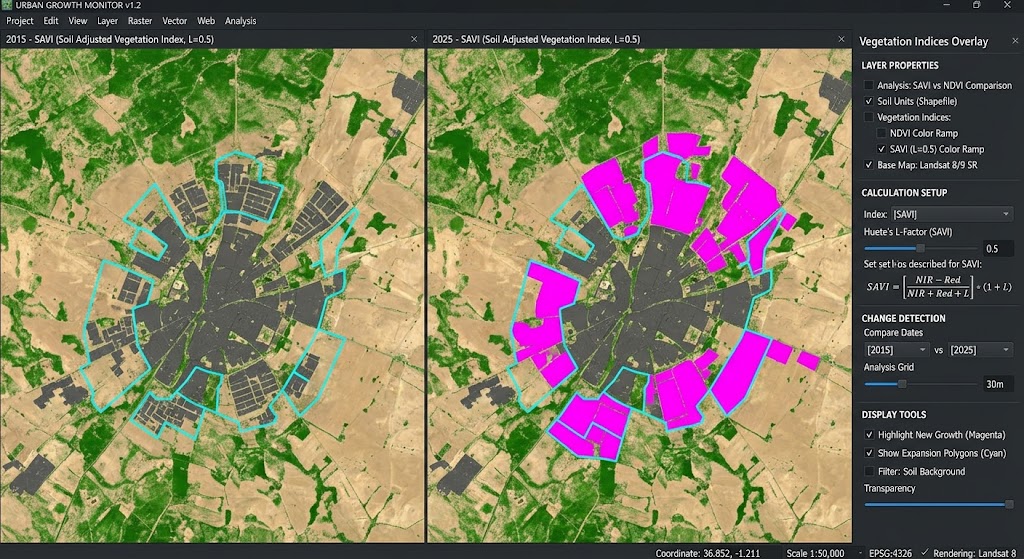
Calculating Built-Up Index in QGIS change detection map showing urban expansion analysis.

Calculating Built-Up Index (NDBI) in QGIS for Urban Expansion Analysis   1. Introduction: What Is the Normalized Difference Built-Up Index? Calculating Built-Up Index in QGIS is an essential remote sensing technique for monitoring urban expansion and impervious surfaces over time. Rapid urbanization transforms natural landscapes into buildings, roads, parking areas, and other impervious surfaces. Monitoring … Read more

Soil Adjusted Vegetation Index SAVI vs NDVI GIS

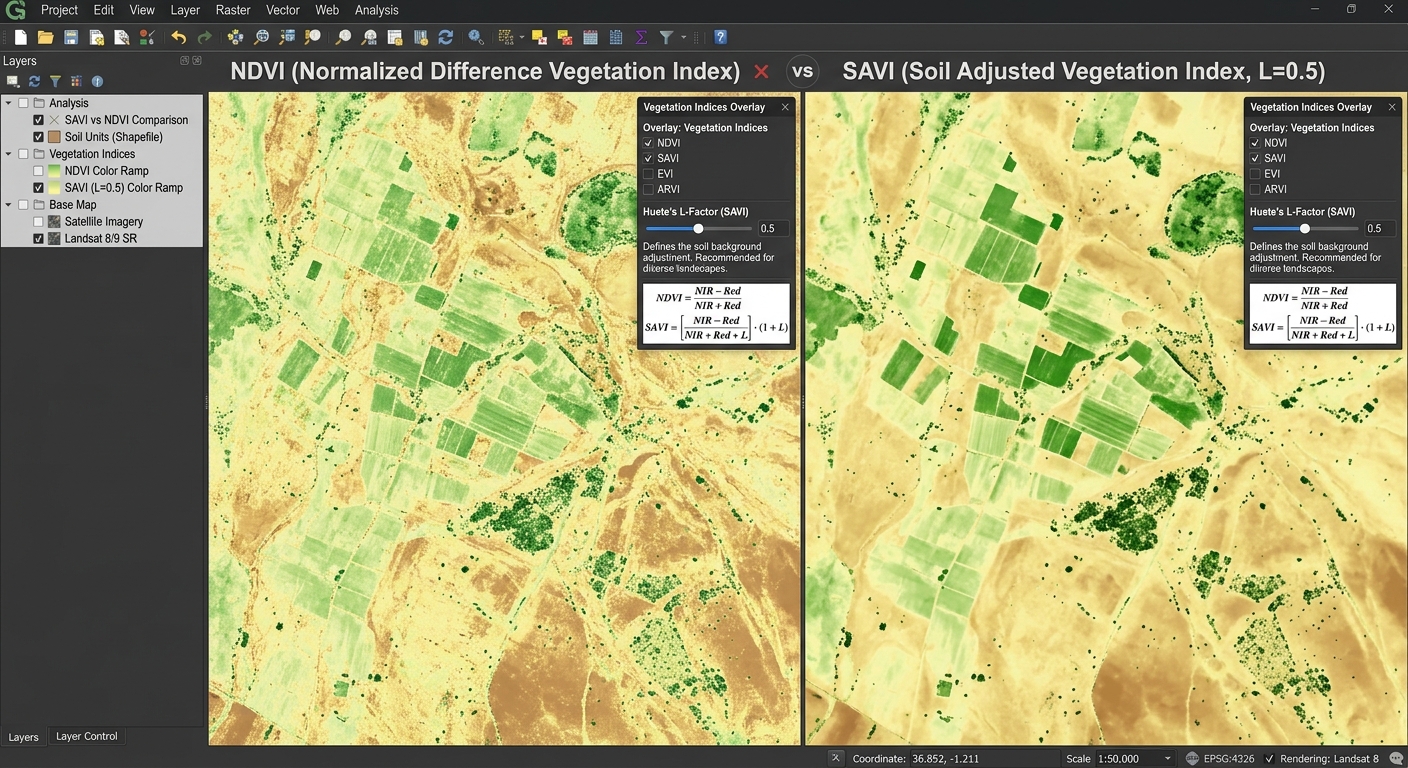
SAVI vs NDVI

Soil Adjusted Vegetation Index SAVI vs NDVI GIS   1. Introduction: Why Compare SAVI and NDVI? Vegetation indices are among the most widely used tools in agricultural remote sensing. They help researchers monitor crop growth, assess vegetation conditions, map rangelands, and investigate land degradation using satellite imagery. The Normalized Difference Vegetation Index (NDVI) is a … Read more

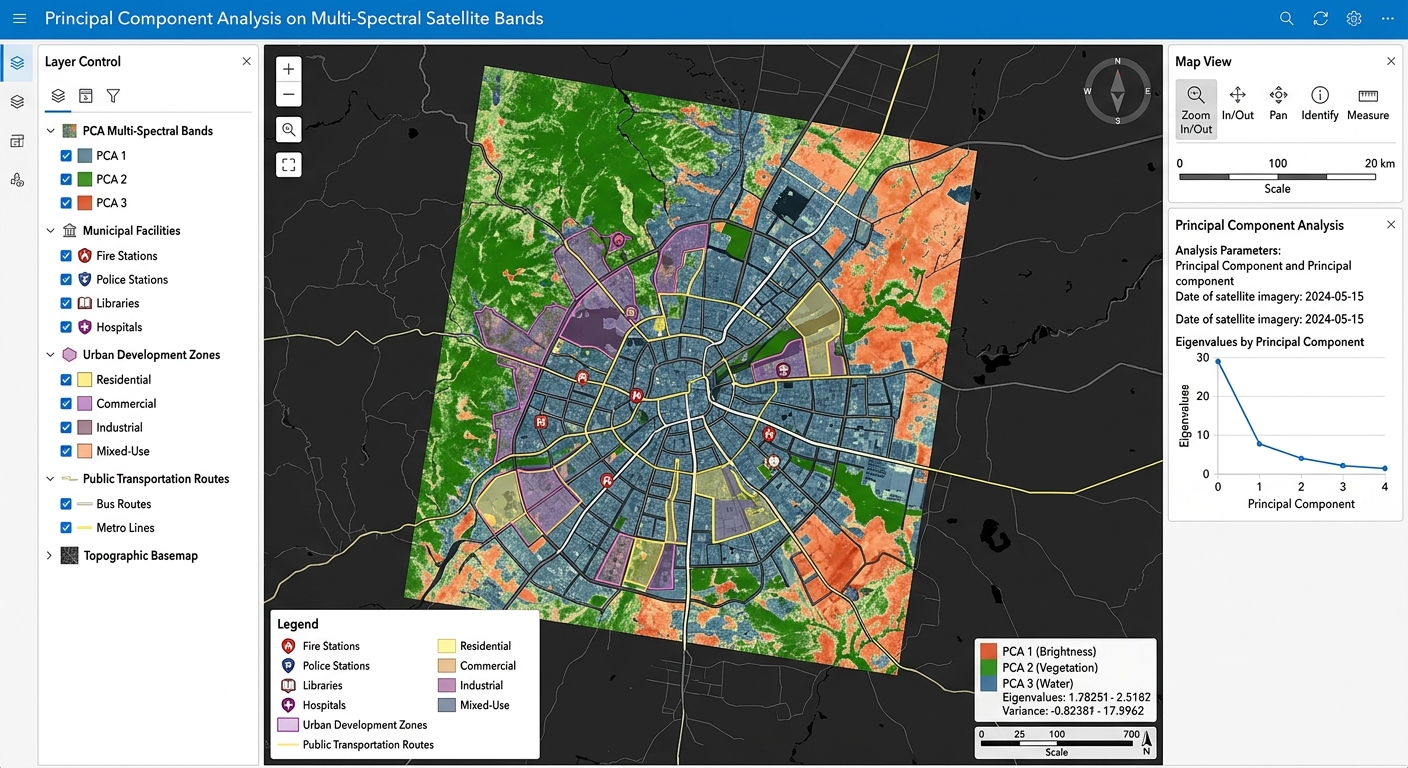
Principal Component Analysis (PCA) on Multi-Spectral Satellite Bands for Dimensionality Reduction

Principal Component Analysis on Multi-Spectral Satellite Bands GIS software canvas showing multi-criteria overlay layers.

Principal Component Analysis (PCA) on Multi-Spectral Satellite Bands for Dimensionality Reduction   1. Introduction: Why Apply PCA to Satellite Imagery? Applying Principal Component Analysis on Multi-Spectral Satellite Bands is a vital technique for reducing dimensionality in remote sensing workflows. Modern Earth observation satellites capture information about the same landscape across multiple spectral bands. Landsat and … Read more