How to Build a GIS Portfolio on GitHub/Web to Land Your First Job

GIS Portfolio GitHub web job workflow visualization showing QGIS, GitHub, and portfolio website on screens

How to Build a GIS Portfolio on GitHub/Web to Land Your First Job 1. Introduction: Why Your GIS Portfolio Matters To successfully build a GIS Portfolio GitHub web job application, candidates must showcase practical, well-documented projects that demonstrate their technical abilities. Imagine two applicants applying for the same junior GIS analyst position.Both have similar qualifications … Read more

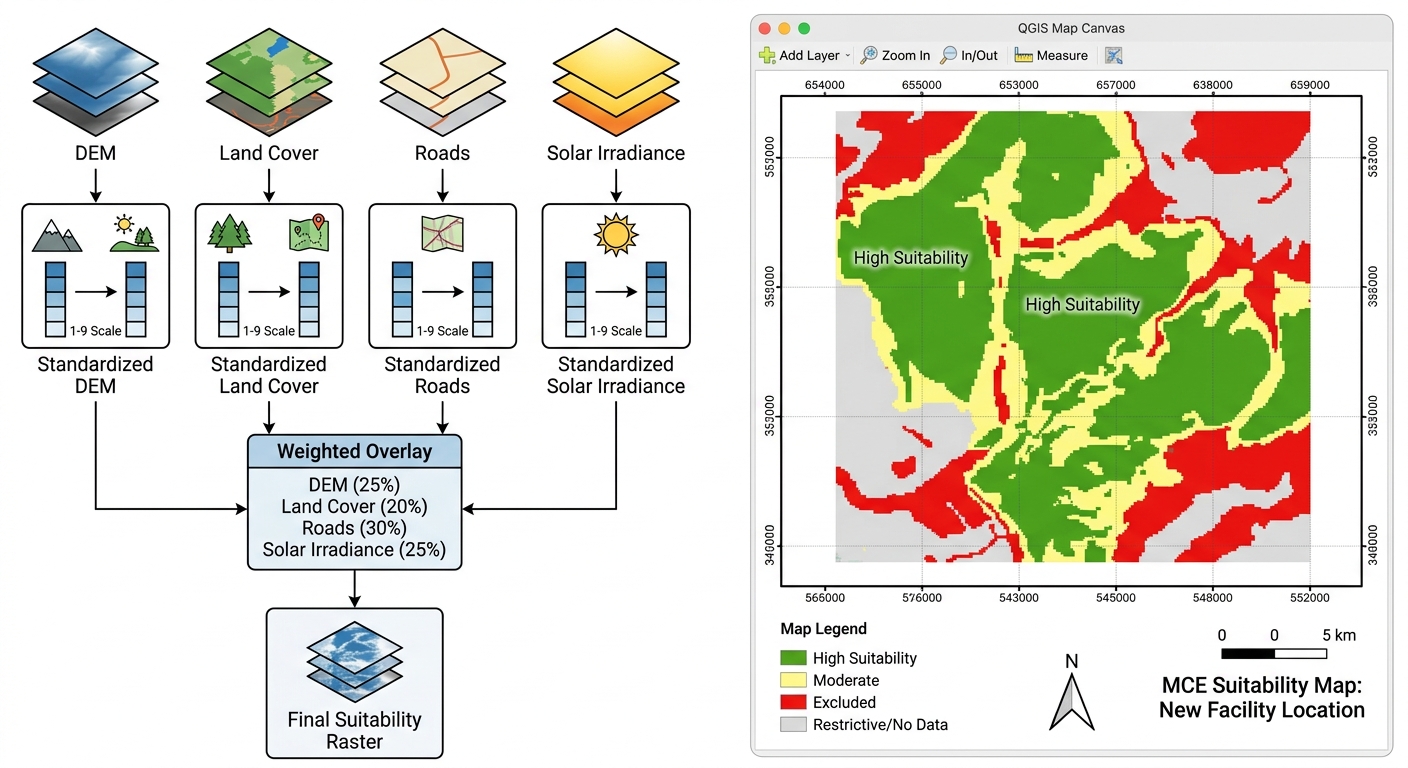
Site Suitability Analysis using Multi-Criteria Evaluation (MCE) in GIS

Prompt: A clean, professional technical diagram and GIS interface layout for an academic tutorial. On the left side, a clear flowchart illustrates a Multi-Criteria Evaluation (MCE) workflow: raw data layers (DEM, Land Cover, Roads, Solar Irradiance) flowing into a standardized reclassification step (1–9 scale), followed by a weighted overlay box leading to a final suitability raster. On the right side, a simulated QGIS map canvas displays a professional site-suitability layout complete with a clear legend, scale bar, grid lines, and a classified raster showing distinct green "High Suitability" zones and red "Excluded" zones. The style is crisp, precise, and educational, resembling an expert GIS lab report figure or textbook illustration.

Site Suitability Analysis using Multi-Criteria Evaluation (MCE) in GIS A practical workflow for university GIS projects using QGIS and ArcGIS Pro Site suitability analysis is one of the most useful applications of GIS because it helps researchers identify locations that best meet a set of environmental, economic, technical, and social requirements. This guide follows a … Read more

LiDAR Data in GIS: 5 Steps to Create Digital Surface Models

LiDAR data in GIS

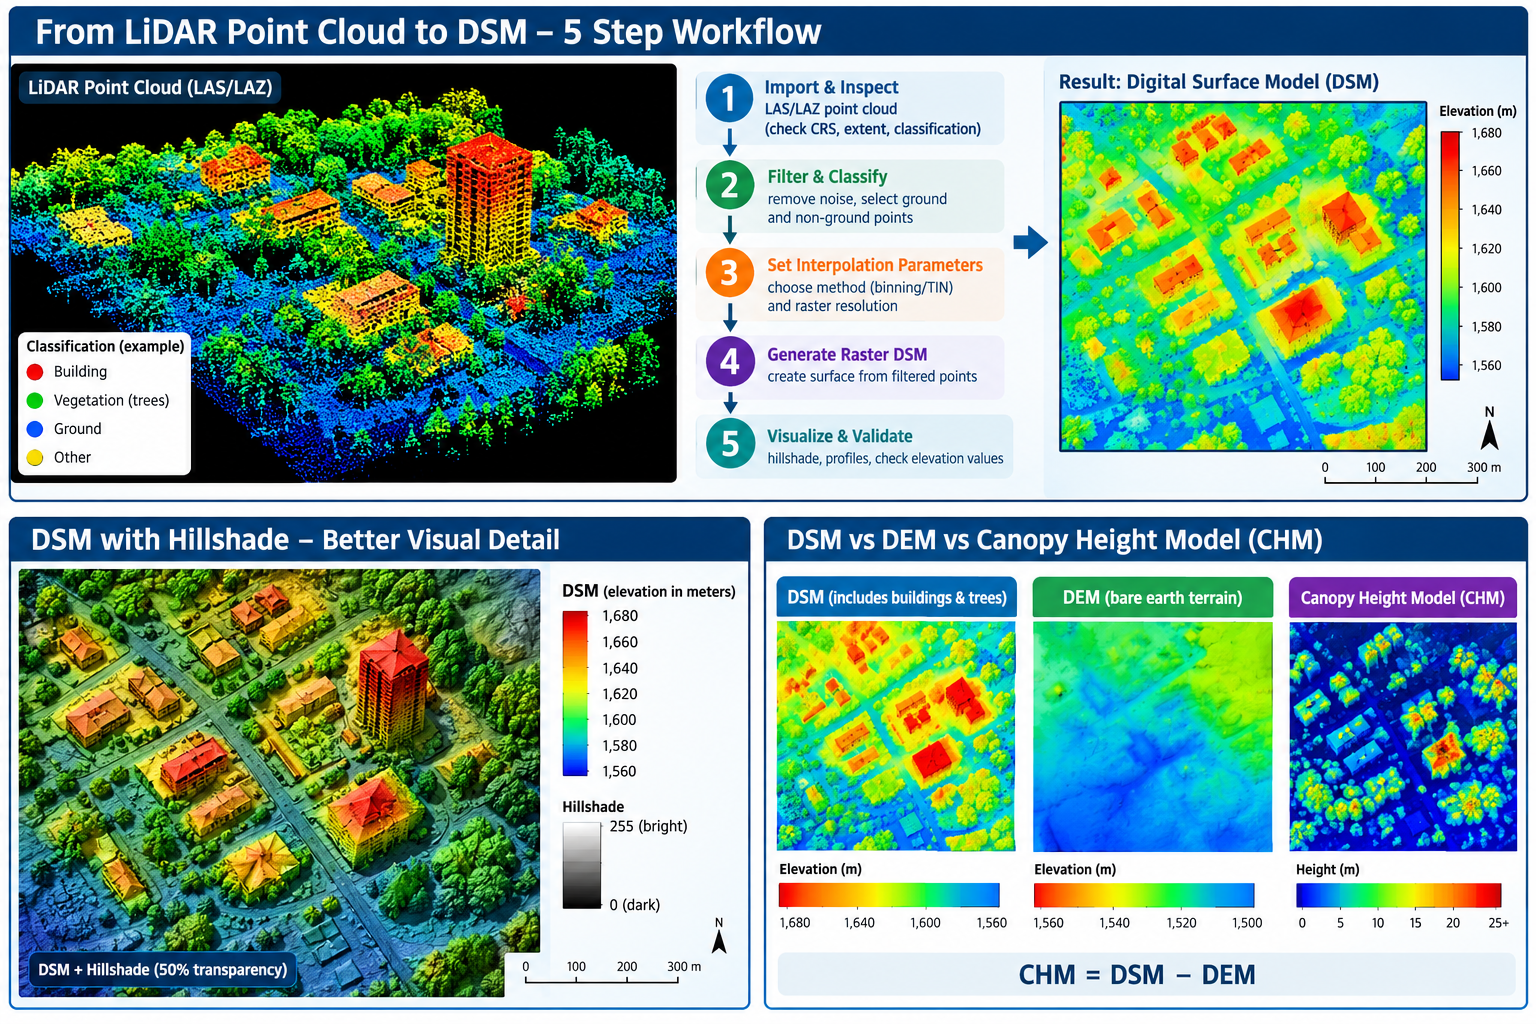
LiDAR Data in GIS: 5 Steps to Create Digital Surface Models (DSM) Introduction LiDAR (Light Detection and Ranging) is a remote-sensing technology that measures the distance between a sensor and objects on the Earth’s surface using laser pulses. A LiDAR survey can produce millions of three-dimensional points containing X, Y, and Z coordinates, where X … Read more

Zonal Statistics in GIS: 4 Steps to Extract Raster Data

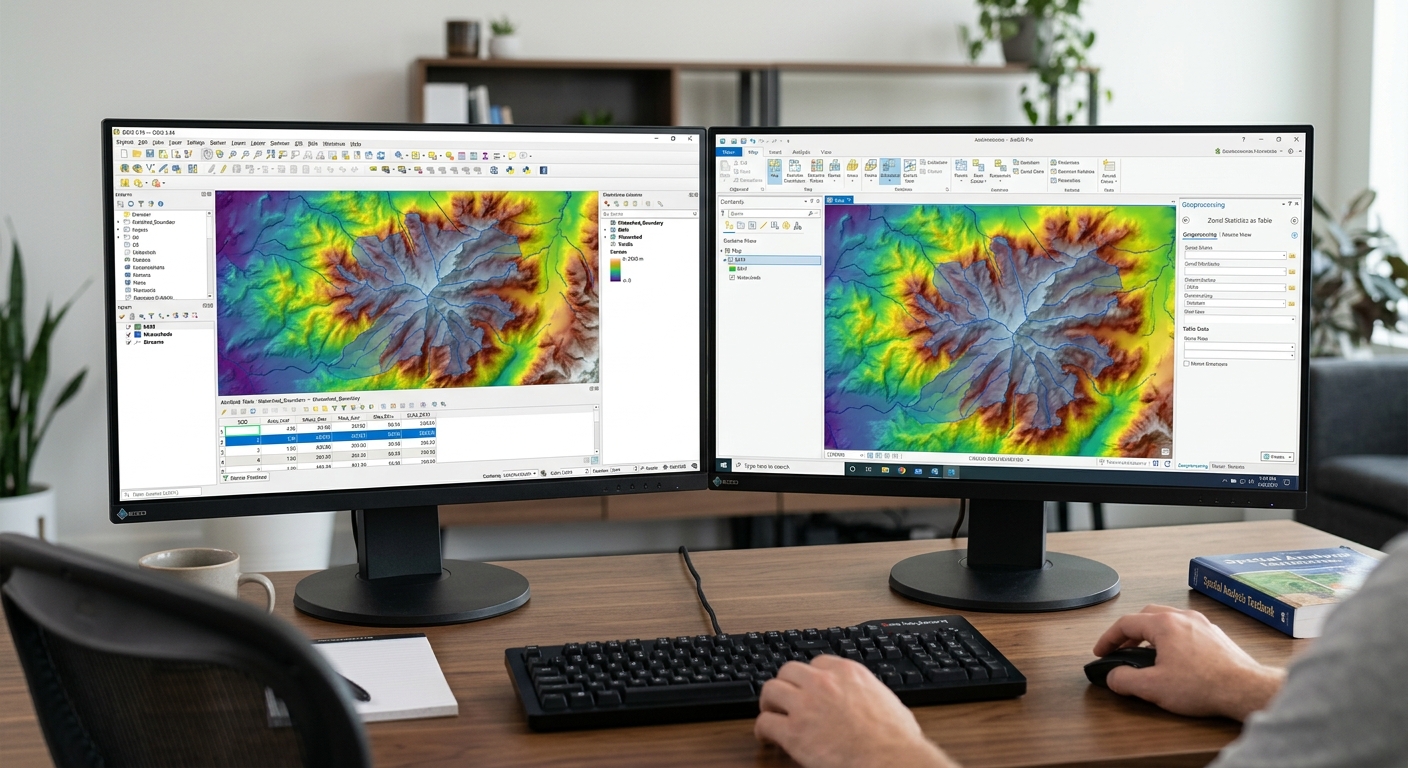
Dual monitor desk setup displaying QGIS and ArcGIS Pro workflows calculating zonal statistics in GIS for digital elevation models and vector polygons

Zonal Statistics in GIS: 4 Steps to Extract Raster Data When completing spatial analysis lab assignments using zonal statistics in GIS, university students frequently encounter a common challenge: summarizing continuous raster data (such as digital elevation models, precipitation surfaces, satellite vegetation indices, or land surface temperatures) across discrete vector polygon boundaries. Whether you need to … Read more

Clip Raster and Vector GIS Layers: 5 Easy Steps

clip raster and vector GIS layers

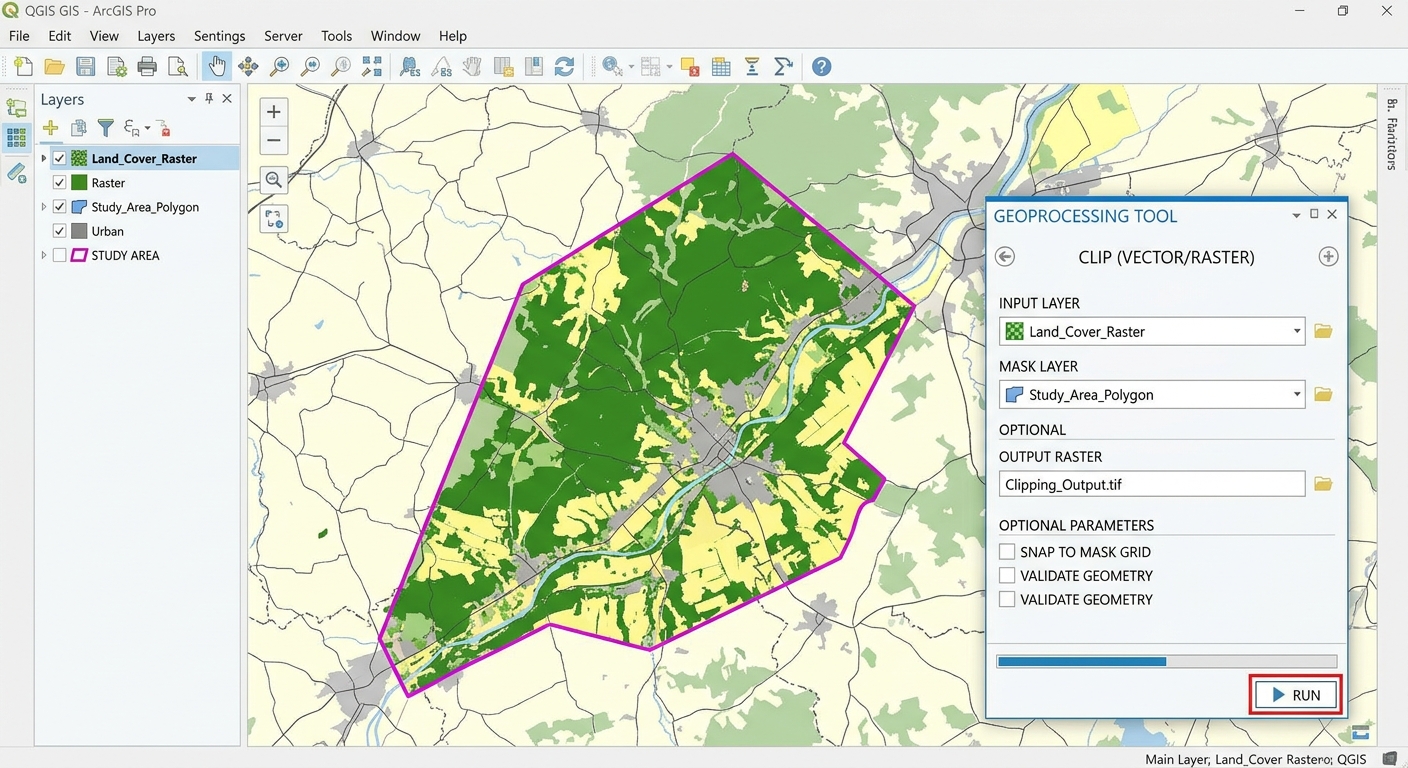
Clip Raster and Vector GIS Layers: 5 Easy Steps When starting a GIS lab assignment, knowing how to clip raster and vector GIS layers down to your specific study boundary is a fundamental skill. However, working with a state-wide road vector file or a national Digital Elevation Model (DEM) can severely slow down processing speeds. … Read more

OLS vs GWR Spatial Regression: Beginner’s Guide

OLS vs GWR spatial regression

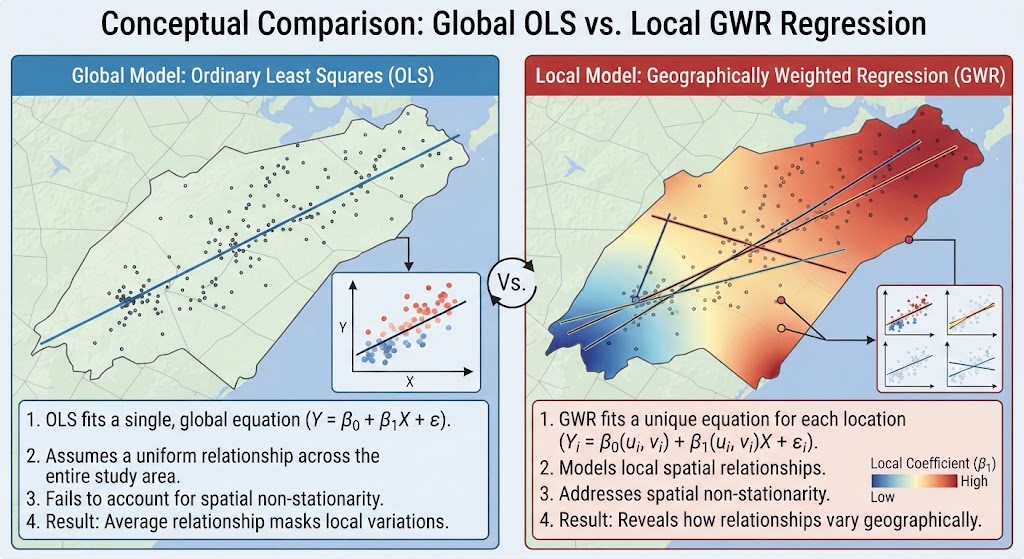
OLS vs GWR Spatial Regression: Beginner’s Guide In advanced spatial analysis coursework, standard linear regression models often fall short when applied to geographic data. If you are examining housing prices, crime rates, or species distributions across a landscape, assuming that relationships between variables remain uniform everywhere can lead to misleading conclusions. Mastering OLS vs GWR … Read more

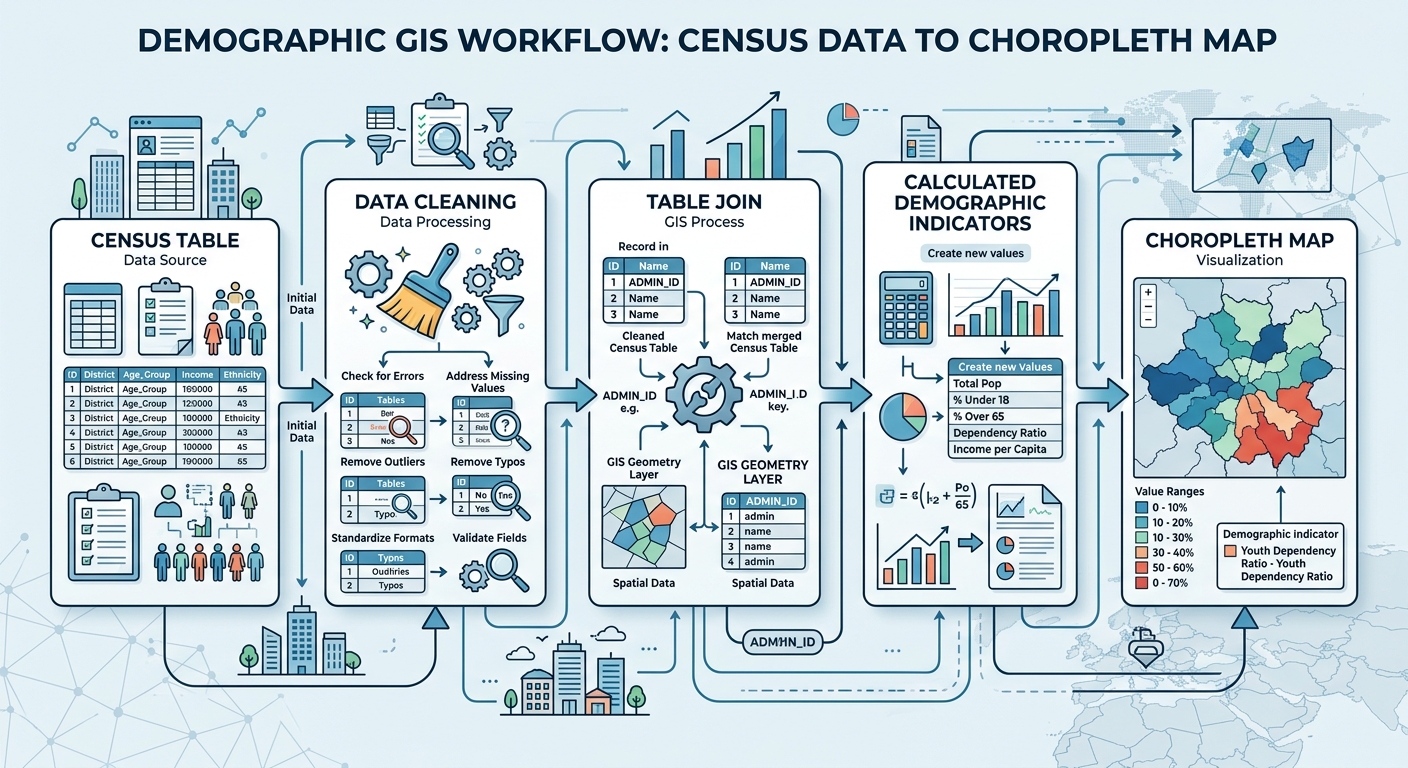
Demographic Analysis in GIS: 5 Steps to Map Census Data

demographic analysis GIS workflow for mapping census data

Demographic Analysis in GIS: 5 Steps to Map Census Data Performing demographic analysis GIS allows you to turn census tables into meaningful maps showing population, income, age, housing, poverty, education, and other socioeconomic patterns. For university GIS assignments, however, the hardest part is often not the mapping itself—it is getting the tabular data to join … Read more

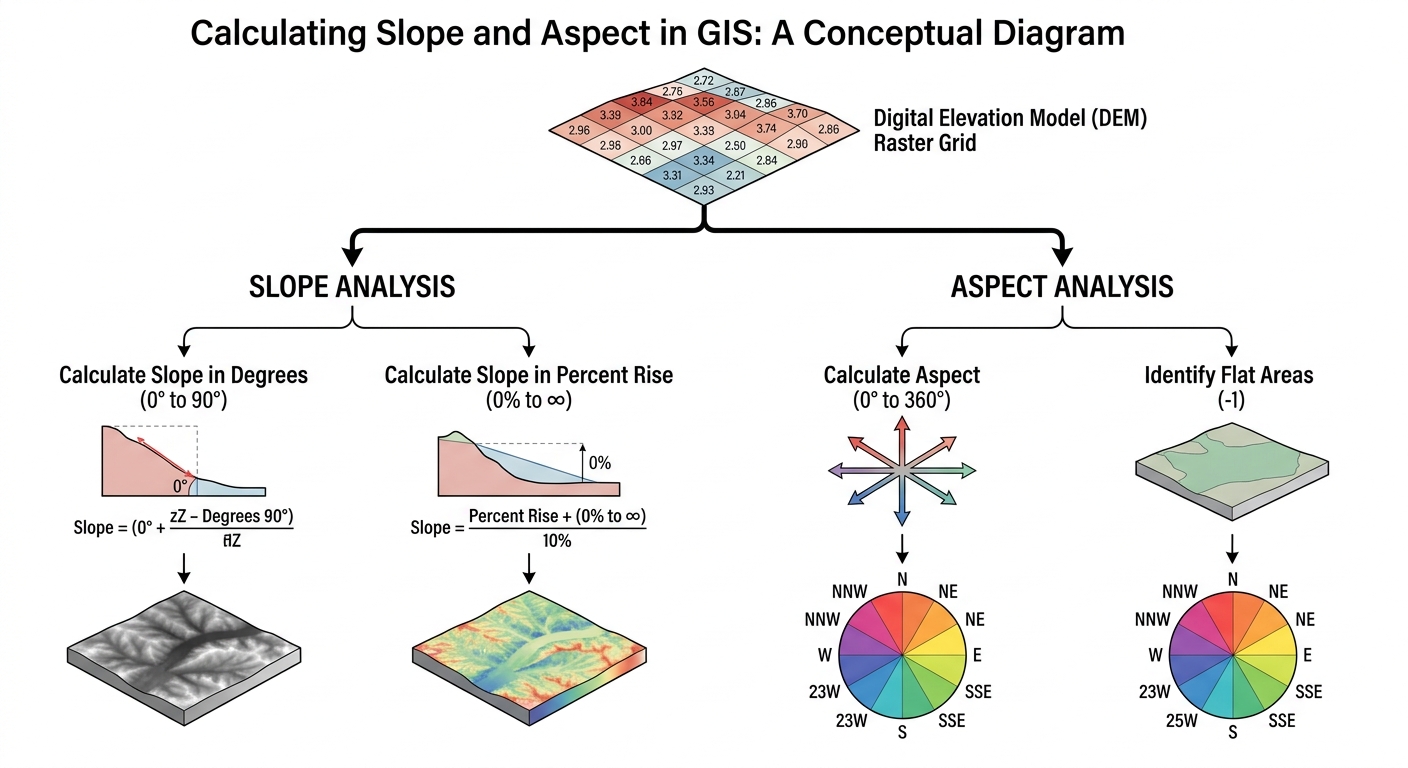
Calculate Slope and Aspect in GIS: 5 Steps for DEM Analysis

calculate slope and aspect GIS

Calculate Slope and Aspect in GIS: 5 Steps for DEM Analysis When tasked with spatial modeling or environmental analysis in university GIS labs, learning how to calculate slope and aspect GIS workflows correctly is essential. Digital Elevation Models (DEMs) store raw elevation data, but deriving terrain steepness (slope) and surface direction (aspect) reveals critical geographical … Read more

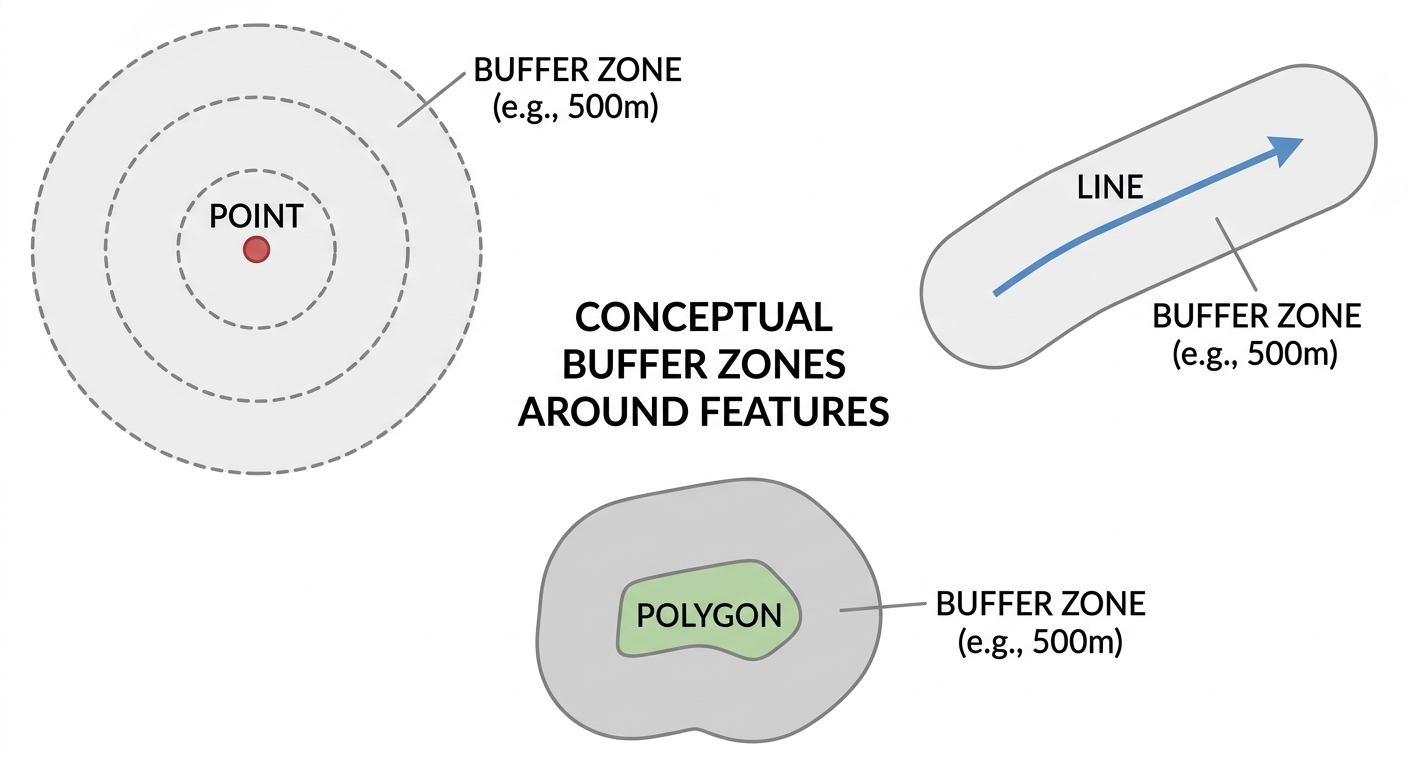
Buffer Analysis in GIS: Step-by-Step Proximity Mapping(2026)

Alt Text: buffer analysis in GIS proximity zones around points lines and polygons

Buffer Analysis in GIS: Step-by-Step Proximity Mapping   Buffer analysis in GIS is one of the most useful proximity-analysis techniques for university GIS assignments. It allows you to create zones at specified distances around points, lines, or polygons and then investigate which features fall inside those zones. For example, you might need to create a … Read more