
Demographic Analysis in GIS: 5 Steps to Map Census Data
Performing demographic analysis GIS allows you to turn census tables into meaningful maps showing population, income, age, housing, poverty, education, and other socioeconomic patterns. For university GIS assignments, however, the hardest part is often not the mapping itself—it is getting the tabular data to join correctly with geographic boundaries.
You may download a CSV or XLSX file containing census statistics, only to discover that your GEOID or FIPS codes have lost leading zeros, fields have different data types, or the table join produces unexpected NULL values.
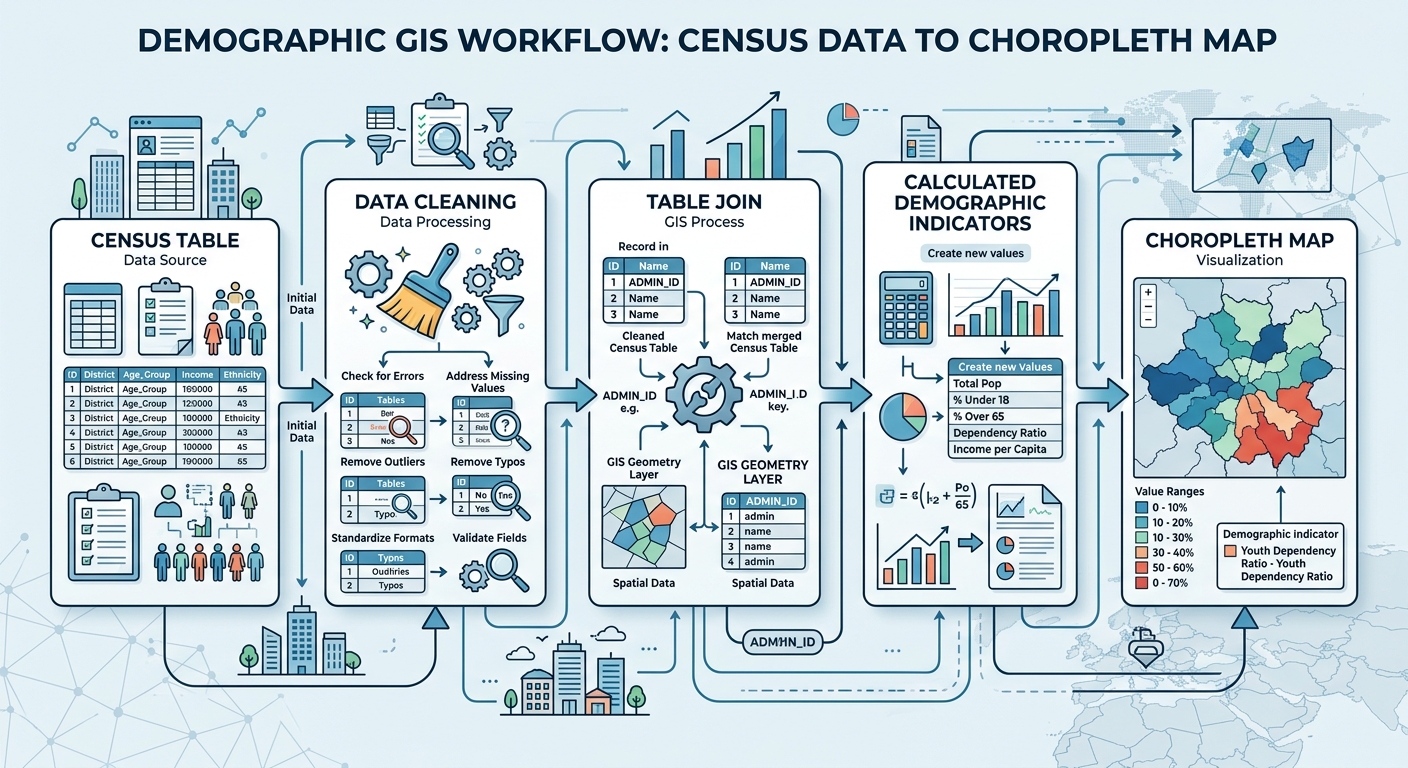
This guide presents a complete workflow from finding census data → cleaning identifiers → joining tables → calculating demographic indicators → creating and interpreting choropleth maps.
Demographic Analysis in GIS: The Complete Workflow
A reliable demographic mapping workflow follows five main stages:
- Source census and boundary data
- Clean and standardize identifier fields
- Join demographic tables to geographic boundaries
- Calculate meaningful demographic indicators
- Create and interpret a choropleth map
The key principle is simple: your statistical table and spatial layer must share a reliable geographic identifier before you attempt the join.
Step 1: Source Census and Demographic Data
Before opening QGIS or ArcGIS Pro, determine exactly what demographic question your assignment is asking.
For example:
- Where are population densities highest?
- Which census tracts have the highest poverty rates?
- Where is the elderly population concentrated?
- How does median household income vary geographically?
- Which areas have the highest percentage of children?
Your question determines which variables you need.
Use the U.S. Census Bureau
For U.S.-based assignments, the U.S. Census Bureau is one of the most important sources of demographic information.
[External Link Placeholder: U.S. Census Bureau data tools]
Depending on the assignment, you may encounter:
- Decennial Census data
- American Community Survey (ACS)
- Population estimates
- Housing statistics
- Economic and socioeconomic variables
Census datasets are commonly available as CSV, XLSX, API responses, or other tabular formats.
Use NHGIS for Historical or Harmonized Data
The IPUMS National Historical Geographic Information System (NHGIS) is another useful source, particularly when an assignment requires historical census data or harmonized geographic information.
NHGIS can be particularly useful when you need to compare demographic characteristics across multiple census years.
Find Boundary Data
Your demographic table is not enough to create a map.
You also need a spatial boundary layer representing the geographic units in the table.
Examples include:
- States
- Counties
- Census tracts
- Block groups
- ZIP Code Tabulation Areas
- Municipal boundaries
The geographic level must match the demographic data.
For example, county-level statistics should be joined to county boundaries—not census tract boundaries.
Check the Geographic Identifier
Before downloading anything, identify the field that connects the table to the spatial layer.
Common identifiers include:
- GEOID
- FIPS code
- State FIPS
- County FIPS
- Tract code
- Block group code
The identifier is effectively the key that allows GIS to connect the two datasets.
Step 2: Clean Census Tables Before Joining
Data cleaning is one of the most important stages of demographic analysis GIS.
A table can look perfectly normal in Excel while still failing to join correctly in GIS.
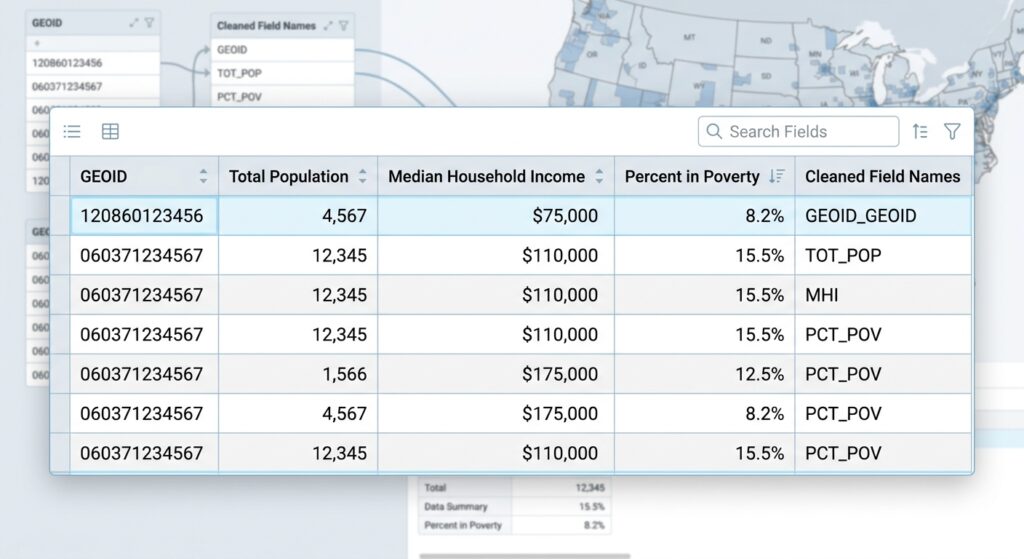
Inspect the Identifier Field
Suppose your census table contains:
| GEOID | Population |
|---|---|
| 01001 | 58,000 |
| 01003 | 220,000 |
| 01005 | 27,000 |
The GEOID must be treated consistently.
If one dataset stores 01001 as text but another stores it as a number, GIS may not recognize them as matching values.
Preserve Leading Zeros
This is one of the most common census-data problems.
A code such as:
01001
can accidentally become:
1001
when a CSV is opened in spreadsheet software or imported with automatic numeric type detection.
The two values are not equivalent as strings.
Pro Tip: Geographic identifiers should generally be treated as text/string fields, not numerical measurements.
If your identifier has five digits, make sure every record follows the same format.
Check Field Names
Clean confusing or excessively long field names before beginning the analysis.
For example:
B01001_001E
may represent a census variable that needs a more descriptive name such as:
Total_Pop
Keep the original variable definitions documented separately so that you can explain exactly what the field represents.
Check for Null Values
Look through your table for:
- Blank GEOIDs
- Missing demographic values
- Duplicate identifiers
- Invalid characters
- Unexpected spaces
- Different code formats
A single extra space can cause a join to fail.
For example:
01001
and
01001
may appear identical visually but can be treated differently by software.
Step 3: Join Census Data to GIS Boundaries
Once the table and boundary layer have compatible identifiers, you can perform the table join.
The basic relationship is:
Spatial boundary GEOID → Census table GEOID
The GIS software searches for matching values and attaches the demographic attributes to the geographic features.
How to Join Census Data in QGIS
Step 1: Load the Boundary Layer
Open QGIS and add your census boundary shapefile, GeoPackage, or other vector dataset.
Open its attribute table.
Find the geographic identifier field.
For example:
GEOID
Step 2: Add the Census Table
Use:
Layer → Add Layer → Add Delimited Text Layer
for a CSV file, or use the appropriate data source option for XLSX/tabular data.
Confirm that the GEOID field is being interpreted as text.
Step 3: Open Layer Properties
Right-click the boundary layer and select:
Properties → Joins
Click the + button to create a new join.
Step 4: Select the Join Fields
Choose:
Join layer: census table
Join field: GEOID
Target field: GEOID in the boundary layer
The two fields must contain matching values.
[IMAGE PLACEHOLDER: Table join properties window matching FIPS/GEOID codes in QGIS | Alt Text: demographic analysis GIS table join dialog box]
Step 5: Check the Result
Open the boundary layer’s attribute table.
You should now see the demographic fields attached to the spatial features.
Check several records manually.
If you see many NULL values, stop before creating your map.
Investigate the join first.
How to Join Census Data in ArcGIS Pro
ArcGIS Pro provides a straightforward table-join workflow.
Step 1: Add Your Boundary Layer
Add the census tract, county, or other boundary layer to the map.
Open its attribute table and identify the geographic identifier.
Step 2: Add the Census Table
Add your CSV, Excel table, or other demographic dataset to the project.
Check the identifier field carefully.
Step 3: Use Add Join
Right-click the spatial layer in the Contents pane.
Choose:
Joins and Relates → Add Join
Step 4: Match the Fields
Select the demographic table and choose the corresponding identifier fields.
For example:
Input Table: Census Tracts
Input Join Field: GEOID
Join Table: ACS Data
Join Table Field: GEOID
Run the join.
Step 5: Verify the Join
Open the attribute table and inspect the newly attached fields.
Don’t assume that a successful tool execution means that all records matched.
Check for:
- NULL values
- unmatched records
- duplicate identifiers
- unexpected field types
[IMAGE PLACEHOLDER: ArcGIS Pro Add Join dialog showing census tract GEOID and demographic table matching fields | Alt Text: ArcGIS Pro census table join using GEOID fields]
Step 4: Calculate Demographic Metrics
Joining raw census variables is only part of demographic analysis GIS.
You often need to transform counts into rates, percentages, ratios, or densities before mapping them.
This is important because raw population totals can produce misleading visual patterns.
Calculate Population Density
Suppose your census layer contains:
- Population = 20,000
- Area = 10 km²
Population density is:
Population Density=PopulationAreaPopulation\ Density = \frac{Population}{Area}
Therefore:
20,00010=2,000 people/km2\frac{20,000}{10} = 2,000\ people/km^2
Density allows you to compare areas of different sizes more fairly.
Calculate Poverty Rate
Suppose a census tract has:
- Population below poverty = 1,200
- Population for whom poverty status is determined = 6,000
The poverty rate is:
Poverty Rate=1,2006,000×100Poverty\ Rate = \frac{1,200}{6,000} \times 100 =20%= 20\%
Mapping the percentage provides more meaningful comparison than simply mapping the number of people below poverty.
Calculate Percentage of Elderly Residents
You could calculate:
Elderly Percentage=Population Age 65+Total Population×100Elderly\ Percentage = \frac{Population\ Age\ 65+}{Total\ Population} \times 100
This produces a normalized measure that can be compared between geographic units.
Using the Field Calculator in QGIS
Open the attribute table and select Field Calculator.
Create a new decimal field such as:
Poverty_Rate
Then use an expression similar to:
("Below_Poverty" / "Poverty_Universe") * 100Always check whether the denominator can contain zero or NULL values.
For more complex calculations, use conditional expressions to prevent division errors.
Using the Field Calculator in ArcGIS Pro
Open the attribute table and use Calculate Field.
For example, a percentage can be calculated conceptually as:
(!Below_Poverty! / !Poverty_Universe!) * 100The exact expression depends on the field names and selected expression language.
After calculating the field, inspect the resulting values.
A percentage field should normally fall between 0 and 100, unless the statistic has been defined differently.
Pro Tip: Never map a percentage field without checking its minimum and maximum values first. A data-cleaning error can produce impossible values such as 500%.
Step 5: Create a Choropleth Demographic Map
Once your demographic variable is ready, you can symbolize it using graduated colors.
A choropleth map uses differences in color or shading to represent the values of a variable across geographic areas.
Examples include:
- Poverty rate
- Population density
- Median income
- Percentage aged 65+
- Unemployment rate
Creating a Choropleth in QGIS
Right-click the layer and choose:
Properties → Symbology
Select:
Graduated
Choose your demographic field.
Then select a classification method and number of classes.
Creating a Choropleth in ArcGIS Pro
Select your layer and open the Symbology pane.
Choose:
Graduated Colors
Select the demographic field you calculated.
ArcGIS Pro will classify the values into groups that can be visualized on the map.
Quantile vs Natural Breaks (Jenks)
The classification method can significantly influence how your demographic map looks.
Quantile Classification
Quantile places approximately the same number of geographic features into each class.
For example, with four classes, each class may contain approximately 25% of the areas.
This is useful when you want to highlight relative ranking.
However, the numerical range within each class may vary considerably.
Natural Breaks (Jenks)
Natural Breaks attempts to identify groups based on the natural distribution of the data.
Values that are relatively similar tend to be placed together, while larger gaps between values can become class boundaries.
Natural Breaks can work well when your demographic data contains recognizable clusters or gaps.
Which Should You Choose?
There is no universally “correct” classification method.
Use Quantile when relative ranking is important.
Use Natural Breaks/Jenks when you want the classes to reflect natural groupings in the data.
[Internal Link Context: Suggest linking to related article on Data Classification Methods in GIS]
Pro Tip: For an academic assignment, don’t simply write “Natural Breaks was selected.” Explain why it was appropriate for the distribution of your demographic variable.
Why Normalized Data Matters in Demographic Mapping
One of the most important principles in demographic analysis is distinguishing between counts and rates.
Imagine two counties:
| County | Population | People Below Poverty |
|---|---|---|
| A | 500,000 | 40,000 |
| B | 50,000 | 8,000 |
County A has more people experiencing poverty in absolute terms.
But the poverty rates are:
County A: 8%
County B: 16%
If you map raw poverty counts, County A appears more severe.
If your question is “Where is poverty more prevalent relative to population?”, County B is the more relevant result.
Therefore:
Map normalized rates, percentages, or densities when comparing populations of different sizes.
This is one of the most important concepts to mention in a GIS lab report.
Troubleshooting Census Table Joins
Problem: Most Records Are NULL
Check whether the join fields contain the same values.
For example:
Boundary: 01001
Table: 1001
These will not match correctly as strings.
Problem: Leading Zeros Disappeared
The CSV was probably interpreted as a numeric field.
Re-import the data while explicitly treating the GEOID/FIPS field as text.
Problem: Field Types Are Different
One field might be text while the other is numeric.
Convert them so that both fields use compatible data types.
Problem: Duplicate GEOIDs Exist
A standard one-to-one attribute join expects the identifier to identify the appropriate geographic record.
If the demographic table contains multiple records for the same GEOID, determine why.
You may need to aggregate the table before joining.
Problem: Wrong Geographic Level
You may be trying to join tract-level data to county boundaries.
Always confirm that both datasets represent the same geographic units.
How to Validate Your Demographic Map
Don’t finish your assignment immediately after the map renders.
Perform several checks.
Check 1: Attribute Table
Confirm that demographic values were successfully transferred.
Check 2: Map Distribution
Does the map make geographical sense?
If one tiny area suddenly has an impossible value, investigate.
Check 3: Statistics
Use basic statistics to examine:
- minimum
- maximum
- mean
- median
- standard deviation
Check 4: Sample Records
Select several geographic features and manually compare their mapped values against the original census table.
Check 5: Map Design
Your final map should include:
- Title
- Legend
- Scale bar
- North arrow where appropriate
- Data source
- Projection/CRS information where required
- Author/student information if required
- Appropriate classification
A Practical Demographic Analysis GIS Workflow for Your Lab Report
You can document your methodology using the following structure:
1. Data Acquisition
State where the demographic table and geographic boundaries came from.
2. Data Preparation
Explain how you cleaned the GEOID/FIPS fields and handled missing values.
3. Table Join
Identify the join field and explain how demographic attributes were attached to spatial features.
4. Variable Calculation
Provide the equation used to calculate your demographic indicator.
For example:
Poverty Rate=Population Below PovertyPopulation in Poverty Universe×100Poverty\ Rate = \frac{Population\ Below\ Poverty} {Population\ in\ Poverty\ Universe} \times100
5. Cartographic Visualization
State the classification method used and explain why it was selected.
6. Interpretation
Describe the geographic pattern shown by the final map.
This transforms your assignment from a simple “map-making exercise” into a reproducible spatial analysis.
Frequently Asked Questions (FAQ)
Why should I map population density instead of raw population totals?
Raw population totals favor large geographic areas. Population density accounts for area, making it easier to compare how concentrated populations are across locations of different sizes.
What is a GEOID/FIPS code and why is it essential for demographic mapping?
A GEOID/FIPS code is a geographic identifier assigned to a specific statistical or administrative area. It provides the common key that allows a demographic table to be joined reliably to its corresponding GIS boundary.
How do I prevent losing leading zeros when importing CSV census data into GIS?
Treat GEOID and FIPS fields as text/string fields, not numbers. When importing the CSV, explicitly set the identifier’s data type to text and verify that codes retain their required number of digits.
Conclusion: Building Better Demographic Maps in GIS
A successful demographic analysis GIS workflow is about much more than downloading census data and applying colors to a map.
The most important steps are:
- Find compatible census and boundary datasets.
- Clean GEOID/FIPS identifiers before joining.
- Make sure both join fields have compatible data types.
- Verify the join and investigate NULL values.
- Calculate normalized demographic indicators such as rates, percentages, and densities.
- Choose an appropriate choropleth classification method.
- Validate both the data and the final map.
- Explain your methodological decisions in the lab report.
Most importantly, remember that good demographic mapping starts with good data preparation. A beautifully designed choropleth map cannot fix an incorrectly joined census table.
If your census table join is failing, your GEOID codes are producing NULL values, or you’re unsure whether to use Quantile or Natural Breaks, share the fields and error you’re seeing. That is usually enough to diagnose where the GIS workflow has gone wrong.