
How to Export High-Resolution Vector PDFs and SVGs from GIS for Adobe Illustrator
1. Introduction: Why Export GIS Maps to Graphic Design Software?
When preparing professional cartographic deliverables, learning how to Export Vector PDF SVG GIS Adobe Illustrator correctly is essential for maintaining clean vector layers and sharp typography. GIS software is built for spatial analysis, geographic accuracy, and data-driven mapping. Graphic design applications such as Adobe Illustrator and Inkscape offer more detailed control over typography, page composition, colours, and final visual presentation.
For academic theses, journal publications, conference posters, and client reports, you may need to refine a map after completing the geographic analysis. Common adjustments include fine-tuning label positions, aligning layout elements, modifying line weights, and applying a consistent publication style.
The challenge is transferring a GIS layout into graphic design software without losing vector quality, geographic accuracy, or the organization of the original map layers.
A standard raster export, such as PNG or JPEG, converts the map into pixels. It may look sharp at its intended size, but individual roads, boundaries, labels, and symbols are no longer independently editable vector objects.
A vector PDF or SVG can preserve much of this content as editable paths and text. Raster elements, such as aerial imagery and some transparency effects, may still be represented as pixels.
For ArcGIS Pro users, the AIX (Adobe Illustrator Exchange) format provides another option: it is specifically designed to transfer map content into organized, editable Illustrator artwork using the ArcGIS Maps for Adobe Creative Cloud extension. See the ArcGIS Pro AIX export guide.
This tutorial explains how to prepare your map, export vector PDFs and SVGs, transfer them into Illustrator or Inkscape, and troubleshoot common publishing problems.
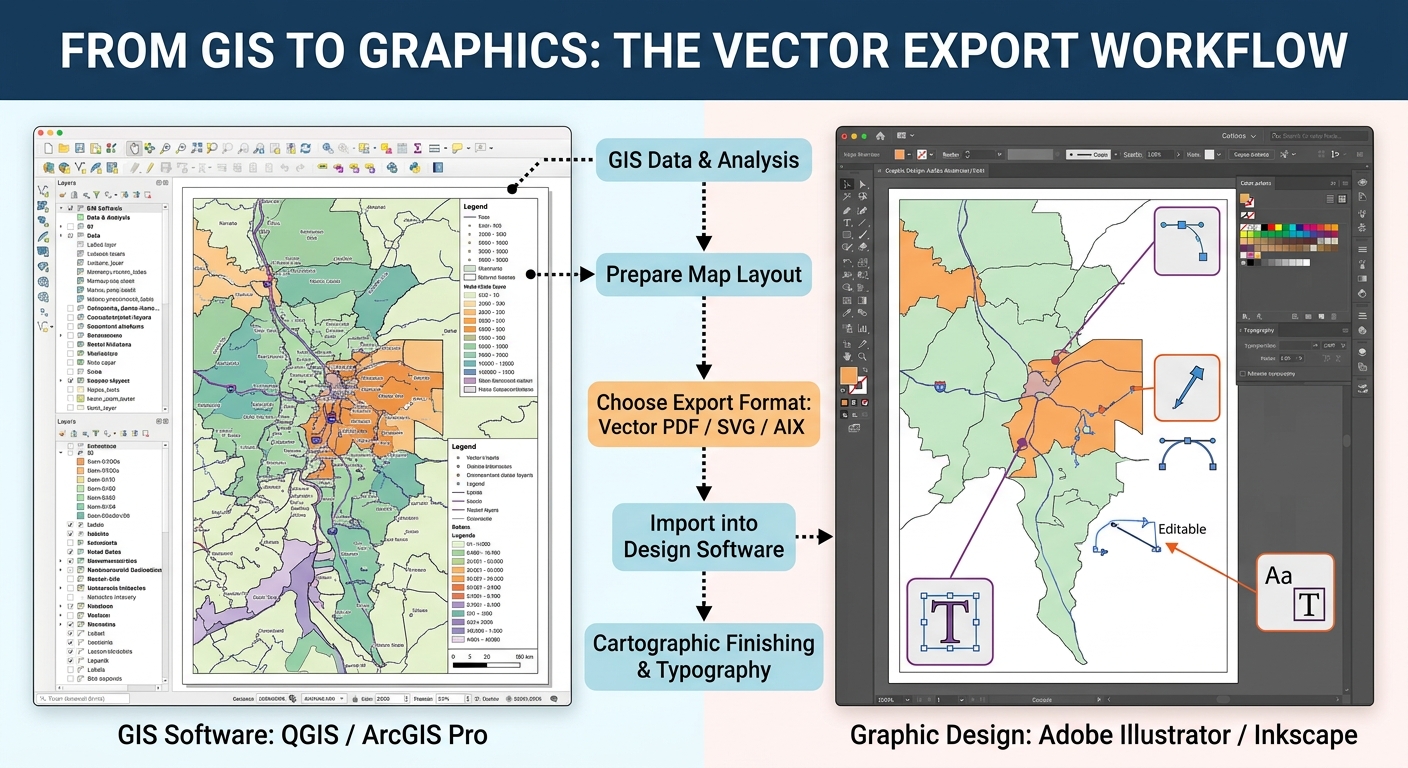
The central workflow is:
Prepare the GIS project
          |
          v
Finalize page size and map layout
          |
          v
Choose vector PDF, SVG, or AIX
          |
          v
Configure text, compression and layers
          |
          v
Open in Illustrator or Inkscape
          |
          v
Refine typography and graphical styling
          |
          v
Verify scale and export the publication file
The golden rule: Complete all spatial analysis and geographic decisions in GIS first. Use graphic design software primarily for presentation refinements, not for rebuilding the underlying geography.
2. Preparing Your Map in QGIS or ArcGIS Pro Before Exporting
A successful export begins with a well-organized GIS project. Unnecessary layers, poorly structured labels, complex transparency effects, and incorrect page dimensions can cause problems when the map is opened in a vector editor.
2.1 Finalize the map layout dimensions
Before exporting, decide where the map will be used.
Typical examples include:
| Output | Common page or canvas size | Recommended approach |
|---|---|---|
| Thesis figure | A4 or a figure-sized area within a page | Match the university’s formatting requirements |
| Conference poster | A1, A0, or a specified custom size | Set the final dimensions before exporting |
| Journal figure | Publisher-specified width and height | Follow the journal’s figure guidelines |
| Client report | A4, Letter, or a custom page | Match the report template |
Do not design the map at one size and then scale it arbitrarily after export without considering its typography, map scale, and scale bar.
In QGIS
-
Open Project → New Print Layout, or open your existing layout.
-
Right-click the page and open Page Properties.
-
Choose the correct page size and orientation.
-
Select the map item and check its dimensions and geographic extent.
-
Confirm that the title, legend, labels, scale bar, and source notes fit within the page.
-
Save the QGIS project.
In ArcGIS Pro
-
Open the layout view.
-
On the Layout tab, inspect the page setup and dimensions.
-
Use the correct page size and orientation for the intended publication.
-
Confirm that the map frame is positioned correctly within the page.
-
Check text sizes, margins, and layout elements.
-
Save the project.
Practical tip: Set the final page size before exporting. It is easier to design a map at the correct physical dimensions than to repair scaling and typography problems in Illustrator afterward.
2.2 Organize layers and simplify the project
The source map may contain many layers that do not all need to appear in the exported document.
- Remove or hide unnecessary intermediate layers.
- Give layers descriptive names, such as
Primary Roads,Administrative Boundaries, andPopulation Density. - Group layers logically, for example into
Base Map,Thematic Data, andLabels. - Reduce unnecessarily complicated symbology.
- Review transparency, blend modes, and pattern fills.
- Confirm the drawing order before export.
Layer organization is especially valuable when the map is transferred to Illustrator, where exported content may be represented as numerous paths or grouped objects.
For a large dataset, consider generalizing or simplifying geometry for the intended display scale. A nationwide road dataset with millions of vertices may create a very large vector file even if the final map is only A4-sized.
2.3 Manage labels before exporting
Labels often require the most attention during post-production. A label that looks good on the GIS canvas may shift, change appearance, or become difficult to edit when transferred to another application.
Before export:
-
Resolve major label collisions.
-
Set appropriate label priorities and placement rules.
-
Use consistent fonts and sizes.
-
Confirm that important place names are visible.
-
Review halos and outlines for roads, boundaries, and complex backgrounds.
Should you convert labels to annotation?
It depends on your software and intended workflow.
In ArcGIS Pro, converting labels to annotation can be helpful when you need to preserve carefully positioned label placements as stored GIS annotation. However, for Illustrator editing, AIX can transfer labels as editable text without requiring all labels to be converted to annotation first.
In QGIS, labels can generally be exported as text objects or outlines. QGIS does not use exactly the same label-to-annotation workflow as ArcGIS Pro, so choose the appropriate export option instead.
For graphic editing, the practical choices are:
- Editable text: Best when you may need to change the wording, font, or size.
- Text outlines: Best when the visual appearance must remain consistent even if the destination computer lacks the original font, but the letters are no longer ordinary editable text.
- Stored annotation: Useful in ArcGIS workflows when label placement needs to be fixed and managed as geographic annotation before export.
If the map has complex typography, duplicate the final GIS project before making permanent annotation or labeling changes.
2.4 Understand raster and vector content
A map can contain both vector and raster data.
Vector content includes points, lines, polygons, many symbols, and text. It is generally scalable without the pixelation associated with a low-resolution image.
Raster content includes satellite imagery, hillshade, aerial photography, and rasterized drawing effects. Its perceived quality depends on the resolution at which it is exported and displayed.
A vector PDF may therefore contain editable vector features alongside embedded raster images. The file extension alone does not guarantee that every object is vector-based.
3. Step 1: Export Vector Maps from QGIS
QGIS Print Layout supports PDF and SVG output. Both can preserve vector content, although the available settings and final object structure differ.
The official QGIS layout export guide describes the available export options.
3.1 Export as SVG
SVG is an XML-based vector graphics format. It is useful when you want to inspect and edit vector objects in Illustrator or Inkscape.
Workflow
-
Open the finished layout.
-
Click Export as SVG in the Print Layout toolbar.
-
Choose a descriptive filename, such as
population_density_map.svg. -
Review the SVG Export Options dialog.
-
Apply the settings in the table below.
-
Export the file and open it in your preferred vector editor.
Recommended QGIS SVG settings
| Setting | Recommended choice | Reason |
|---|---|---|
| Export map layers as SVG groups | Enable | Groups output items according to GIS layer names |
| Always export as vectors | Enable for vector editing, then inspect output | Helps retain vector objects, but certain effects may render differently |
| Text export | Text objects for editing; outlines if font fidelity is essential | Balances editability and appearance |
| Simplify geometries | Usually enable for complex cartographic layers | Can reduce unnecessary vertices and file size |
| Crop to content | Usually disable for a fixed publication page | Preserves the intended page dimensions |
| Disable tiled raster layer exports | Enable only if tiled raster seams appear | Can eliminate seams but increases memory use |
| Open file after exporting | Optional | Convenient for immediate inspection |
These are practical defaults, not absolute rules. If the final layout relies on rendering effects that cannot be preserved as vectors, forcing all items to remain vector-based can produce a different appearance from the QGIS preview.
Important: SVG export is particularly convenient for vector objects, but transparency, clipping, and some symbol effects may need adjustment after import. Always compare the result against the original GIS layout.
3.2 Export as PDF
PDF is often the safest general-purpose format for delivering publication-quality layouts because it can preserve vector geometry, text, page dimensions, and embedded raster imagery in one document.
Workflow
-
Open the QGIS Print Layout.
-
Click Export as PDF.
-
Choose the output filename.
-
Review the PDF Export Options dialog.
-
Ensure Print as raster is not enabled in the layout settings.
-
Choose appropriate vector and image settings.
-
Export and inspect the result in a PDF viewer before opening it in Illustrator.
Recommended QGIS PDF settings
| Setting | Recommended choice | Reason |
|---|---|---|
| Print as raster | Off | Avoids rasterizing the entire layout |
| Always export as vectors | On for editable vector output, unless the appearance changes materially | Preserves vector objects where supported |
| Text export | Text objects for editing; paths for appearance consistency when needed | Controls how text is transferred |
| PDF image compression | Lossless for editing and print-production workflows | Avoids lossy compression of raster content |
| Simplify geometries | Usually enable for complex maps intended for a fixed output size | Reduces unnecessary geometry vertices |
| Crop to content | Usually off for fixed page dimensions | Prevents unintended changes to the page extent |
| Append georeference information | Optional | Useful when the PDF also needs geographic reference information |
| Disable tiled raster layer exports | Enable only if visible seams occur | May improve raster continuity at additional memory cost |
QGIS documents that lossy JPEG compression is the default PDF image-compression mode in the documented version, while lossless compression is more suitable for printing and external post-production. See the QGIS PDF export options.
A critical setting: If you set a vector layer’s opacity below 100%, QGIS may rasterize that content during PDF export. Depending on the size of the layer, this may also increase the file size. If you need editability, inspect transparency and blend effects before exporting.
3.3 What does DPI mean for vector exports?
DPI means dots per inch. In GIS export workflows, resolution settings matter most for raster imagery and for map content that must be rasterized to preserve certain effects.
A vector path is defined by coordinates rather than a fixed grid of pixels, so it does not become pixelated merely because you zoom in. However, any raster imagery inside the file still depends on its output resolution.
Practical starting points:
- 300 DPI: A common starting point for print-ready maps containing raster imagery.
- 600 DPI: Useful in some high-detail print workflows, but can increase file size and processing time.
- Lower resolution: May be suitable for screen-focused graphics or maps with large photographic backgrounds where the publication requirements allow it.
For QGIS layouts, set the export resolution through the layout’s export settings and review how it affects rasterized content. Increasing the DPI cannot restore detail that was absent from the original raster source.
4. Step 2: Export from ArcGIS Pro as AIX or Vector PDF
ArcGIS Pro offers two main options for moving map content into Adobe Illustrator: export to AIX using the ArcGIS Maps for Adobe Creative Cloud extension, or export to PDF and open that PDF in a vector editor.
4.1 Best option for Illustrator: AIX
The Adobe Illustrator Exchange (AIX) format is specifically intended to transfer ArcGIS map and layout content into organized, editable Illustrator artwork through the ArcGIS Maps for Adobe Creative Cloud extension.
It is generally the preferred starting point when you want to adjust a map’s layer-specific styling in Illustrator.
Workflow
-
Open the map or layout in ArcGIS Pro.
-
Confirm that the map frame and layout elements are correctly positioned.
-
Click the Share tab.
-
In the export group, select Export Map or Export Layout, depending on the active view.
-
Set File Type to AIX.
-
Choose the destination folder and filename.
-
Review the available export properties.
-
Export the file.
-
Open Adobe Illustrator and install or enable ArcGIS Maps for Adobe Creative Cloud if needed.
-
Use File → Open to open the AIX file.
-
Review the generated layer organization and edit the graphical elements.
Consult the official ArcGIS Pro AIX export guide and AIX workflow documentation.
Prepare your layout for AIX
Esri recommends designing maps with the Illustrator editing workflow in mind.
- Use recognizable layer names so the exported structure is easy to navigate.
- Prefer common symbology types such as Single Symbol, Unique Values, Graduated Colors, and Graduated Symbols.
- Keep label placement readable and avoid unnecessary text complexity.
- Turn on symbol-layer drawing in ArcGIS Pro when maintaining the symbol drawing order is important.
- Review transparency and blend modes; some unsupported blend modes are rasterized together with layers beneath them.
- Keep the map frame within the layout area and review the AIX export recommendations for clipping and wrapping around the date line.
The AIX workflow is one-way: changes made to the artwork in Illustrator do not automatically update the original ArcGIS Pro map. If the spatial analysis or data-driven styling changes later, export a new AIX file and reconcile the graphic edits as needed.
4.2 Alternative: Export a vector PDF from ArcGIS Pro
PDF is a practical choice when you need a robust, portable document that can be opened in several graphic applications, including Illustrator and Inkscape.
Workflow
-
Open the map or layout.
-
Click Share → Export Map or Share → Export Layout.
-
Set the output format to PDF.
-
Choose the output location and filename.
-
Review the Properties and relevant export settings.
-
Export the file and inspect it before opening it in a vector editor.
Recommended ArcGIS Pro PDF settings
| Setting | Recommended choice | Reason |
|---|---|---|
| Output as image | Off | Avoids rasterizing all content |
| Compress vector graphics | Usually On | Reduces PDF size while maintaining vector geometry |
| Embed fonts | On, where licensing permits | Helps preserve font appearance across systems |
| Image compression | Adaptive or lossless compression for mixed content; JPEG for photographic content when appropriate | Balances visual quality and file size |
| Vector resolution | Usually 300 DPI as a print-layout starting point; increase only if the output requirements justify it | Controls effective vector resolution in the layout export |
| Raster resample | Start at full quality for master output; reduce only after checking quality | Controls the effective resolution of raster imagery |
| Layers and attributes | Enable if the PDF needs selectable layers or feature information | Adds navigable layer structure in compatible PDF readers |
| Simulate Overprint | Usually Off for an editable vector master unless required by the print workflow | Can rasterize vectors |
| Color profile | Embed when appropriate for a managed print workflow | Improves consistency between colour-managed systems |
The exact options available depend on the ArcGIS Pro version and whether you are exporting a map or layout. See ArcGIS Pro PDF export settings.
Important: Turning on Layers and Attributes creates useful PDF layer information, but it does not guarantee that Illustrator will recreate the same grouping and editability as an AIX file.
If the map contains dense vector geometry, exporting every feature may generate a large PDF. Generalizing suitable display layers or using an AIX workflow may help reduce post-production complexity.
5. Step 3: Open and Clean Up the File in Illustrator or Inkscape
Once the export is complete, the objective is to refine the presentation without damaging the map’s meaning or visual hierarchy.
5.1 Open the file correctly
In Adobe Illustrator:
-
Open Illustrator.
-
Select File → Open and choose the PDF or SVG file.
-
For AIX, use the ArcGIS Maps for Adobe Creative Cloud extension as required.
-
Check the artboard or page size.
-
Inspect the Layers panel and identify the main map, labels, legend, and layout elements.
-
Save a working copy in AI format before editing.
For a PDF, Illustrator may ask which page or page range to open. Select the intended page and confirm the cropping or page-box settings so that the full map layout is preserved.
In Inkscape:
-
Select File → Open and choose the SVG or PDF.
-
For PDF input, review the import options.
-
Inspect the page dimensions and object structure.
-
Save an editable SVG copy before making major changes.
SVG is a natural fit for Inkscape, while PDF often provides a convenient cross-application exchange format. Neither format guarantees that every effect or object will remain perfectly editable.
5.2 Understand grouping and clipping paths
Exported maps may contain hundreds or thousands of objects. GIS layers are often translated into groups, paths, compound paths, and clipping masks.
A clipping path controls which portion of an object is visible. It is frequently used to ensure that geographic features remain inside the map frame.
If you ungroup everything immediately, you may lose the organization needed to edit the map safely.
Recommended approach:
- Keep the exported master unchanged.
- Save an editable copy.
- Expand the Layers panel and inspect the object hierarchy.
- Rename or reorganize only the groups you need to edit.
- Ungroup selectively when a symbol or label is genuinely inaccessible.
- Retain clipping masks unless you intentionally need to edit geometry beyond the original map frame.
For example, if a road line extends beyond the map frame but is hidden by a clipping path, deleting the clipping mask may reveal geometry that was not intended to appear in the layout.
5.3 Edit fonts and labels carefully
When text is imported, fonts may be missing, text may become paths, or complex labels may be grouped unexpectedly.
To preserve typography:
- Install the required fonts where permitted.
- Use embedded fonts when the export format supports them.
- Avoid replacing fonts globally before checking the impact on label widths.
- Convert text to outlines only for elements whose visual appearance should be permanently fixed.
- Keep titles and important annotations as editable text when future revision is likely.
- Recheck label collisions after changing the font or size.
ArcGIS AIX can preserve many labels as editable text strings, while halos and text outlines may appear as separate paths. Complex placement rules may result in grouped characters. Esri discusses these behaviours in its AIX authoring best practices.
5.4 Polish styling without changing map meaning
Common post-production tasks include:
- Fine-tuning title alignment.
- Adjusting the spacing between legend classes.
- Refining line weights.
- Improving the consistency of font sizes.
- Aligning logos and source notes.
- Adjusting selected symbol colours.
- Removing unwanted visual clutter.
Avoid changing the thematic meaning of the map inadvertently. If colours represent standardized classes or graduated values, do not recolour individual polygons arbitrarily without updating the legend and ensuring the map’s interpretation remains correct.
5.5 Preserve scale integrity
A map layout’s scale bar corresponds to its map extent and physical size.
If you resize or crop the map frame in Illustrator, the original scale bar may no longer communicate the correct distance.
To avoid errors:
- Do not stretch the map independently of its scale bar.
- Keep the original GIS map frame dimensions when possible.
- If the map’s size or extent changes materially, return to GIS to regenerate the scale bar or carefully recalculate the design.
- Check any stated representative fraction or coordinate grid after resizing.
- Keep north arrows and inset maps associated with the correct map frame.
For thesis and journal figures, it is usually safer to make major changes to extent, projection, or scale in GIS and return to graphic software for typography and layout finishing.
6. Troubleshooting Common Export Problems
Problem 1: Text is clipped or missing
Possible causes: Font substitution, text boxes that are too small, unsupported text effects, or a mismatch between the original and exported text rendering.
Solutions:
- Inspect the export in a PDF viewer before opening it in the graphic editor.
- Confirm the correct font is installed.
- Enable font embedding when supported and permitted.
- Adjust the text box in GIS if the text is already clipped there.
- Export text as outlines only when necessary to preserve its appearance.
- Check special characters and non-Latin scripts carefully.
Do not assume that converting text to outlines fixes every text problem. If the original text was clipped during export, the outline may preserve the clipping.
Problem 2: The file is enormous or difficult to edit
Possible causes: Highly detailed geometries, too many vertices, oversized imagery, or unnecessary raster effects.
Solutions:
- Simplify geometry appropriate to the intended map scale.
- Remove hidden layers that do not need to be exported.
- Reduce the raster export resolution only when it remains appropriate for publication.
- Use lossless compression for master output and assess whether raster image compression can be reduced safely.
- Avoid exporting every intermediate layer.
- In QGIS, consider enabling Simplify geometries for complex features.
- In ArcGIS Pro, use display-appropriate generalization and inspect whether vector export complexity can be reduced.
A smaller file is not automatically better. Inspect the output at its final intended size before accepting a change that might remove important geographic detail.
Problem 3: Vector layers have become rasterized
Possible causes: The entire output was exported as an image, Print as raster was enabled, or certain blend modes, opacity settings, or rendering effects forced rasterization.
Solutions:
- In QGIS, check the layout’s Print as raster setting and review the Always export as vectors option.
- In ArcGIS Pro, make sure Output as image is not selected when vector editability is required.
- Review transparency, blend modes, and overprint settings.
- Test a simplified version of the layout to determine which layer or effect causes rasterization.
- Export a PDF or AIX again after adjusting the problematic settings.
Not every effect can be represented as native vector artwork. In some cases, selective rasterization is the most reliable way to preserve the visual result.
Problem 4: Transparent objects display unexpected boxes or seams
Possible causes: Clipping masks, transparency effects, or raster tiles that are rendered differently in another viewer.
Solutions:
- Open the exported PDF or SVG in more than one viewer to identify whether the issue is specific to the application.
- Inspect clipping paths in Illustrator or Inkscape.
- Review transparency and blend modes in the GIS project.
- In QGIS, consider enabling Disable tiled raster layer exports if visible seams appear, while noting that memory requirements may increase.
- In ArcGIS Pro, review the raster and transparency export settings.
Make corrections in the GIS source whenever the problem originates in the original map rendering rather than the graphic editor.
7. Summary: A Publication-Ready GIS Export Checklist
Before delivering your map, review the following checklist.
-
Layout dimensions: The page size, orientation, and map frame match the intended publication.
-
Vector preservation: The output has not been unintentionally flattened into a single raster image.
-
Text and fonts: Labels are legible, clipping has been checked, and text remains editable where required.
-
Compression and resolution: Raster imagery is sharp enough for the intended output without unnecessarily inflating the file.
-
Layer organization: Exported groups and objects are understandable and easy to edit.
-
Scale integrity: Any edits to the map frame preserve the meaning of the scale bar and map scale.
-
Visual quality: Colours, line weights, symbols, legends, and layout elements remain consistent with the GIS source.
-
Final verification: The exported PDF, SVG, or AIX has been reopened and checked before delivery.
Conclusion
Exporting publication-ready maps from QGIS or ArcGIS Pro requires more than choosing a file extension. It involves preparing a clean layout, selecting settings that preserve vector content, handling fonts and raster effects appropriately, and refining the map without compromising geographic meaning.
For QGIS users, vector PDF and SVG are practical formats for moving maps into Illustrator or Inkscape. For ArcGIS Pro users working in Illustrator, AIX is often the most convenient route when organized, editable artwork is a priority; vector PDF remains an excellent alternative for portable publication output. By mastering how to Export Vector PDF SVG GIS Adobe Illustrator, you ensure that your final cartographic products maintain both aesthetic appeal and precise geographic data integrity.
The best workflow separates geographic accuracy from graphic finishing: complete spatial analysis and scale-dependent cartographic decisions in GIS, then use vector editing software for controlled visual refinement.
This approach creates maps that are not only attractive, but also technically sound, easier to revise, and suitable for academic theses, journal figures, conference posters, and professional cartographic deliverables.