
How to Delineate a Watershed in QGIS: 9 Best Steps
Delineating a watershed manually can be difficult when drainage networks are complex or terrain data is inconsistent. Learning how to delineate a watershed in QGIS provides a repeatable way to derive drainage areas directly from a Digital Elevation Model (DEM). The workflow uses terrain elevation to determine where water would theoretically flow, then identifies flow accumulation, extracts a stream network, and defines the upstream area contributing water to a selected outlet or pour point.
This approach is widely used in environmental science, hydrology, civil engineering, flood studies, catchment planning, and GIS-based hydrological modeling.
Important: A DEM-based watershed is a terrain-derived model. Its accuracy depends heavily on DEM resolution, vertical accuracy, preprocessing, coordinate system, and the quality of the selected outlet.
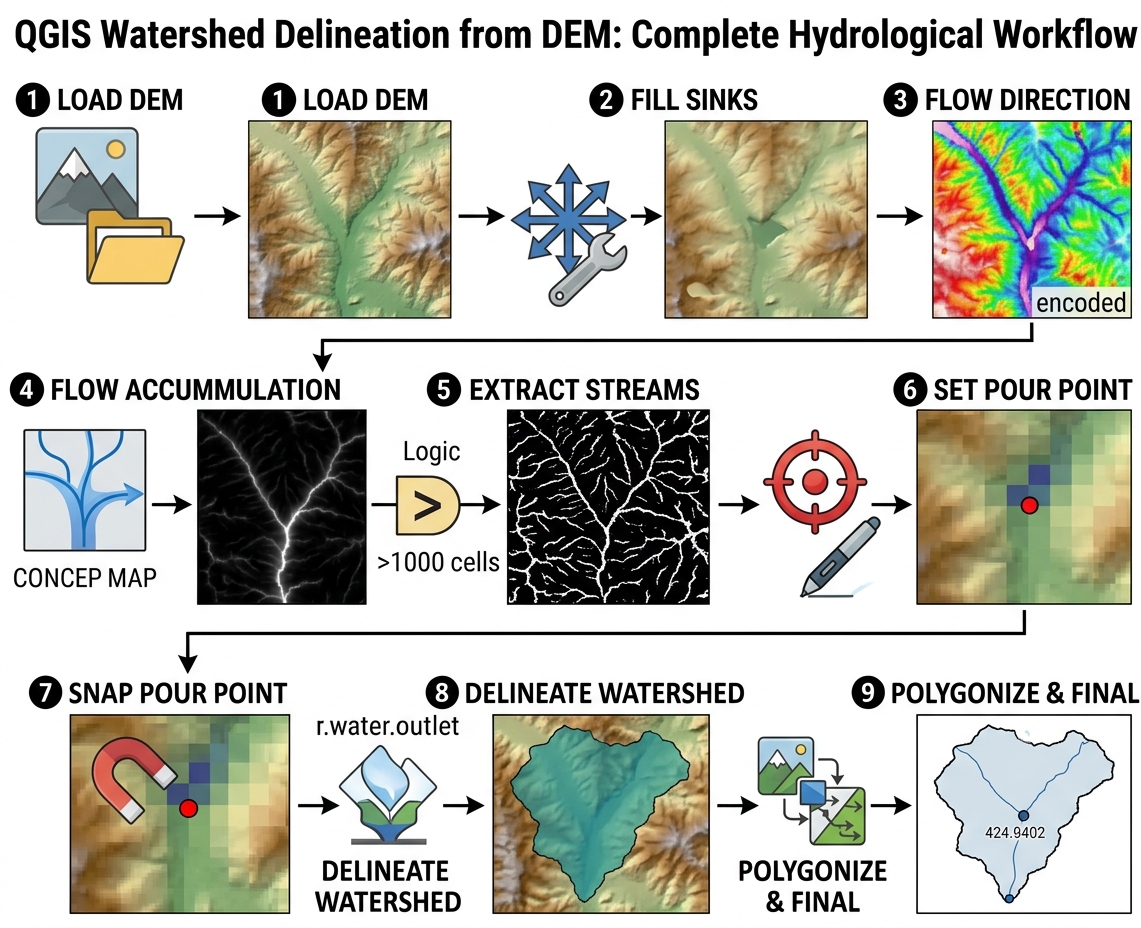
1. Understand the DEM-Based Watershed Workflow
A watershed, or catchment, is the area from which surface runoff drains toward a common outlet.
The basic GIS workflow is:
DEM
 ↓
Fill sinks
 ↓
Hydrologically corrected DEM
 ↓
Flow direction
 ↓
Flow accumulation
 ↓
Stream network
 ↓
Pour point
 ↓
Watershed boundary
Each step depends on the previous one.
For example, if the DEM contains an artificial depression, the flow-direction raster may incorrectly terminate water inside that depression when learning how to delineate a watershed in qgis.
2. Prepare Your DEM
Before starting the hydrological analysis, inspect the DEM carefully.
Your DEM should ideally:
- Cover the entire area of interest.
- Have consistent elevation units.
- Have a defined CRS.
- Have appropriate spatial resolution.
- Be free from obvious data gaps.
- Use a coordinate system suitable for your analysis.
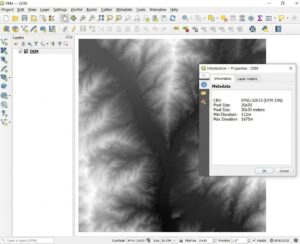
Open the DEM’s properties and inspect:
- CRS
- Pixel size
- Minimum elevation
- Maximum elevation
- NoData values
- Raster extent
Why DEM Resolution Matters
A 30 m DEM and a 10 m DEM can produce different drainage patterns.
A coarse DEM may smooth:
- Small valleys
- Narrow channels
- Small ridges
- Road embankments
- Drainage structures
A high-resolution DEM can represent terrain more precisely, but it may also contain more small-scale surface irregularities.
Therefore, do not assume that a finer DEM automatically produces a more hydrologically accurate watershed.
Step 1: Fill DEM Sinks
A sink is a depression in a DEM from which the modeled flow cannot escape.
Some depressions represent real terrain.
Others are artifacts caused by:
- Measurement errors
- Interpolation
- Raster resolution
- Data processing
- Missing elevation information
For basic watershed delineation, artificial sinks commonly need to be corrected.
3.1 Use Fill Sinks in QGIS
QGIS provides several hydrological processing options depending on the installed providers and version.
A commonly used approach is the Wang & Liu sink-filling algorithm.
Open:
Processing Toolbox → SAGA → Terrain Analysis – Hydrology → Fill Sinks (Wang & Liu)
The exact menu name can vary between QGIS/SAGA versions.
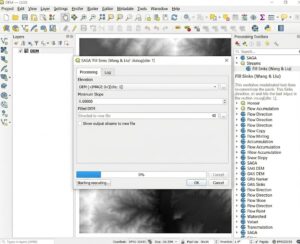
Set:
Elevation:
DEM

Minimum slope:
Appropriate value for your dataset

Output:
Filled_DEM
Run the tool.
3.2 Understand the Filled DEM
The resulting raster should preserve the broad terrain structure while removing problematic artificial depressions.
Conceptually:
Original DEM

      /\
     /  \
____/    \____
        \__
           \__
             ↑
           sink


Filled DEM

      /\
     /  \
____/    \________
              \
               \
The objective is not to flatten the landscape.
It is to create a terrain surface in which modeled water can move downstream rather than becoming trapped by artificial depressions.
Step 2: Calculate Flow Direction
Once the DEM has been hydrologically corrected, calculate flow direction.
Flow direction determines the direction water would travel from each raster cell toward neighboring cells.
A common approach uses the D8 algorithm, in which flow from a cell is assigned toward one of its surrounding neighboring cells.
Conceptually:
↖  ↑  ↗
←  ●  →
↙  ↓  ↘
The central cell ● can direct modeled flow toward one of its surrounding cells.
4.1 Calculate Flow Direction
Depending on your QGIS processing provider, use an appropriate flow-direction algorithm.
For example, a GRASS-based workflow can use:
r.watershed
or another hydrological flow-direction tool available in your QGIS installation.
[Insert Screenshot of Flow Direction Tool Settings]
Input:
Filled_DEMOutput:
Flow_DirectionThe exact encoding of flow-direction values depends on the algorithm used, so don’t assume that the numeric values have the same meaning across different tools.
Step 3: Calculate Flow Accumulation
Flow accumulation estimates how much upslope drainage contributes to each cell.
In simple terms:
Flow accumulation identifies where water from many upstream cells converges.
Low values generally occur on:
- Ridges
- Hillsides
- Local drainage divides
High values generally occur along:
- Valleys
- Drainage channels
- Major flow paths
[Insert Screenshot of Flow Accumulation Raster in QGIS]
A conceptual flow-accumulation surface might look like:
Low accumulation
       ↓

 .  .  .  .  .
  .  .  .  .
   .  .  .
    .  .
     █
     █
    ███
   █████
  ███████

       ↑
High accumulation
The exact appearance depends on the DEM and visualization settings.
5.1 Calculate Flow Accumulation
Using a suitable hydrological processing tool, provide the corrected DEM or the required flow-direction input.
For a GRASS-based workflow, r.watershed can calculate accumulation alongside other hydrological outputs.
Example conceptual setup:
Elevation:
Filled_DEM

Accumulation:
Flow_Accumulation[Insert Screenshot of Flow Accumulation Settings]
Step 4: Extract the Stream Network
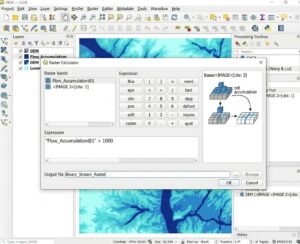
Once you have the flow accumulation raster, you can define a threshold above which cells are considered part of the drainage network.
This is where the accumulation threshold becomes important.
For example, suppose:
Flow accumulation > 1,000 cellsis selected as the stream threshold.
Cells exceeding that value become candidate stream cells.
6.1 Use Raster Calculator
Open:
Raster → Raster Calculator
Create a binary stream raster using an expression such as:
"Flow_Accumulation@1" > 1000The exact raster layer name will depend on your project.
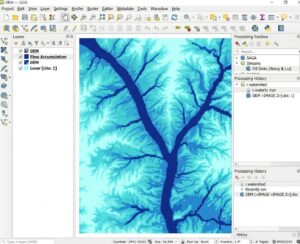
The resulting raster contains approximately:
1 = stream cells
0 = non-stream cells
Depending on your raster calculation settings, NoData values may also occur.
Choosing an Accumulation Threshold
The threshold controls how dense your extracted stream network becomes.
Low threshold
Accumulation > 100May produce:
- Many small tributaries
- Dense drainage networks
- More minor channels
High threshold
Accumulation > 10,000May produce:
- Fewer streams
- Only major drainage channels
- A simplified network
There is no universal threshold that works for every DEM.
The appropriate value depends on:
- DEM resolution
- Terrain
- Study-area size
- Research objective
- Expected drainage density
- Known stream locations
Step 5: Convert the Stream Raster to Vector
If your assignment requires a vector stream network, convert the binary stream raster into vector features.
You can use a raster-to-vector conversion tool such as:
Raster → Conversion → Polygonize
However, polygonizing a stream raster produces polygons rather than centerline streams.
For a true stream network, use a hydrological stream-extraction or raster-to-vector line workflow appropriate to your processing provider.
The resulting network can then be compared with:
- Existing hydrographic datasets
- Topographic maps
- Satellite imagery
- Field observations
Step 6: Define the Pour Point
The pour point is the location where water exits the watershed.
Examples include:
- A river gauge
- A dam
- A bridge
- A stream outlet
- A catchment monitoring station
- The downstream end of a study area
Conceptually:
             Ridge
          /        \
        /            \
       /              \
      ↓                ↓
     \                  /
      \                /
       \              /
        \            /
         \          /
          \        /
           \      /
            \    /
             \  /
              ●
          Pour Point
Everything upstream that drains toward this point belongs to the delineated watershed.
Step 7: Snap the Pour Point to the Drainage Network
This is a critical step.
Your manually placed point may be slightly away from the highest-accumulation cell.
For example:
Stream:
────────────████████──────

Manual point:
             ●

Correct stream cell:
               █
A watershed algorithm may fail to identify the intended drainage area if the point is not located on an appropriate flow path.
Use a snap pour point operation where available.
The tool moves the outlet to the highest accumulation cell within a specified search distance.
[Insert Screenshot of Snap Pour Point Settings]
Typical inputs include:
Pour point:
Outlet_Point

Flow accumulation:
Flow_Accumulation

Snap distance:
Appropriate search radius

Output:
Snapped_Pour_Point
The search distance should be based on the positional uncertainty of the outlet and the resolution of your DEM—not chosen arbitrarily.
Step 8:How to Delineate a Watershed in QGIS
Once you have:
- A corrected DEM
- Flow direction
- Flow accumulation
- A valid pour point
you can delineate the watershed.
Several QGIS/GRASS workflows can perform this operation.
For example, GRASS provides watershed-related tools such as:
r.water.outlet
which uses flow-direction information and an outlet location to identify the contributing drainage area.
[Insert Screenshot of Watershed Delineation Tool Settings]
Conceptually:
Flow Direction
       +
Snapped Pour Point
       ↓
Watershed Algorithm
       ↓
Watershed Raster
The output identifies the cells that contribute flow toward the selected outlet.
Step 9: Convert the Watershed to a Polygon
The watershed may initially be represented as a raster.
For many university assignments, you may want a polygon boundary.
Use an appropriate raster-to-vector conversion tool.
For example:
Raster → Conversion → Polygonize
[Insert Screenshot of Watershed Raster-to-Polygon Conversion]
You can then:
- Select the watershed polygon.
- Remove unwanted polygons.
- Dissolve if necessary.
- Calculate its area.
- Add appropriate metadata.
Your final product might look like:
          Watershed Boundary
       ╭────────────────────╮
      /                      \
     /     Upper Catchment    \
    /                          \
   |          ↓ ↓              |
   |        ↓     ↓            |
   |      ↓         ↓          |
   |        \       /          |
    \         \   /           /
     \          \ /          /
      \          ●          /
       ╰─────────┬──────────╯
                 ↓
            Pour Point
Troubleshooting How to Delineate a Watershed in QGIS
Problem 1: The Watershed Boundary Is Incomplete
If the resulting watershed looks too small or doesn’t reach the expected drainage divide, check the pour point first.
Possible causes
- Pour point is not located on the drainage network.
- Flow-direction raster is incorrect.
- DEM contains unresolved sinks.
- Wrong outlet coordinates were used.
- DEM does not cover the entire upstream area.
Fix
- Display flow accumulation.
- Display the stream network.
- Zoom into the outlet.
- Check the pour point.
- Snap the point to the drainage network.
- Re-run watershed delineation.
Problem 2: The DEM Contains Bad Sinks
Not every depression should necessarily be filled.
A real lake or closed basin may be genuine terrain.
Therefore, inspect suspicious depressions before aggressively modifying the DEM.
If artificial sinks are widespread:
Raw DEM
   ↓
Inspect sinks
   ↓
Fill appropriate sinks
   ↓
Recalculate flow direction
   ↓
Recalculate accumulation
   ↓
Redelineate watershed
Important: Do not calculate flow direction from the old DEM after generating a corrected DEM. The downstream processing should use the hydrologically corrected surface.
Problem 3: The Stream Network Is Too Dense
Your accumulation threshold may be too low.
For example:
Threshold = 100 cellscould create a very dense network.
Increase the threshold and compare the result:
100 cells
500 cells
1,000 cells
5,000 cells
Then compare the extracted network against known drainage features.
Problem 4: The Stream Network Is Too Sparse
The opposite problem occurs when the threshold is too high.
If only major rivers appear:
Threshold = 10,000 cellstry a lower threshold.
The goal is not simply to create the most visually attractive network. Select a threshold that is defensible for the study’s objective and DEM resolution.
Problem 5: The Watershed Is in the Wrong Location
Check your coordinate reference system.
A common problem is incorrectly defined or mismatched CRS information.
Verify:
- DEM CRS
- Pour-point CRS
- Reference stream CRS
- Project CRS
Also confirm that the datasets are actually spatially aligned rather than merely having similar-looking coordinate labels.
Problem 6: Flow Accumulation Looks Wrong
If accumulation doesn’t follow valleys, investigate the flow-direction calculation.
A typical dependency is:
DEM
 ↓
Sink correction
 ↓
Flow direction
 ↓
Flow accumulation
If the corrected DEM changes, you should recalculate downstream products rather than continuing to use outputs derived from the old surface.
Quality-Control Checklist
Before submitting a hydrological modeling assignment, check:
DEM
- Correct study area
- Appropriate resolution
- Correct CRS
- No unexpected NoData gaps
Sink correction
- Artificial sinks addressed
- Important natural depressions considered
Flow direction
- Derived from the corrected DEM
- Output inspected visually
Flow accumulation
- Follows expected valleys
- Threshold documented
Stream network
- Threshold justified
- Compared with known streams where possible
Pour point
- Correct outlet location
- Snapped to appropriate drainage cell
Watershed
- Boundary reaches expected drainage divide
- Outlet is correct
- Final polygon inspected
Quick Summary Table
| Process Step | Input Layer | Executed Tool | Output Layer |
|---|---|---|---|
| 1. Load DEM | Raw DEM | Add Raster Layer | DEM |
| 2. Fill sinks | DEM | Fill Sinks / Wang & Liu | Filled DEM |
| 3. Flow direction | Filled DEM | Flow Direction / hydrological tool | Flow Direction Raster |
| 4. Flow accumulation | Filled DEM / flow-direction workflow | Flow Accumulation / r.watershed |
Flow Accumulation Raster |
| 5. Extract streams | Flow Accumulation | Raster Calculator | Binary Stream Raster |
| 6. Define outlet | Reference map + drainage network | Add Point / digitizing | Pour Point |
| 7. Snap outlet | Pour Point + Flow Accumulation | Snap Pour Point | Snapped Pour Point |
| 8. Delineate watershed | Flow Direction + Pour Point | Watershed / r.water.outlet or equivalent |
Watershed Raster |
| 9. Create boundary | Watershed Raster | Polygonize / raster-to-vector tool | Watershed Polygon |
| 10. Finalize | Watershed Polygon | Dissolve/cleanup if required | Final Watershed Boundary |
Final Workflow at a Glance
The complete how to delineate a watershed in QGIS workflow can be remembered as:
             DEM
              ↓
       ┌─────────────┐
       │ Fill Sinks  │
       └──────┬──────┘
              ↓
          Filled DEM
              ↓
       Flow Direction
              ↓
       Flow Accumulation
              ↓
       Accumulation Threshold
              ↓
       Stream Network
              ↓
        Select Outlet
              ↓
       Snap Pour Point
              ↓
       Watershed Tool
              ↓
      Watershed Raster
              ↓
          Polygonize
              ↓
    Final Watershed Boundary
The most important principle is that watershed delineation is a sequential hydrological workflow, not a single GIS operation. Errors introduced during DEM preprocessing can propagate through flow direction and accumulation into the final boundary. For that reason, students should inspect each intermediate layer—especially the filled DEM, flow accumulation raster, stream network, and snapped pour point—before moving to the next stage.
For a defensible assignment, document the DEM source and resolution, sink-filling method, flow-direction algorithm, accumulation threshold, pour-point location, CRS, and watershed delineation method. This turns a visually plausible watershed map into a reproducible GIS analysis.