
How to Use LiDAR Data in GIS: DEM, DSM & CHM
Introduction:What Is LiDAR Point Cloud Data and How to Use LiDAR Data in GIS
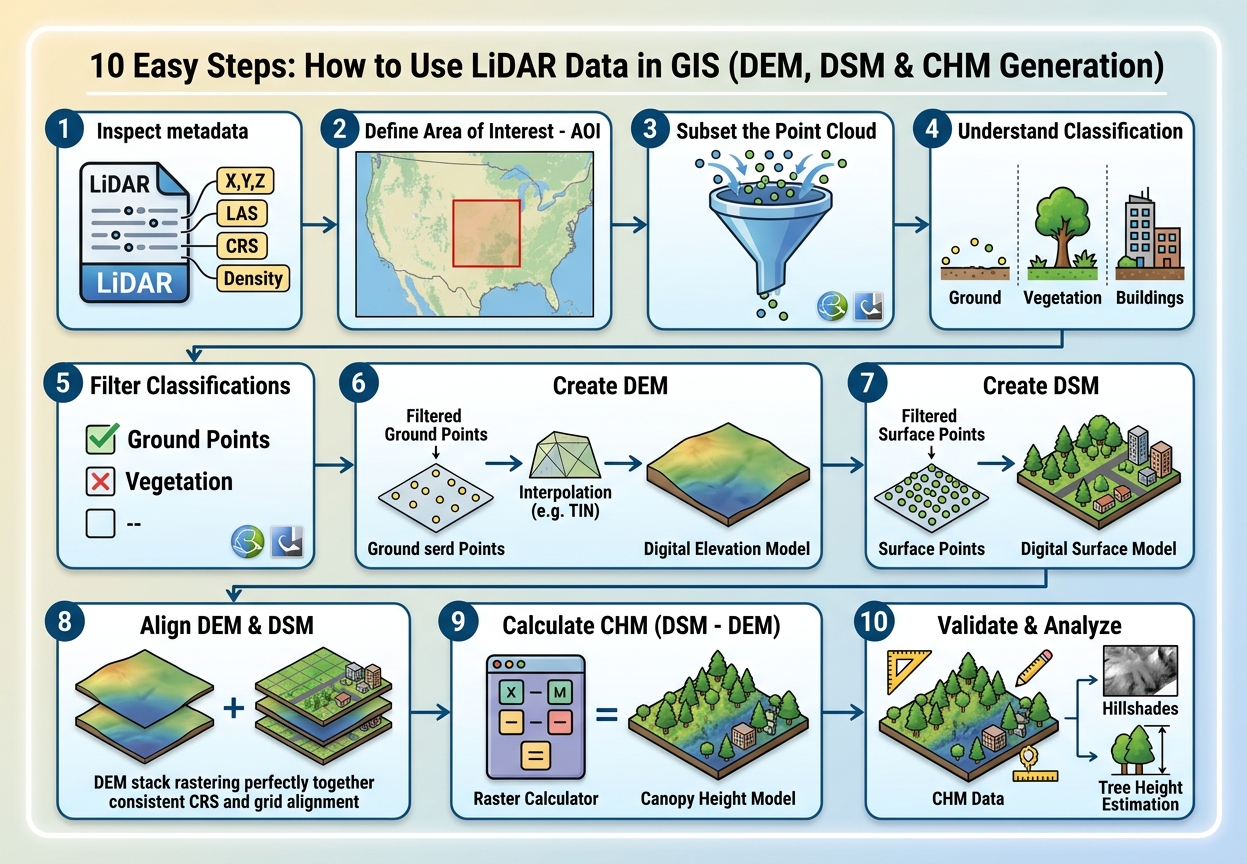
LiDAR data is a collection of millions of three-dimensional points captured by measuring the time it takes for laser pulses to travel from a sensor to the Earth’s surface and return. These points are commonly distributed in LAS or LAZ point-cloud files, which contain information such as X, Y, Z coordinates, return information, and point classification .In this step-by-step guide, we will cover how to use LiDAR data in GIS to generate DEM, DSM, and CHM rasters.
LiDAR is particularly valuable in GIS because it can capture detailed information about terrain, buildings, vegetation, and other objects above the ground. From the same point cloud, analysts can produce products such as a Digital Elevation Model (DEM), Digital Surface Model (DSM), and Canopy Height Model (CHM).
However, learning how to use LiDAR data in GIS introduces a common problem for students: LiDAR files can be extremely large. A single dataset can contain millions or even billions of points, making inefficient processing a frequent source of crashes, slow rendering, and failed remote sensing GIS assignment workflows.
The solution is not necessarily a more powerful computer. Good LiDAR processing begins with understanding point classifications, filtering, spatial resolution, and appropriate rasterization methods.
1.Understanding LiDAR Point Cloud Classification: How to Use LiDAR Data in GIS
Before creating a DEM or DSM, you need to understand what the individual points represent.
A LiDAR point cloud is not simply a collection of elevation measurements. Points can represent different objects depending on where the laser pulse was reflected.
Common LAS classification codes include:
| Classification | Typical meaning |
|---|---|
| 1 | Unclassified |
| 2 | Ground |
| 3 | Low vegetation |
| 4 | Medium vegetation |
| 5 | High vegetation |
| 6 | Building |
| 7 | Low point/noise |
| 8 | Model key point |
| 9 | Water |
| 17 | Bridge deck |
The exact classes available can vary depending on the LiDAR provider and processing specification, so always check the metadata accompanying your dataset.
Ground Points
Ground points are the most important points when creating a Digital Elevation Model.
Imagine a forested landscape:
        Trees
      /\/\/\/\/\
     /\/\/\/\/\/\
--------------------- Vegetation
       • • •
  •  •    •   •
_____________________ Ground
The ground-classified points represent the Earth’s terrain beneath vegetation and structures.
For a DEM, you generally want to work primarily with these points.
Vegetation Classes
Vegetation can be divided into several height categories.
Low vegetation
Examples include:
- Grass
- Small shrubs
- Crops
Medium vegetation
Examples include:
- Bushes
- Young trees
- Medium-height vegetation
High vegetation
Examples include:
- Mature trees
- Tall forest canopy
These classifications become particularly important when creating a Canopy Height Model.
Building Points
Building-classified points represent structures detected by the LiDAR classification process.
They are useful when creating a DSM because buildings are part of the surface visible to the sensor.
They may also be excluded when your analysis specifically requires vegetation or bare-earth elevation.
2. DEM vs DSM vs CHM
Three terms appear repeatedly when working with LiDAR:
DEM, DSM, and CHM.
Understanding their differences is essential before beginning your processing workflow.
What Is a Digital Elevation Model?
A Digital Elevation Model (DEM) represents the elevation of the bare-earth or ground surface.
Ideally, buildings, trees, and other above-ground objects have been removed.
For example:
Trees          Buildings
  /\              /\
 /  \      []    /  \
/    \____[]____/    \
________________________
        Ground
The DEM attempts to represent the line underneath the objects.
Ground-classified LiDAR points are therefore commonly used to generate a DEM.
Common DEM applications
DEM data can support:
- Slope analysis
- Aspect analysis
- Watershed delineation
- Flood modeling
- Drainage analysis
- Contour generation
- Terrain visualization
- Road planning
What Is a Digital Surface Model?
A Digital Surface Model (DSM) represents the elevation of the upper surface, including objects such as:
- Trees
- Buildings
- Bridges
- Other structures
Conceptually:
       Tree              Building
        /\                  ___
       /  \                |   |
______/    \_______________|   |____
The DSM therefore represents the top of features, rather than only the underlying terrain.
Depending on the dataset and processing method, DSM creation may use first returns or an appropriately filtered collection of non-ground points.
What Is a Canopy Height Model?
A Canopy Height Model (CHM) estimates vegetation height above the ground.
A common approach is:
CHM=DSM−DEMCHM = DSM – DEM
For example:
DSM elevation = 145 m
DEM elevation = 120 m

CHM = 145 - 120
CHM = 25 m
The result indicates that the feature’s surface is approximately 25 metres above the ground.
The concept is particularly useful for forestry.
A CHM can help identify:
- Tree height
- Canopy structure
- Forest gaps
- Vegetation density
- Forest disturbance
- Individual tree characteristics
However, interpretation depends on how the DSM and DEM were generated and how well the underlying point cloud represents the vegetation.
3. Step-by-Step LiDAR Processing Workflow
A typical LAS LAZ point cloud QGIS workflow looks like this:
Inspect metadata → Load point cloud → Filter classifications → Create DEM → Create DSM → Calculate CHM → Inspect/validate results
Let’s walk through each stage.
Step 1: Inspect the LiDAR Dataset
Before importing a huge file into your GIS project, examine its metadata.When learning how to use LiDAR data in GIS, always check your dataset metadata first.
Look for:
- File format
- Number of points
- Point density
- Coordinate reference system
- Elevation units
- Classification information
- Point spacing
- Geographic extent
- Acquisition date
- Vertical datum, if available
This information helps determine what the dataset can realistically be used for.
For example, a dataset with high point density can support detailed terrain modeling, while a sparse dataset may require a coarser output resolution.
Step 2: Avoid Loading the Entire Dataset Unnecessarily
A common beginner mistake is opening a massive LiDAR file and immediately attempting to visualize or process every point.
If the dataset covers a large region, first define your Area of Interest (AOI).
For a university assignment, you may only need a few square kilometres.
Instead of processing:
Entire county
↓
Hundreds of millions of points
work with:
Study area
↓
AOI subset
↓
Relevant point classes
↓
Raster product
This can dramatically reduce processing requirements.
Step 3: Loading LAS/LAZ in QGIS
Modern QGIS versions can work with point-cloud data through native point-cloud support and appropriate providers.
A typical workflow is:
- Open QGIS.
- Use Layer → Add Layer → Add Point Cloud Layer.
- Browse to your
.lasor.lazfile. - Add the layer.
- Inspect the point cloud visually.
- Check the layer properties and CRS.
LAZ files are compressed versions of LAS data and are often preferable when storage space is limited.
If your computer struggles
Do not immediately assume the data is corrupt.
Try:
- Working with a smaller AOI.
- Using a spatial subset.
- Processing only required classifications.
- Reducing display density.
- Creating raster derivatives rather than repeatedly rendering the full point cloud.
The key principle is:
Don’t process more points than your assignment requires.
Step 4: Loading LiDAR into ArcGIS Pro
ArcGIS Pro can also work with LAS/LAZ data through its LAS and point-cloud workflows.
A typical workflow involves:
- Open ArcGIS Pro.
- Create or open your project.
- Add the LAS/LAZ data or create a LAS dataset where appropriate.
- Inspect the point cloud.
- Examine point classifications.
- Define the processing extent.
- Use the appropriate LAS/raster conversion tools to generate elevation surfaces.
For larger projects, working through a LAS dataset can help organize multiple LiDAR files rather than treating every file independently.
Step 5: Filter Points by Classification
This is where the point cloud becomes useful for modeling.
Creating a DEM
For a basic bare-earth DEM:
Select ground points.
Conceptually:
LAS/LAZ
   ↓
Classification filter
   ↓
Ground (Class 2)
   ↓
Interpolation
   ↓
DEM
This removes trees and buildings from the terrain model as long as the classification is accurate.
Creating a DSM
For a DSM, you want points representing the surface features.
Depending on the dataset and desired methodology, this can include:
- Vegetation
- Buildings
- Other above-ground features
A simplified workflow is:
LAS/LAZ
   ↓
Surface/non-ground points
   ↓
Rasterization/interpolation
   ↓
DSM
Be careful with the phrase “first return = DSM.” First returns can be useful for representing elevated surfaces, but they are not automatically equivalent to a clean DSM. The correct approach depends on the point-cloud characteristics and the software workflow being used.
Step 6: Interpolate the Point Cloud into a Raster
A point cloud consists of discrete points.
A DEM or DSM is normally represented as a continuous raster surface.
You therefore need a method to transform point elevations into raster cells.
Two commonly encountered approaches are IDW and TIN. Interpolation is a crucial step when you learn how to use LiDAR data in GIS applications.
IDW Interpolation
A Triangulated Irregular Network (TIN) represents the su
Inverse Distance Weighted (IDW) estimates the value of an unknown location based on nearby known points.
The basic idea is:
Nearby points have greater influence than distant points.
For example, if a raster cell is surrounded by several LiDAR points, the closest points contribute more strongly to the estimated elevation.
IDW can be useful for relatively straightforward surfaces, but its suitability depends on point distribution and terrain characteristics.
TIN Interpolationrface using interconnected triangles.
Conceptually:
     •---------•
      \       / \
       \     /   \
        \   /     •
         \ /
          •
Each triangle describes part of the surface.
TINs can preserve terrain structure effectively, particularly where the input points are unevenly distributed.
For LiDAR processing, however, the most appropriate interpolation/rasterization method depends on your software, point density, terrain, required accuracy, and assignment methodology. Some LiDAR-specific tools use methods beyond simple IDW or TIN.
Step 7: Choose an Appropriate Raster Resolution
One of the most important decisions in Digital Elevation Model creation is choosing the output cell size.
Suppose your LiDAR data has an average point spacing of approximately 1 metre.
You might produce:
1 m DEMBut that does not automatically mean a 1 m DEM is the correct choice for every assignment.
A very fine raster:
- Contains more cells
- Requires more storage
- Takes longer to process
- May expose noise
- Can exceed what the data density supports
A very coarse raster:
- Processes faster
- Uses less storage
- May smooth important terrain features
- Can lose detail
Choose a resolution based on:
- Point density
- Intended analysis
- Study-area size
- Required accuracy
- Computing resources
Your methodology should explain why you selected the chosen resolution.
Step 8: Create the DEM
The simplified DEM workflow is:
Ground-classified points
          ↓
Filter
          ↓
Interpolate/rasterize elevation
          ↓
DEM
After creating the DEM, inspect it visually.
You can derive:
- Hillshade
- Slope
- Aspect
- Contours
- Flow direction
- Flow accumulation
These derivatives are useful for terrain and hydrological analysis.
Step 9: Create the DSM
The DSM workflow is similar:
Surface points
      ↓
Filter/select appropriate returns
      ↓
Rasterize/interpolate
      ↓
DSM
Inspect the resulting surface.
Trees should appear as elevated features, while buildings should also be visible where the point cloud captures them.
Step 10: Create the Canopy Height Model
Once the DEM and DSM have been created and aligned, calculate:
CHM=DSM−DEMCHM = DSM – DEM
In a raster calculator, the conceptual operation is:
DSM - DEMFor example:
| Location | DSM | DEM | CHM |
|---|---|---|---|
| Forest A | 142 m | 118 m | 24 m |
| Forest B | 136 m | 120 m | 16 m |
| Open ground | 121 m | 120 m | 1 m |
Areas where DSM and DEM are nearly equal represent surfaces close to ground level.
Areas with large differences indicate elevated features.
4. Troubleshooting Common LiDAR Problems
Problem 1: The LAS/LAZ File Is Too Large
This is probably the most common student problem.
Symptoms include:
- QGIS becomes unresponsive.
- ArcGIS Pro takes a long time to draw.
- Processing appears frozen.
- Your computer runs out of memory.
- Raster generation takes excessively long.
Solution
Reduce the workload.
Use:
- An AOI
- Classification filtering
- Spatial subsets
- Appropriate raster resolution
- Smaller processing tiles
If your assignment covers a 5 km² study area, there is little reason to process hundreds of square kilometres of LiDAR data.
Problem 2: Your Point Cloud Has Few or No Classified Points
You may open a dataset and discover that most points are classified as Unclassified (Class 1).
This creates a problem if your workflow specifically requires ground points.
For example:
Required:
Class 2 = Ground

Available:
Class 1 = Unclassified
Simply filtering for Class 2 could therefore produce an empty or incomplete dataset.
Solution
Check the metadata and dataset documentation.
Determine whether:
- The dataset genuinely has no classification.
- Classification exists but uses a different scheme.
- The software is interpreting the classification incorrectly.
- Ground classification needs to be performed separately.
Do not arbitrarily assume that Class 1 means ground.
Problem 3: DEM Contains Trees and Buildings
If your supposed bare-earth DEM contains obvious buildings or tree elevations, your input filtering is probably incorrect.
Check:
- Point classification
- Ground filtering
- Interpolation settings
- Outliers
- NoData areas
A DEM should represent the terrain rather than the tops of trees and buildings.
Problem 4: CHM Contains Negative Values
A CHM is commonly calculated as:
DSM - DEMYou may occasionally find negative values.
Possible causes include:
- DEM and DSM generated using inconsistent methods
- Misalignment
- Different vertical references
- Interpolation artifacts
- Classification errors
- Noise
Do not automatically delete negative values without investigating why they occurred.
Problem 5: DEM and DSM Don’t Line Up
Before calculating:
DSM - DEMboth rasters need compatible:
- CRS
- Cell size
- Extent
- Grid alignment
Otherwise, raster subtraction can produce incorrect results or require resampling.
LiDAR Applications in Remote Sensing and GIS
LiDAR is useful far beyond simply producing an elevation map.
Forestry
A CHM can support:
- Tree-height estimation
- Canopy structure analysis
- Forest inventory
- Biomass estimation
- Forest disturbance mapping
- Individual-tree detection
For example, a forest manager could use a CHM to identify areas containing unusually tall or dense vegetation.
Flood Risk Modeling
A high-resolution DEM can provide detailed information about terrain elevation.
This can support:
- Drainage analysis
- Flow accumulation
- Watershed delineation
- Floodplain mapping
- Terrain-based flood modeling
Small changes in elevation can significantly affect modeled drainage pathways, particularly in relatively flat environments.
Urban Analysis
LiDAR-derived DSMs can also support:
- Building-height analysis
- 3D city modeling
- Urban morphology
- Visibility studies
- Solar potential analysis
A Practical LiDAR Workflow for a GIS Assignment
For an introductory remote sensing project, the entire workflow can be summarized as:
        LAS / LAZ
            ↓
     Inspect metadata
            ↓
       Define AOI
            ↓
      Filter points
       ↙          ↘
   Ground        Surface
     ↓               ↓
   DEM              DSM
      \              /
       \            /
        └── DSM-DEM ┘
              ↓
             CHM
              ↓
     Analysis + Mapping
Keep a record of every important processing decision:
| Processing stage | Record |
|---|---|
| Dataset | LAS/LAZ source |
| CRS | Horizontal/vertical reference |
| AOI | Study-area boundary |
| Filter | Point classifications/returns |
| DEM method | Interpolation/rasterization |
| DSM method | Interpolation/rasterization |
| Resolution | Cell size |
| CHM | DSM − DEM |
| Validation | Visual/quantitative checks |
This documentation can make the difference between simply producing a map and producing a defensible remote sensing GIS assignment.
Conclusion
Learning how to use LiDAR data in GIS starts with understanding that a point cloud contains much more information than a collection of elevation points.
The essential workflow is:
Inspect → subset → classify/filter → rasterize → validate → analyze.
Remember the fundamental distinction:
- DEM → ground/bare-earth elevation
- DSM → elevation of the surface, including above-ground features
- CHM → relative vegetation/object height, commonly calculated as DSM − DEM
For students, the biggest practical challenges are usually large LAS/LAZ files, unsuitable raster resolutions, inconsistent coordinate systems, and unclassified points. Handling these issues systematically makes LiDAR processing much more manageable.In this step-by-step guide, we will cover how to use LiDAR data in GIS to generate DEM, DSM, and CHM rasters.In this step-by-step guide, we will cover how to use LiDAR data in GIS to generate DEM, DSM, and CHM rasters.
Once you can turn a LiDAR point cloud into reliable DEM, DSM, and CHM products, you have a foundation for more advanced GIS and remote-sensing applications—including forest structure analysis, terrain modeling, flood-risk assessment, hydrology, urban analysis, and 3D environmental modeling.