
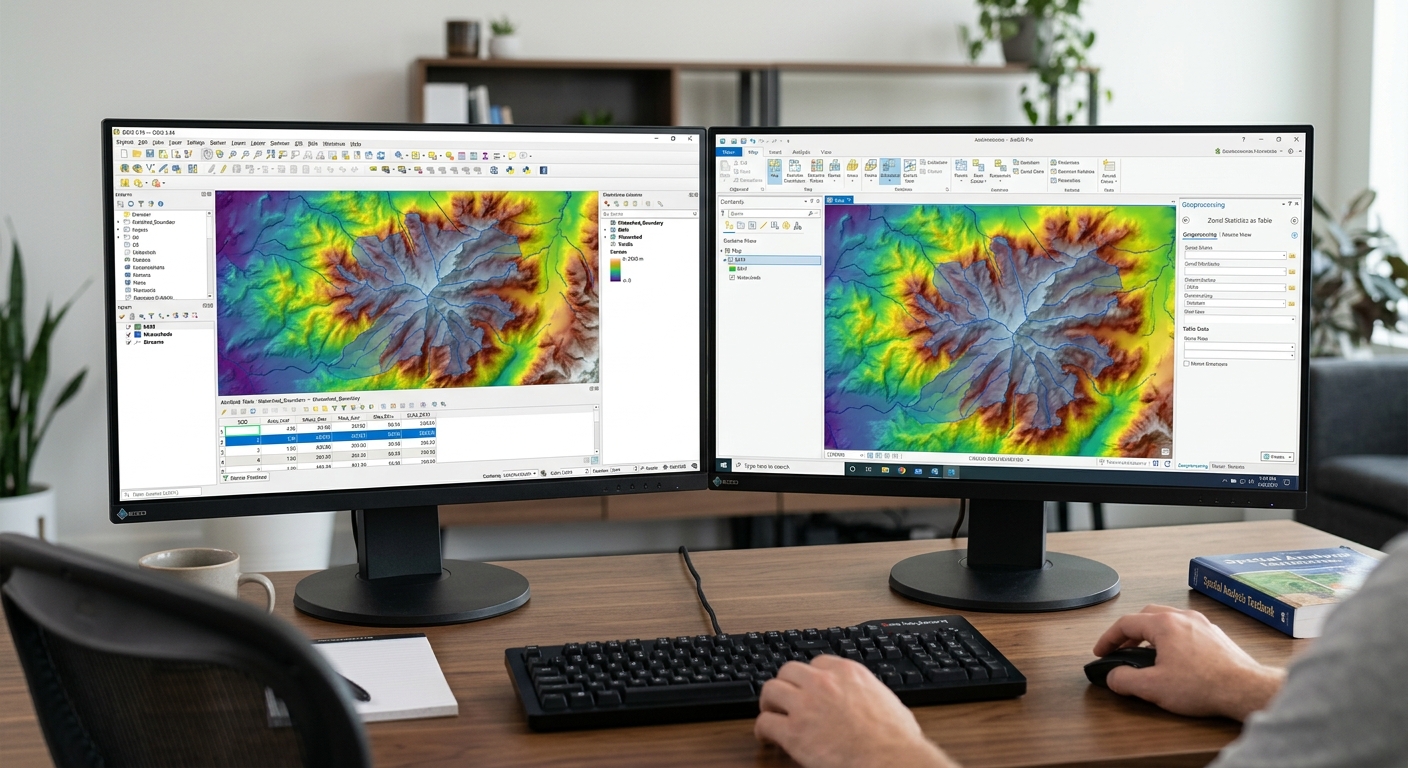
Zonal Statistics in GIS: 4 Steps to Extract Raster Data
When completing spatial analysis lab assignments using zonal statistics in GIS, university students frequently encounter a common challenge: summarizing continuous raster data (such as digital elevation models, precipitation surfaces, satellite vegetation indices, or land surface temperatures) across discrete vector polygon boundaries. Whether you need to calculate the average elevation per watershed basin, total rainfall per county, or dominant land cover type per urban planning district, performing zonal statistics GIS workflows is the core technique required.
Without zonal analysis, combining continuous pixel values with categorical vector boundaries requires tedious manual intersections or complex scripts. This step-by-step guide walks you through the fundamentals of zonal operations and demonstrates how to execute them in both QGIS and ArcGIS Pro.
1. Fundamentals of Zonal Statistics in GIS
At its core, a zonal statistic operation overlays a boundary dataset over a gridded raster dataset to calculate summary metrics for every overlapping region.
Core Terminology
-
Zone Layer (Vector or Raster): Defines the spatial boundaries used to group pixels. In most student lab assignments, this is a vector polygon layer (e.g., district boundaries, census tracts, or watersheds). Every zone must possess a unique identifier attribute (e.g.,
FID,GEOID, orZone_ID). -
Value Layer (Raster): The continuous or discrete raster dataset containing the numerical measurements you wish to summarize (e.g., elevation in meters, annual rainfall in millimeters, or NDVI value).
-
Output: Either new summary fields appended directly to the vector polygon attribute table or a standalone summary table linked via a primary key join.
Primary Statistic Types
| Statistic Type | Calculation Description | Common Lab Application |
| Mean | Average value of all cell centers falling within the zone. | Average slope or average temperature per county. |
| Sum | Total sum of all cell values multiplied by cell counts. | Total population count or total biomass estimation. |
| Median | Midpoint value of cell values within the zone boundary. | Skewed distribution analysis (e.g., household income rasters). |
| Majority (Mode) | The most frequently occurring pixel value in the zone. | Dominant land cover category (e.g., Forest vs. Urban). |
| Standard Deviation | Variability/dispersion of cell values around the mean. | Assessing elevation ruggedness or terrain heterogeneity. |
For detailed documentation on raster overlay algorithms and processing options, refer to the official QGIS Raster Analysis Documentation.
2. Step-by-Step Guide: Zonal Statistics GIS Workflow in QGIS
QGIS provides two primary methods for extracting raster data: the native Zonal Statistics algorithm and the standalone Raster Layer Zonal Statistics tool in the Processing Toolbox. When setting up your lab parameters, mastering zonal statistics in GIS ensures your calculated raster metrics align seamlessly with vector attribute tables.
Step 1: Load Layers and Verify Coordinate Reference Systems (CRS)
-
Open QGIS and load your vector polygon layer (Zones) and raster layer (Values).
-
Right-click each layer in the Layers Panel, select Properties > Information, and confirm both datasets share the exact same Projected Coordinate System (e.g., UTM Zone 18N).
Step 2: Open the Zonal Statistics Tool
-
Open the Processing Toolbox panel (Processing > Toolbox).
-
Expand Raster analysis and double-click Zonal statistics.
Step 3: Configure Parameters
-
Set Input layer to your polygon layer (e.g.,
Watersheds.shp). -
Set Raster layer to your value raster (e.g.,
DEM_Elevation.tif). -
Set an explicit Output column prefix (e.g.,
elev_orprecip_) to avoid confusing column names. -
Click the
...button under Statistics to calculate and select your desired metrics (Mean, Max, Min, Sum).
Step 4: Execute and Verify
-
Click Run.
-
Right-click your vector polygon layer and choose Open Attribute Table.
-
Scroll to the right side of the table to verify your newly created summary fields (e.g.,
elev_mean,elev_max). To modify or clean up resulting attribute columns, check our guide on[Internal Link Context: Suggest linking to related article on Attribute Table Operations].
3. Step-by-Step Guide: Zonal Statistics GIS Workflow in ArcGIS Pro
ArcGIS Pro offers robust tools under the Spatial Analyst extension for calculating summary statistics by zone. Executing zonal statistics in GIS via the geoprocessing pane allows spatial analysts to batch-process large environmental datasets efficiently.
Step 1: Activate Extension and Prepare Data
-
Launch ArcGIS Pro and add your polygon layer and raster dataset to your map scene.
-
Confirm that the Spatial Analyst extension is enabled (Project > Licensing > Esri Extensions).
Step 2: Open “Zonal Statistics as Table”
-
Open the Geoprocessing Pane (Analysis > Tools).
-
Search for Zonal Statistics as Table (Spatial Analyst Tools > Zonal).
Step 3: Populate Geoprocessing Parameters
-
Input Raster or Feature Zone Data: Select your polygon layer.
-
Zone Field: Select the unique identifier attribute field (e.g.,
OBJECTIDorDistrict_Name). -
Input Value Raster: Select your elevation, temperature, or precipitation raster.
-
Output Table: Specify your geodatabase destination table path.
-
Statistics Type: Select ALL, MEAN, MAJORITY, or desired metrics.
-
Process as Multidimensional: Uncheck unless working with netCDF time-series climate models.
Step 4: Join Output Table to Polygon Attribute Table
-
Click Run. The resulting standalone table appears in the Standalone Tables section of your Contents Pane.
-
Right-click your polygon layer in the Contents Pane and select Joins and Relates > Add Join.
-
Set Input Join Field to your zone ID (e.g.,
District_ID). -
Set Join Table to your newly created output statistics table and set Join Table Field to the corresponding zone ID.
-
Click OK to display the extracted raster metrics alongside your polygon features.
Pro Tip: Resolving Cell Boundaries & Preventing NULL Outputs
Two frequent pitfalls cause incorrect results orNULL/NaNvalues in student zonal analysis reports:
NULLvalues across all attributes. Always reproject both layers to a matching Projected Coordinate System prior to running zonal statistics.
4. Frequently Asked Questions (FAQ)
What is the difference between Zonal Statistics and Zonal Statistics as Table?
The standalone Zonal Statistics tool creates a new output raster where pixel values reflect summary metrics. Zonal Statistics as Table outputs a non-spatial attribute table summarizing pixel statistics per polygon zone ID without duplicating raster grids.
Why are my zonal statistics output fields showing NULL?
Outputs return
NULL when input layers use mismatched coordinate reference systems, when polygon zones fall entirely outside the spatial extent of the raster layer, or when polygon features are too narrow to cover raster cell center points.Can I calculate majority zonal statistics on floating-point rasters?
No. Statistics like Majority, Minority, and Variety require categorical integer rasters (e.g., land cover classes). Floating-point rasters (e.g., continuous elevation or temperature values) only support continuous metrics like Mean, Min, Max, and Standard Deviation.
5. Conclusion & Lab Summary
Calculating zonal statistics in GIS bridges the gap between raster grids and vector boundaries, enabling meaningful regional summaries for environmental modeling, planning, and civil engineering. By maintaining matching coordinate systems, choosing appropriate statistic types, and verifying cell boundary coverage, you can execute error-free spatial extractions for your academic assignments. Troubleshooting unexpected NULL outputs is a critical skill when applying zonal statistics in GIS to complex, real-world spatial datasets. When completing advanced projects, applying zonal statistics in GIS streamlines spatial modeling. Whether analyzing raster layers or vector zones, mastering zonal statistics in GIS ensures high accuracy, while troubleshooting errors keeps your zonal statistics in GIS workflow efficient.
Key Takeaways:
-
Ensure vector zone layers feature a unique identifier column before running calculations.
-
Use Mean or Sum for continuous data (DEMs, rainfall) and Majority for categorical data (land use).
-
Always reproject layers to a single projected coordinate system to avoid
NULLattribute errors.