
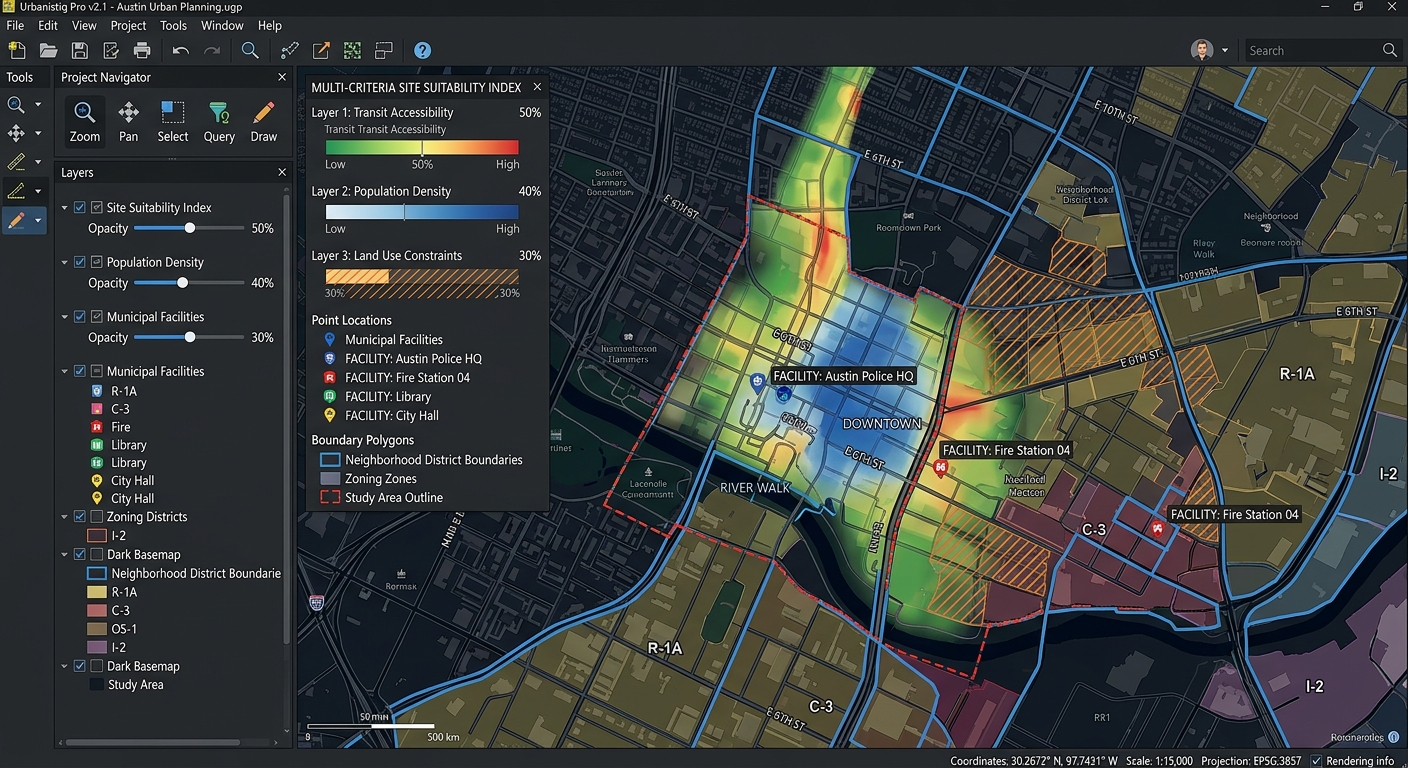
How to Write a GIS Methodology Section for Your University Dissertation or Thesis
Introduction: Why Your GIS Methodology Matters
How to Write a GIS Methodology Section for Your University Dissertation or Thesis involves much more than being judged solely by the quality of your maps or the sophistication of your spatial analysis. Examiners also need to understand how the research was conducted, why particular methods were selected, and whether the findings can be independently verified.
Writing a GIS methodology section for a dissertation or thesis involves documenting the complete process used to transform raw geographic data into meaningful analytical results. This includes identifying data sources, explaining preprocessing decisions, describing spatial analysis techniques, specifying software parameters, and evaluating potential sources of error.
A strong methodology section answers five fundamental questions:
- What data did you use? Identify datasets, sources, collection dates, spatial resolution, and coordinate reference systems.
- How did you prepare the data? Explain georeferencing, projection, clipping, cleaning, and other preprocessing operations.
- What analytical methods did you apply? Describe the spatial tools, equations, parameters, and decision rules used.
- Why were these methods appropriate? Justify the techniques in relation to your research objectives and questions.
- How reliable are the results? Discuss accuracy, uncertainty, sensitivity, and methodological limitations.
A well-organized methodology helps examiners assess the validity of your analytical process. It also supports reproducible GIS research by enabling other researchers to understand, repeat, and evaluate your workflow.
This guide explains five essential components of an effective GIS methodology, with practical examples, suggested subsections, and a submission checklist suitable for undergraduate and postgraduate research.
1. Data Acquisition and Metadata Inventory
The first component of an effective GIS methodology explains where your spatial data originated, what characteristics it possesses, and why it is appropriate for answering your research questions.
Simply stating that data was downloaded from an online GIS portal is insufficient. Readers need enough information to identify the source and understand the spatial and temporal characteristics of the data.
1.1 Identify every dataset
Begin by preparing a complete inventory of the datasets used in your analysis. Depending on your research, these might include satellite imagery, digital elevation models (DEMs), administrative boundaries, road networks, population statistics, land-use maps, or field-collected GPS points.
For every dataset, document:
- Dataset name: The official title or a clear descriptive name.
- Source: The organization, data portal, publication, or field survey from which it was obtained.
- Acquisition date: When you downloaded or collected the data.
- Data reference date: The period represented by the observations, which may differ from the download date.
- Spatial resolution or scale: For example, the pixel size of raster imagery or the nominal scale of a reference map.
- Coordinate reference system (CRS): The coordinate system and relevant EPSG code, when available.
- Data format: Such as GeoPackage, Shapefile, GeoTIFF, CSV, or GeoJSON.
- Relevant attributes: Important fields, measurement units, and classification categories.
- License or access conditions: Any restrictions relevant to using or distributing the data.
Distinguish spatial resolution from map scale. Raster resolution describes the ground area represented by a pixel, whereas cartographic scale describes the relationship between distances on a map and corresponding ground distances.
1.2 Create a metadata inventory table
A metadata table provides an organized summary of the datasets used in your study.
| Dataset | Source | Format | Spatial resolution or scale | CRS | Research use |
|---|---|---|---|---|---|
| Satellite imagery | Official imagery provider | GeoTIFF | 10 m pixels | Geographic or projected CRS | Land-cover classification |
| Administrative boundaries | Government mapping agency | GeoPackage | Vector boundaries | Projected CRS | Study-area delineation |
| Road network | Official transport data or OpenStreetMap | GeoPackage | Vector lines | Projected CRS | Accessibility analysis |
| Population data | National statistical agency | CSV or polygon dataset | Census reporting units | Depends on source | Population distribution |
| Digital elevation model | Elevation data provider | GeoTIFF | 30 m pixels | Projected or geographic CRS | Terrain analysis |
Note: This is an illustrative inventory. Replace the example sources, resolutions, and CRS information with verified details from your actual datasets.
1.3 Explain why the data is suitable
Listing datasets is only the first step. You should also justify their relevance to your research.
For example, a study examining urban expansion might use satellite imagery from two or more years to compare land-cover changes. A watershed study might use a DEM to derive flow direction, flow accumulation, and drainage boundaries.
Your explanation should connect the selected data to your research objectives. Consider temporal coverage, spatial detail, completeness, thematic relevance, and known limitations.
If you combine datasets from different years, explain whether their dates are sufficiently comparable for the analysis. If a dataset has limited spatial coverage or missing attributes, disclose this rather than implying that the data is complete.
1.4 Example methodology paragraph
The following example demonstrates how dataset selection can be reported academically. Replace the illustrative information with details verified for your study.
Spatial datasets were obtained from relevant governmental and open-data sources to support the assessment of land-use and land-cover change within the study area. Satellite imagery was selected based on its spatial resolution, temporal coverage, and suitability for distinguishing the land-cover categories under investigation. Administrative boundary data were used to define the study extent, while supplementary vector datasets provided contextual information for spatial analysis. The coordinate reference system, acquisition date, spatial resolution, and file format of each dataset were recorded in a metadata inventory to support data traceability and reproducibility.
The paragraph explains the reasoning behind the datasets. The accompanying inventory should provide the precise names, dates, resolutions, and sources.
2. Preprocessing and Data Cleaning Steps
Raw geographic data frequently requires preparation before it can be used in spatial analysis. Datasets may have different coordinate reference systems, inconsistent attribute structures, missing values, invalid geometries, or spatial extents that do not match the study area.
Your methodology should document these operations in the order they were performed and explain why each was necessary.
2.1 Coordinate reference system harmonization
Combining spatial datasets requires attention to their coordinate reference systems.
Geographic coordinates are commonly expressed in angular units, such as degrees, while projected coordinate systems may represent locations in meters or feet.
A projected CRS with appropriate properties is generally preferable for planar distance, area, and buffer calculations. However, the suitable CRS depends on the study region, spatial extent, measurement requirements, and intended level of accuracy.
In QGIS, you can use the Reproject Layer processing tool. In GeoPandas, you can use:
import geopandas as gpd

# Load an existing vector dataset
roads = gpd.read_file("roads.gpkg")

# Reproject to the selected local projected CRS
roads_projected = roads.to_crs("EPSG:XXXX")
Replace EPSG:XXXX with the appropriate CRS for your study area.
In your methodology, report both the original and final CRS. Explain why the selected projection is suitable for the measurements performed.
Important distinction: Reprojecting a dataset changes its coordinate values. Assigning a CRS label without transforming coordinates does not achieve the same result.
2.2 Georeferencing and spatial alignment
Georeferencing establishes the spatial position of data that lacks usable geographic coordinates, such as a scanned topographic map or historical paper map.
If you georeferenced a scanned map, document:
- The source and characteristics of the reference map.
- The coordinate reference system used.
- The number and distribution of ground control points (GCPs).
- The transformation method, such as a first-order polynomial or thin-plate spline, where appropriate.
- The resampling method used for raster data.
- The resulting root mean square error (RMSE), where provided and applicable.
- Any limitations caused by distortion, uncertain control points, or source-map quality.
For a raster dataset, nearest-neighbor resampling may be appropriate for preserving categorical class values, whereas bilinear or cubic resampling may be suitable for certain continuous variables. Selection should reflect the nature of the data and the analytical purpose.
Do not report a low georeferencing RMSE as conclusive proof of high positional accuracy. A transformation can fit its control points well while still containing substantial errors elsewhere.
2.3 Clipping and study-area extraction
Spatial datasets often extend beyond the area being investigated. Clipping restricts the analysis to the selected study boundary.
For example, you might clip a road network to a municipal boundary before calculating road density or accessibility.
Document:
- The boundary used to define the study area.
- The clipping operation applied.
- Whether features crossing the boundary were retained in full or geometrically clipped.
- How edge effects were handled.
- Whether additional surroundings were retained for analyses that require context beyond the study boundary.
This final consideration matters for distance and neighborhood analyses. Clipping immediately at the boundary may exclude nearby roads or facilities just outside the study area, producing misleading accessibility estimates for locations near the edge.
2.4 Missing data and attribute cleaning
Explain how incomplete or inconsistent records were handled.
Relevant procedures may include:
- Removing records with missing coordinates.
- Converting numeric fields stored as text into numerical values.
- Standardizing field names and category labels.
- Identifying duplicate records.
- Checking for invalid or empty geometries.
- Investigating extreme values or inconsistent measurement units.
- Documenting any imputation or exclusion of missing observations.
Do not assume that every missing value should be deleted. Explain why a record was removed, retained, or imputed and how that decision could affect the analysis.
For example, if 18 of 1,200 GPS points were excluded because their coordinates were missing, state the number removed, the reason for exclusion, and the final number of valid observations.
2.5 Document the complete preprocessing sequence
A clear sequence makes your workflow easier to understand and repeat.
| Stage | Operation | Purpose | Verification |
|---|---|---|---|
| 1 | Inspect input data | Identify formats, fields, and CRS | Review metadata and attribute tables |
| 2 | Clean attributes | Correct field inconsistencies and missing values | Check data types and missing-value counts |
| 3 | Validate geometry | Identify empty or invalid geometries | Run geometry validity checks |
| 4 | Reproject layers | Harmonize spatial reference systems | Verify CRS and map alignment |
| 5 | Clip to study area | Define the analysis extent | Inspect the resulting extent |
| 6 | Prepare analysis inputs | Apply final selection or classification rules | Compare counts and summary statistics |
Only include operations you actually performed. A methodology must report the research process, not an idealized workflow that was never implemented.
3. Analytical Framework and Workflow Diagram
The analytical framework explains how the research moves from its objectives and input data to its final outputs.
This is a central component of a strong academic GIS methodology structure because it helps readers understand the relationships between processing stages and the logic behind the selected methods.
3.1 Begin with the research questions
Identify the analytical tasks required to answer each research question.
For example, a study investigating the suitability of locations for a new health facility may ask:
- Which residential areas are underserved by existing facilities?
- How does population density vary across the study region?
- Which areas satisfy the selected accessibility and land-suitability criteria?
These questions determine the analytical framework.
Possible GIS operations include population-density mapping, service-area or distance analysis, multi-criteria evaluation, and overlay of suitable locations.
Do not select tools simply because they are available in GIS software. Explain their relationship to the research questions and the assumptions they introduce.
3.2 Develop a conceptual workflow diagram
A workflow diagram should show the sequence of data preparation, analysis, and output production.
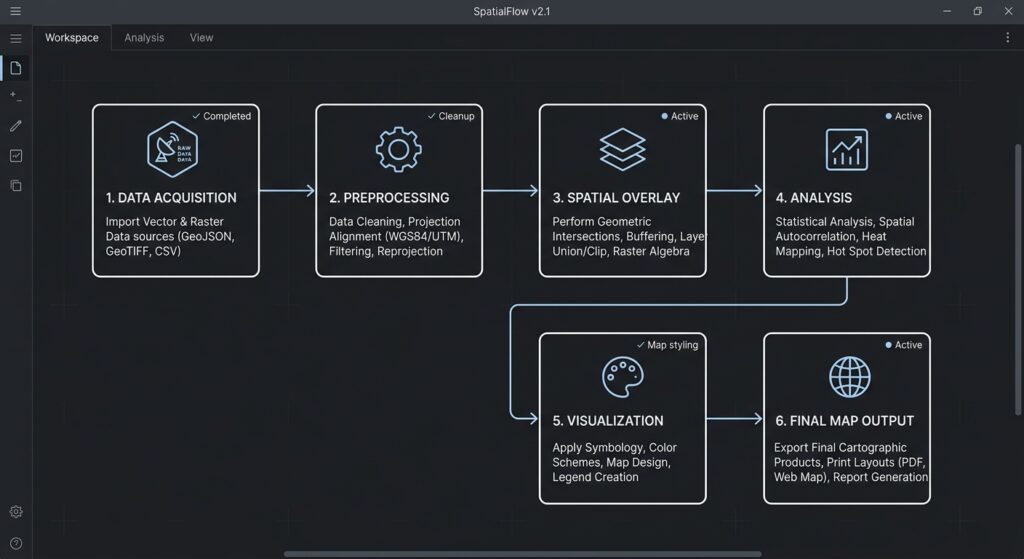
For example:
Research objectives
        |
        v
Data acquisition
        |
        v
Metadata and quality assessment
        |
        v
Preprocessing and data cleaning
        |
        v
CRS harmonization
        |
        v
Spatial analysis
   /           \
  v             v
Distance      Population
analysis      analysis
   \           /
        v
   Spatial overlay
        |
        v
Validation and uncertainty assessment
        |
        v
Maps, tables, and interpretation
This is an illustrative framework. Adapt it to the actual operations and dependencies of your project.
A good workflow diagram should:
- Use consistent symbols and directional arrows.
- Identify the principal datasets entering each stage.
- Distinguish data preparation from analytical operations.
- Show where independent datasets or branches are combined.
- Identify important outputs.
- Avoid unnecessary technical detail that belongs in the written methodology.
Figures should have a number and descriptive caption, such as Figure 3.1: Workflow for spatial analysis of healthcare accessibility. Refer to the figure in the text rather than inserting it without explanation.
3.3 Explain your conceptual model
A workflow diagram shows what happens. The conceptual model explains why the analysis is structured that way.
For a suitability assessment, you may need to justify the criteria, their weights, exclusion rules, and the method of combining them.
For a flood-risk assessment, explain the relationship between elevation, drainage characteristics, rainfall inputs, and the selected flood-related indicators. Clarify whether the analysis is a terrain-based screening exercise or a hydrological model calibrated against observations.
This distinction prevents readers from interpreting a preliminary spatial screening result as a complete simulation of a real-world process.
3.4 Link each method to an objective
A useful methodological table connects the questions, operations, and outputs.
| Research objective | Analytical method | Expected output |
|---|---|---|
| Identify accessible health facilities | Distance or network-based accessibility analysis | Accessibility measures |
| Examine land-cover change | Multi-date image classification and change detection | Land-cover maps and change statistics |
| Identify suitable development areas | Multi-criteria evaluation and spatial overlay | Suitability map |
| Investigate spatial clustering | Global or local spatial autocorrelation, where justified | Statistical indicators and cluster maps |
This connection strengthens the logic of your dissertation by making clear how the analysis contributes to answering the research questions.
4. Spatial Analysis Execution
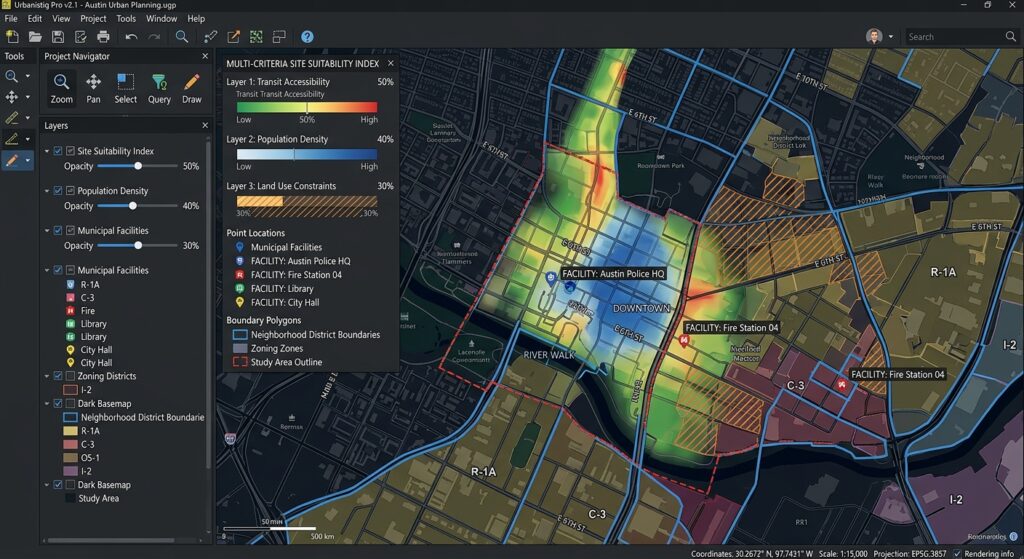
This section forms the technical core of the methodology. It describes the specific spatial operations, analytical parameters, mathematical equations, software environments, and decision rules used to produce the results.
Avoid statements such as “GIS tools were used to analyze the data.” They do not provide enough information for another researcher to reproduce the procedure.
4.1 Report the software and processing environment
Identify the applications and relevant versions used in the project.
For example:
- QGIS and its version.
- ArcGIS Pro and its version.
- Python and its version.
- GeoPandas, Rasterio, Shapely, or other relevant libraries and their versions.
- Relevant processing providers or algorithms.
- Operating-system or computing details when materially relevant to reproducibility.
Version information matters because tool behavior, algorithm implementations, and available parameters can change.
For Python-based analysis, you can record the environment:
import sys
import geopandas as gpd
import shapely

print("Python:", sys.version)
print("GeoPandas:", gpd.__version__)
print("Shapely:", shapely.__version__)
Include additional packages where relevant. Keep an environment file or dependency list with your code if the project is intended to be reproducible.
4.2 Name the analytical tool and its parameters
For every major operation, document:
- The tool or algorithm name.
- The input datasets.
- The relevant tool settings.
- The distance thresholds, weights, classifications, or other parameters.
- The selected measurement units.
- The output generated.
- The reason for choosing the method.
- Any assumptions required for interpretation.
For example, a buffer analysis should state the buffer radius, units, distance measurement assumptions, and whether overlapping buffers were dissolved.
A raster classification workflow should identify the spectral bands or input variables, classification approach, number of classes where applicable, training data or thresholds, and accuracy-assessment procedure.
A spatial autocorrelation analysis should identify the statistical method, spatial weights definition, neighborhood rule, treatment of self-neighbors, and relevant inferential settings.
The exact requirements vary according to the analysis. Focus on parameters that influence the output.
4.3 Use equations to clarify quantitative methods
Mathematical notation is helpful when it makes a method more precise.
For instance, the Euclidean distance between two points can be expressed as:
[
d_{ij} = \sqrt{(x_i-x_j)^2+(y_i-y_j)^2}
]
Where:
- (d_{ij}) is the straight-line distance between locations (i) and (j).
- (x_i, y_i) are the coordinates of location (i).
- (x_j, y_j) are the coordinates of location (j).
The accompanying prose should explain that the coordinates must be expressed in suitable linear units for the resulting distance to be interpreted meaningfully in those units. It should also acknowledge that Euclidean distance does not represent road distance or actual travel time.
For a buffer analysis, the conceptual operation can be expressed as:
[
B_r(p)={x(x,p)\leq r}
]
Here, (B_r(p)) represents the set of locations within a specified distance (r) of point (p).
If your research uses a 500-meter buffer around each health facility, state the threshold and justify it using a relevant planning standard, established literature, or a clearly stated research assumption. Do not present an arbitrary distance as a universal standard.
4.4 Explain the decision rules
Many GIS methods require choices that can substantially affect results.
Examples include:
- Selecting the buffer distance.
- Choosing a raster cell size.
- Defining the neighborhood for spatial statistics.
- Determining weights for a multi-criteria evaluation.
- Selecting raster classification thresholds.
- Choosing a resampling method.
- Defining what constitutes an accessible location.
- Establishing which records or pixels should be excluded.
For each important choice, state its rationale.
If weights were derived from expert consultation, explain how participants were selected and how their judgments were combined. If the weights were assigned by the researcher, acknowledge that they reflect an analytical judgment. If an established published model was adopted, cite the relevant source and identify any modifications.
4.5 Distinguish straight-line distance from network distance
This distinction is particularly important in urban planning, logistics, emergency management, and public-service accessibility research.
A 1-kilometer Euclidean distance means a location is 1 kilometer away in straight-line space. It does not establish that a person can reach the destination within 1 kilometer of road travel.
Network analysis may incorporate road connectivity, direction restrictions, travel speeds, route impedance, and other barriers.
Your methodology should identify which distance concept was used and explain why it is suitable for the research question.
4.6 Report outputs and intermediate checks
Document not only the final maps but also relevant intermediate outputs and quality checks.
Examples include:
- The number of features remaining after preprocessing.
- Raster dimensions and resolution.
- Classification area statistics.
- Distance summary statistics.
- Overlay results.
- Model scores.
- Statistical test results.
- Validation tables.
- Processing logs.
Recording intermediate results helps detect errors and establish a clear connection between the input data, analytical procedures, and reported findings.
5. Error Assessment and Methodological Limitations
A strong methodology acknowledges that spatial data and analytical methods contain uncertainty.
Error assessment does not weaken the dissertation. It demonstrates that the researcher understands the conditions under which the results can be trusted and the limits of their interpretation.
5.1 Positional and thematic accuracy
Positional accuracy concerns how closely a spatial feature’s recorded location corresponds to its true or reference location.
Thematic accuracy concerns whether a feature has been assigned the correct category or attribute.
Different datasets require different forms of assessment.
For georeferenced maps, report suitable positional-error indicators and explain the quality and distribution of control points.
For classified satellite imagery, describe the reference data, sampling strategy, confusion matrix, and appropriate accuracy measures, such as overall accuracy and class-specific precision or recall where relevant. Kappa may also be reported when justified, but it should not replace a fuller discussion of class-level performance and sampling design.
For field-survey data, describe the positioning equipment, collection conditions, reference system, and known limitations where relevant.
Do not claim that a dataset is accurate simply because it aligns visually with another layer. Visual agreement is a useful diagnostic but is not a comprehensive accuracy assessment.
5.2 Sensitivity analysis
A sensitivity analysis examines how changing important model parameters affects the results.
Suppose a suitability model assigns scores based on slope, distance to roads, population density, and land use. The resulting suitability map may change if the criterion weights or distance thresholds change.
A sensitivity workflow might include:
- Establishing a baseline model with documented parameters.
- Identifying the assumptions most likely to affect the output.
- Adjusting one or more parameters within defensible ranges.
- Comparing output maps, scores, or area statistics.
- Reporting whether the main conclusions remain stable.
For example, you could compare results generated using 500-meter, 1-kilometer, and 1.5-kilometer service thresholds if these values are justifiable for the research context.
Report the comparison objectively. If the results change substantially under reasonable alternatives, explain how that affects confidence in the conclusions.
5.3 The modifiable areal unit problem (MAUP)
The modifiable areal unit problem, commonly abbreviated as MAUP, arises when statistical patterns depend on how geographic areas are divided or aggregated.
For example, population density or socioeconomic characteristics may appear different when census data is summarized at ward boundaries rather than larger sub-county boundaries.
The choice of aggregation units can change:
- Statistical relationships.
- Apparent clusters.
- Average values.
- Correlations between variables.
- The location and intensity of mapped patterns.
If your analysis uses census zones, administrative units, regular grids, or other aggregation areas, state how those units were selected. Where appropriate, consider whether using alternative spatial units could change the interpretation.
Do not imply that a particular administrative boundary is a neutral representation of geographic behavior. Aggregation decisions may influence the apparent spatial pattern.
5.4 Scale, resolution, and boundary effects
The spatial scale of the input data places practical limits on the conclusions you can draw.
A raster with 30-meter cells cannot reliably represent every small object on the ground. Likewise, a road dataset with incomplete local-road coverage may underestimate accessibility in some areas.
Boundary effects can also distort neighborhood-based analyses when relevant features outside the study area are excluded.
Your limitations discussion should consider:
- Whether raster resolution is sufficient for the intended analysis.
- Whether input data were collected during comparable periods.
- Whether the study boundary excludes relevant neighboring features.
- Whether source datasets have inconsistent levels of detail.
- Whether the CRS introduces material distortion for the study region.
- Whether modeled indicators are proxies for a more complex real-world process.
5.5 State what your analysis cannot establish
A GIS analysis may identify spatial associations, correlations, or suitable locations without establishing causation.
For example, a map showing a strong relationship between poor accessibility and low income does not, by itself, demonstrate that accessibility caused the observed income pattern.
Similarly, a terrain-based flood susceptibility model is not automatically equivalent to a calibrated flood-inundation model.
Be precise about what the analysis demonstrates, what assumptions it relies on, and which additional evidence would be required to support stronger conclusions.
6. Checklist and Formatting Tips for Academic Submission
Before submitting your dissertation, review the methodology against the following checklist.
6.1 Data and metadata
-
Every spatial dataset has a clearly identified source.
-
Acquisition dates and the period represented by the data are distinguished.
-
Spatial resolution or scale is documented where applicable.
-
Original and final coordinate reference systems are reported.
-
Important attribute fields, units, and categories are described.
-
Data licenses and relevant restrictions are acknowledged.
6.2 Preprocessing
-
Georeferencing procedures and relevant error measures are documented where applicable.
-
Reprojection and clipping operations are explained.
-
Missing values, duplicate records, and invalid geometries are addressed.
-
Excluded observations and their exclusion criteria are reported.
-
Important data-cleaning decisions are justified.
-
Preprocessing outputs have been checked.
6.3 Analytical methods
-
Every major method is linked to a research objective.
-
Software applications and relevant versions are recorded.
-
Tools, algorithms, equations, and important parameters are specified.
-
Distance thresholds and measurement units are explicit.
-
Classification rules, model weights, or decision criteria are justified.
-
Workflow diagrams accurately represent the analysis performed.
-
Intermediate outputs and validation checks are documented.
6.4 Accuracy and limitations
-
Relevant spatial and thematic accuracy issues are discussed.
-
Important assumptions are stated.
-
Sensitivity analysis is considered where parameter uncertainty matters.
-
Potential scale effects and MAUP are discussed where relevant.
-
Limitations of the datasets and analytical methods are acknowledged.
-
Conclusions are not stronger than the evidence supports.
6.5 Formatting and academic presentation
- Use descriptive subheadings. Organize the chapter into numbered sections that match your university’s dissertation structure.
- Maintain consistent terminology. Use CRS, coordinate reference system, spatial resolution, and other technical terms consistently.
- Number figures and tables. Give every workflow diagram and metadata table an informative caption.
- Refer to figures in the text. Explain what a workflow figure illustrates and why it matters.
- Use equations selectively. Define all symbols and connect equations to the operations performed.
- Use reliable references. Cite original methodological publications, software documentation, and data providers where appropriate.
- Maintain a clear distinction between methodology and results. The methodology explains what was done and how. The results chapter presents the findings and their interpretation.
- Follow your university’s style guide. Use the required citation style, numbering system, margins, font, spacing, and appendix conventions.
6.6 Support reproducible GIS research
Where permitted by your university and data licenses, retain:
- Source datasets or documented references to them.
- Processing scripts and model files.
- Software environment details and package versions.
- Parameter settings and processing logs.
- Data-cleaning rules.
- Intermediate outputs needed to verify the workflow.
- A README file describing how to reproduce the analysis.
For Python workflows, a version-controlled repository and a dependency file can help another researcher recreate the computational environment. If sensitive data cannot be shared, explain the restriction and provide as much non-sensitive documentation as permitted.
Reproducibility does not necessarily mean publishing every raw file. It means documenting the methods, assumptions, dependencies, and data access requirements sufficiently for the work to be evaluated and, where feasible, repeated.
7. Suggested GIS Methodology Chapter Structure
The following outline provides a practical starting point. Adapt it to your research objectives and university requirements.
Chapter Three: Research Methodology
3.1 Introduction
Briefly explain the chapter’s purpose and summarize the analytical approach.
3.2 Study Area
Describe the study area’s location, boundaries, relevant environmental or socioeconomic characteristics, and the reasons for selecting it.
3.3 Data Sources and Acquisition
Identify all datasets, their sources, collection dates, resolutions, formats, and relevant metadata.
3.4 Data Preprocessing
Explain coordinate reference system harmonization, georeferencing, clipping, cleaning, and other preparation steps.
3.5 Analytical Framework
Present the conceptual model and workflow diagram linking research objectives to methods.
3.6 Spatial Analysis Methods
Document the specific GIS operations, equations, software tools, parameters, thresholds, and analytical assumptions.
3.7 Accuracy Assessment and Validation
Describe the reference data, accuracy indicators, validation procedures, and other relevant quality checks.
3.8 Error Sources and Methodological Limitations
Discuss uncertainty, sensitivity, spatial resolution, MAUP, and other limitations relevant to the study.
3.9 Chapter Summary
Summarize the methods and explain how they prepare the analysis for the next chapter.
This is a suggested structure, not a universal requirement. Some universities combine the study area and data acquisition sections or place limitations in a separate chapter. Follow your department’s guidelines and the advice of your supervisor.
Conclusion
Writing a GIS methodology section for a dissertation or thesis requires more than listing the tools used to create maps. A strong section explains the complete analytical process, justifies methodological decisions, identifies important parameters, and evaluates the reliability of the resulting outputs.
The five essential components are data acquisition and metadata, preprocessing and cleaning, the analytical framework, spatial analysis execution, and error assessment. Together, they establish a clear connection between the research questions, the selected datasets, and the conclusions supported by the analysis.
To strengthen your academic GIS methodology:
- Record the source and characteristics of every important dataset.
- Document preprocessing steps in the order they were performed.
- Use workflow diagrams to communicate analytical dependencies.
- Report the tools, equations, parameters, and thresholds that influence results.
- Discuss uncertainty and methodological limitations honestly.
- Preserve scripts, settings, and supporting documentation to enable reproducible GIS research.
Ultimately, a well-written methodology allows examiners to follow the reasoning behind your research and assess the quality of the evidence. It also provides other researchers with a foundation for evaluating, reproducing, and extending your work.