
Multi Criteria Evaluation GIS Site Selection: A Step-by-Step Site Suitability Tutorial
Introduction: What Is Multi-Criteria Evaluation in GIS?
Multi criteria evaluation GIS site selection is a spatial decision-making approach used to identify locations that best satisfy several criteria at the same time.
A typical site-selection problem might ask:
Where should a new hospital, school, warehouse, solar farm, landfill, or emergency facility be located?
The answer rarely depends on a single geographic variable. A suitable site may need to:
- Be close to roads.
- Have gentle slopes.
- Avoid rivers and flood-prone areas.
- Be located on appropriate land cover.
- Remain a certain distance from settlements.
- Have sufficient available land.
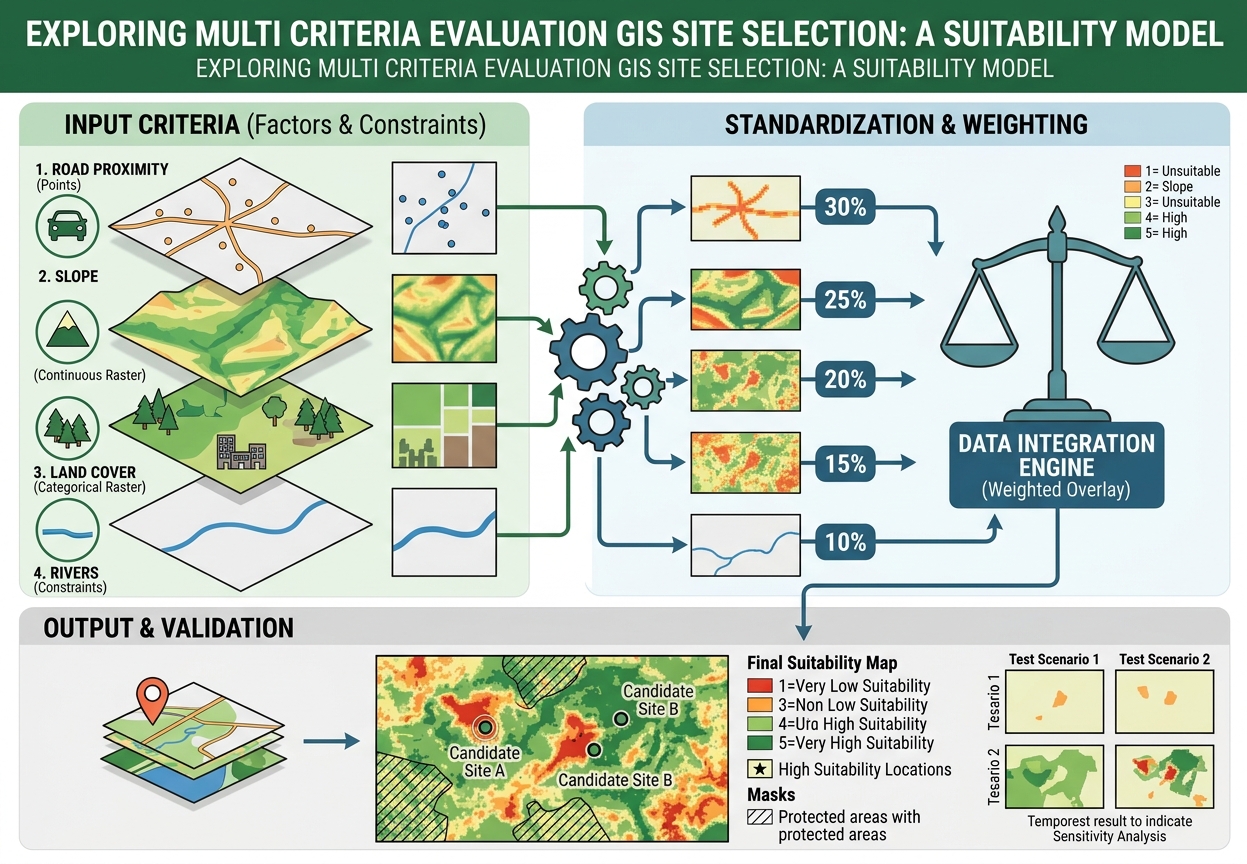
Multi-Criteria Evaluation (MCE) combines these factors into a single suitability model. A common approach is weighted overlay analysis, where each criterion is standardized to a common suitability scale and then assigned a weight according to its relative importance.
The basic concept is:
Raw spatial data → standardized suitability scores → weighted combination → suitability map → validation
This workflow is widely used in GIS planning, environmental assessment, urban planning, infrastructure development, agriculture, and renewable-energy site selection.
1. Understand the Structure of a Site Suitability Model
Before opening ArcGIS Pro or QGIS, separate your criteria into two categories:
Factors
A factor contributes positively or negatively to suitability on a continuous scale.
Examples:
- Distance from roads
- Slope
- Distance from rivers
- Distance from settlements
- Elevation
Constraints
A constraint identifies areas that should not be considered at all.
Examples:
- Protected areas
- Existing buildings
- Water bodies
- Airports
- Legally restricted zones
- Floodways
This distinction is important.
A factor might say:
“Closer to a road is generally more suitable.”
A constraint says:
“This area cannot be used regardless of its other characteristics.”
2. Define the Decision Problem
Start by writing a precise statement of the problem.
For example:
Objective: Identify suitable locations for a new community health facility.
Then establish the geographic study area.
For example:
- One municipality
- A county
- A watershed
- An urban district
- A regional planning zone
Define the study area before processing the criteria so that all datasets are analyzed over the same geographic extent.
3. Establish Your Suitability Criteria
For a simple student project, you might select:
- Distance to roads
- Slope
- Land cover
- Distance from rivers
- Distance from settlements
However, the criteria should be justified by the actual planning problem.
For a hospital, road accessibility might be highly important.
For a solar farm, slope and solar-resource conditions might receive greater attention.
For a landfill, distance from settlements and environmentally sensitive areas may be critical.
Do not choose criteria simply because the datasets are available.
Every criterion should answer:
Why should this variable influence site suitability?
4. Establish Buffer Distance Constraints
Some suitability problems require minimum separation distances.
For example, you may decide that candidate sites must be:
- At least 100 m from rivers.
- At least 500 m from major settlements.
- Within 2 km of roads.
- Outside protected areas.
These distances should ideally come from:
- Planning regulations
- Environmental guidelines
- Engineering requirements
- Published literature
- The project’s stated assumptions
If you are completing a university assignment and no official threshold is provided, clearly label your distances as project assumptions rather than presenting them as universal standards.
5. Prepare the Input Data
Collect the required GIS layers.
A typical project might contain:
| Dataset | Geometry | Possible Use |
|---|---|---|
| Roads | Line | Accessibility |
| Rivers | Line | Environmental constraint |
| Settlements | Point/Polygon | Population access or exclusion |
| Land cover | Raster | Land-use suitability |
| DEM | Raster | Slope |
| Protected areas | Polygon | Constraint |
Before analysis, inspect every dataset.
Check:
- CRS
- Extent
- Resolution
- Units
- Geometry
- Missing values
- Attribute fields
6. Use a Common Projected CRS
Distance-based analysis should generally be performed using a projected coordinate system whose units are appropriate for the study area.
For example, if your distance raster is measured in meters, your analysis should not accidentally be based on geographic coordinates measured in degrees.
Check:
Is my coordinate system appropriate for measuring distance and area?
This is one of the most important preprocessing steps in a suitability model.
7. Standardize the Criteria
The original datasets usually use completely different units.
For example:
| Criterion | Original Unit |
|---|---|
| Distance to road | meters |
| Slope | degrees |
| Land cover | category codes |
| Distance to river | meters |
| Elevation | meters |
You cannot meaningfully add these raw values together.
Therefore, you must convert them to a common suitability scale.
A common student workflow is:
1 = unsuitable
through
5 = highly suitable
or:
0 = unsuitable
through
100 = highly suitable
The important requirement is consistency.
8. Calculate Euclidean Distance
For criteria involving proximity, create a distance raster.
Typical examples include:
- Distance to roads
- Distance to rivers
- Distance to settlements
- Distance to hospitals
- Distance to schools
In ArcGIS Pro, a common workflow is:
Spatial Analyst → Distance → Euclidean Distance
Select the relevant feature layer and specify the output raster.
[Insert Screenshot of Euclidean Distance Tool]
The resulting raster assigns each cell a distance to the nearest input feature.
For example:
| Cell | Distance to Road |
|---|---|
| A | 50 m |
| B | 250 m |
| C | 750 m |
| D | 2,000 m |
9. Decide Whether Nearer or Farther Is Better
This is where the planning logic becomes important.
For road accessibility:
Closer = more suitable
For avoiding pollution sources:
Farther = more suitable
For distance from rivers in a flood-sensitive project:
Farther = potentially more suitable
Therefore, do not blindly reclassify every distance raster in the same direction.
Example: Road Accessibility
| Distance | Suitability |
|---|---|
| 0–250 m | 5 |
| 250–500 m | 4 |
| 500–1,000 m | 3 |
| 1,000–2,000 m | 2 |
| >2,000 m | 1 |
Example: River Separation
| Distance | Suitability |
|---|---|
| <100 m | 1 |
| 100–250 m | 2 |
| 250–500 m | 3 |
| 500–1,000 m | 4 |
| >1,000 m | 5 |
The same distance concept can therefore produce opposite suitability relationships depending on the planning objective.
10. Calculate Slope From the DEM
Slope is commonly derived from a Digital Elevation Model.
In ArcGIS Pro:
Spatial Analyst → Surface → Slope
Specify:
- Input DEM
- Output measurement
- Z factor if required
[Insert Screenshot of Slope Tool]
The output might look like:
| Slope | Suitability |
|---|---|
| 0–5° | 5 |
| 5–10° | 4 |
| 10–15° | 3 |
| 15–25° | 2 |
| >25° | 1 |
These thresholds are examples only. Your project should justify its actual slope thresholds.
11. Reclassify the Criteria
Once the factor rasters have been created, convert them into the common suitability scale.
In ArcGIS Pro, use:
Spatial Analyst → Reclass → Reclassify
[Insert Screenshot of Reclassify Tool]
For example, suppose the original slope raster contains:
- 0–5°
- 5–10°
- 10–15°
- 15–25°
-
25°
You can assign:
- 5 = highly suitable
- 4 = suitable
- 3 = moderate
- 2 = low
- 1 = unsuitable
Example
| Original Slope | New Suitability |
|---|---|
| 0–5° | 5 |
| 5–10° | 4 |
| 10–15° | 3 |
| 15–25° | 2 |
| >25° | 1 |
Repeat this process for every factor.
12. Reclassify Categorical Land-Cover Data
Land cover is different from distance and slope because its values represent categories rather than continuous measurements.
For example:
| Land Cover | Suitability |
|---|---|
| Built-up | 1 |
| Dense forest | 2 |
| Agricultural land | 3 |
| Grassland | 4 |
| Bare land | 5 |
The actual suitability assignments depend entirely on the project objective.
For a conservation project, the same land-cover categories could receive very different scores.
This is why your reclassification table should be explained in the methodology.
13. Build the Decision Matrix
Before assigning weights in the GIS software, create a decision matrix.
Here is an example for a hypothetical community health-facility site-selection project:
| Criterion | Standardization Range | Percentage Weight |
|---|---|---|
| Distance to roads | 1–5; closer = better | 30% |
| Slope | 1–5; flatter = better | 25% |
| Land cover | 1–5; preferred classes = higher | 20% |
| Distance from rivers | 1–5; farther = better | 15% |
| Distance from settlements | 1–5; project-dependent | 10% |
| Total | — | 100% |
The weights must sum to:
100%
This table should appear in your project report because it makes the decision process transparent.
14. Assign Weights
Not every criterion should necessarily have equal importance.
For example:
- Road access → 30%
- Slope → 25%
- Land cover → 20%
- River separation → 15%
- Settlement proximity → 10%
The weighted model can be represented conceptually as:
Suitability = (Road × 0.30) + (Slope × 0.25) + (Land Cover × 0.20) + (River × 0.15) + (Settlement × 0.10)
Every input is now on the same suitability scale, allowing the weighted combination to be calculated.
15. Where Does AHP Fit In?
The Analytic Hierarchy Process (AHP) is a structured method for deriving weights from pairwise comparisons between criteria.
Instead of simply saying:
Roads = 30%
you compare criteria against one another.
For example:
Is road accessibility more important than slope?
Then:
How much more important?
The comparisons are organized in a pairwise comparison matrix.
AHP is particularly useful when your project requires a more formal justification of the weights.
Basic AHP workflow
- Define the objective.
- List the criteria.
- Compare criteria pairwise.
- Assign relative importance scores.
- Calculate normalized weights.
- Check consistency.
- Use the resulting weights in the suitability model.
AHP therefore helps answer:
How should the criteria be weighted?
Weighted Overlay answers:
How should the standardized criteria be combined?
They can be used together.
16. Run Weighted Overlay
After standardization and weighting, combine the factor rasters.
In ArcGIS Pro, a common tool is:
Spatial Analyst → Overlay → Weighted Overlay
Add the standardized rasters to the table.
[Insert Screenshot of Weighted Overlay Table]
Your table may look conceptually like:
| Input Raster | Field | Scale | Weight |
|---|---|---|---|
| Road suitability | Suitability | 1–5 | 30% |
| Slope suitability | Suitability | 1–5 | 25% |
| Land-cover suitability | Suitability | 1–5 | 20% |
| River suitability | Suitability | 1–5 | 15% |
| Settlement suitability | Suitability | 1–5 | 10% |
Confirm that the weights sum to 100%.
Then run the tool.
17. Understand the Suitability Output
The resulting raster represents the combined suitability score.
Depending on your scale, higher values may represent better sites.
For example:
| Final Score | Interpretation |
|---|---|
| 1 | Very low suitability |
| 2 | Low suitability |
| 3 | Moderate suitability |
| 4 | High suitability |
| 5 | Very high suitability |
You can then symbolize the result using a sequential color ramp.
[Insert Screenshot of Final Suitability Raster]
18. Apply Constraints Separately
Remember that a constraint is different from a factor.
Suppose protected areas are completely unavailable.
A high suitability score should not allow a protected area to become a candidate site simply because it is close to roads and has a favorable slope.
Create a binary constraint mask:
- 1 = allowed
- 0 = prohibited
Then combine the suitability result with the constraint.
Conceptually:
Final suitability = Weighted suitability × Constraint mask
This forces prohibited areas to become unsuitable.
19. Handle NoData Carefully
NoData cells can create unexpected gaps in your suitability map.
Potential causes include:
- Different raster extents
- Different cell sizes
- Missing source data
- Masking
- Reclassification settings
- Areas outside the input dataset
Troubleshooting workflow
Check:
- Cell size
- Processing extent
- Snap Raster
- Coordinate system
- Raster alignment
- NoData settings
In ArcGIS Pro, environment settings are especially important.
Set a common:
- Processing Extent
- Cell Size
- Snap Raster
- Output Coordinate System
This ensures that the input rasters line up correctly.
20. Resolving Scale Mismatch Errors
A common problem occurs when one raster uses:
1–5
while another uses:
1–10
and another uses:
0–100
These datasets should not simply be combined without standardization.
Solution
Choose a common scale, such as:
1–5
Then reclassify every factor to that scale.
For example:
| Original | Standardized |
|---|---|
| 0–20 | 1 |
| 21–40 | 2 |
| 41–60 | 3 |
| 61–80 | 4 |
| 81–100 | 5 |
The important thing is that 5 always means the same relative level of suitability across the model.
21. Check Raster Alignment
Two rasters may appear to have the same geographic coverage while having different cell grids.
Check:
- Pixel size
- Extent
- Origin
- Projection
- Number of rows and columns
Use a common snap raster so cell boundaries align.
This matters because a weighted overlay is performed cell by cell.
If the grids are misaligned, apparently corresponding cells may not represent exactly the same geographic location.
22. Validate the Suitability Model
Do not stop after producing a colorful suitability map.
A suitability model is a decision-support model, not automatically a prediction of where development should occur.
Validation should therefore ask whether the model behaves logically.
Test 1: Inspect high-suitability areas
Ask:
- Are they actually accessible?
- Do they avoid prohibited areas?
- Are the slopes reasonable?
- Do they satisfy the project’s constraints?
Test 2: Inspect low-suitability areas
Ask:
- Why were they classified as unsuitable?
- Is the result caused by one criterion or several?
Test 3: Check known locations
If existing facilities or known suitable sites are available, compare them with the model output.
This is not proof that the model is correct, but it can reveal obvious inconsistencies.
23. Perform Sensitivity Analysis
Weights contain assumptions.
Suppose your initial model uses:
Road access = 30%
Try another scenario:
Road access = 20%
and increase another criterion accordingly.
Then compare the resulting suitability maps.
If the high-suitability areas remain broadly similar, the model may be relatively stable.
If they change dramatically, the results are sensitive to the weighting assumptions.
This is valuable information to report.
24. Common Troubleshooting Problems
Problem 1: Weighted Overlay Rejects a Raster
Possible cause
The raster does not meet the expected scale or data requirements.
Fix
Check:
- Raster data type
- Reclassification
- Suitability scale
- Cell size
- Coordinate system
Make sure all factor rasters use the intended standardized scale.
Problem 2: Large Areas Become NoData
Possible causes
- Different raster extents
- Missing source data
- Incorrect mask
- NoData propagation
- Misconfigured processing environments
Fix
Compare the input rasters and standardize:
- Extent
- Cell size
- Snap Raster
- CRS
Problem 3: Almost Everything Is Highly Suitable
Possible causes
- Weak criteria
- Poorly differentiated reclassification
- Excessive weighting of one factor
- Suitability thresholds that are too generous
Fix
Inspect each criterion individually.
Ask:
Does this input raster actually distinguish between suitable and unsuitable areas?
Problem 4: Almost Everything Is Unsuitable
Check whether:
- One criterion is overly restrictive.
- A constraint was accidentally applied to the entire study area.
- Reclassification values were reversed.
- NoData has been propagated.
- Weights or scales were entered incorrectly.
Problem 5: The Map Looks Correct but the Analysis Is Wrong
This is particularly dangerous because cartographic appearance does not prove analytical correctness.
Always inspect the underlying raster values.
Use:
- Identify
- Raster statistics
- Histograms
- Attribute tables where applicable
- Sample locations
Do not validate a suitability model solely by looking at its colors.
25. Final Suitability Model Workflow
A defensible site suitability model can follow this sequence:
Define planning objective
          ↓
Select criteria
          ↓
Identify constraints
          ↓
Collect spatial datasets
          ↓
Standardize CRS and raster environment
          ↓
Create distance/slope/other factor rasters
          ↓
Reclassify factors to common suitability scale
          ↓
Determine criterion weights
          ↓
Apply AHP if formal weighting is required
          ↓
Run Weighted Overlay
          ↓
Apply hard constraints
          ↓
Inspect suitability output
          ↓
Validate results
          ↓
Perform sensitivity analysis
          ↓
Produce final suitability map
26. Quick Quality-Control Checklist
Before submitting your spatial decision-making project, check:
- Is the planning objective clearly defined?
- Is every criterion theoretically justified?
- Are factors separated from hard constraints?
- Are all distance calculations performed in an appropriate projected CRS?
- Are raster cell sizes consistent?
- Is a common snap raster used?
- Are all criteria standardized to the same suitability scale?
- Are reclassification directions correct?
- Do the weights sum to 100%?
- Are AHP weights justified if AHP is used?
- Have NoData areas been checked?
- Have prohibited areas been masked?
- Have high-suitability locations been inspected?
- Have sensitivity tests been performed?
- Are the assumptions documented?
- Does the final map clearly distinguish suitability classes?
Final Takeaway
A strong multi criteria evaluation GIS site selection project is more than running a Weighted Overlay tool and producing a colorful raster.
The quality of the result depends on the entire chain:
criteria selection → spatial preprocessing → standardization → weighting → overlay → constraints → validation
The most important principle is that every modeling decision should be defensible.
If a student assigns 30% to road proximity, they should be able to explain why. If a slope of 0–5° receives a suitability score of 5, they should explain the planning assumption behind that threshold. If protected areas are excluded, the source or project requirement for that constraint should be documented.
A technically sophisticated model with poorly justified assumptions is still a weak decision model.
A well-documented MCE workflow, on the other hand, allows another GIS analyst—or your lecturer—to understand exactly how the final suitability map was produced and why each decision was made.