
How to Create Interactive Web Map QGIS: Turn Your GIS Project into a Web GIS Portfolio
Introduction
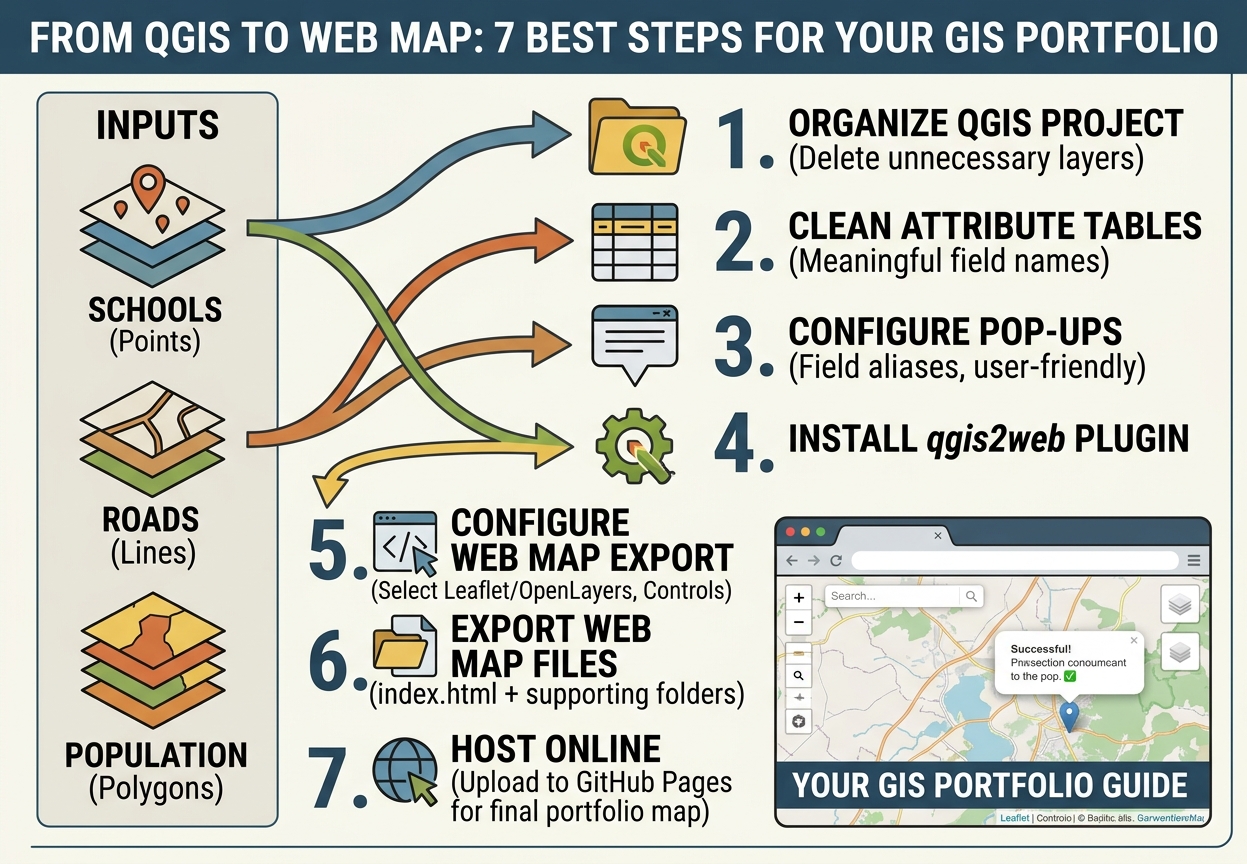
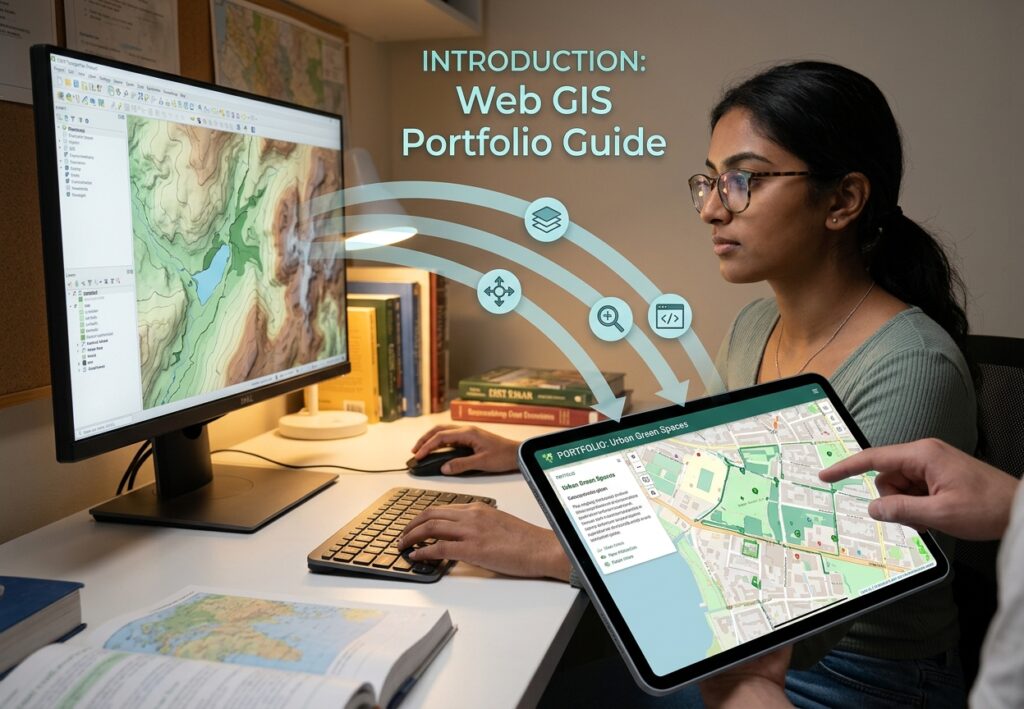
Learning how to create interactive web map QGIS projects allows students and professionals to turn static GIS analyses into dynamic Web GIS applications. A well-designed GIS project should not have to end as a static PDF. Today, students can transform maps created in desktop GIS into interactive web maps that allow employers, lecturers, and other users to zoom, pan, switch layers, and click features to explore attribute information.
Learning how to create interactive web map QGIS projects is therefore a valuable skill for students building a professional GIS portfolio. Instead of simply submitting a map layout, you can publish a project that demonstrates cartography, spatial analysis, data management, and basic web GIS skills in one deliverable.
One of the easiest ways to make this transition is with the qgis2web plugin. It can export a QGIS project into a web map using JavaScript libraries such as Leaflet or OpenLayers, without requiring you to become an advanced web developer first.
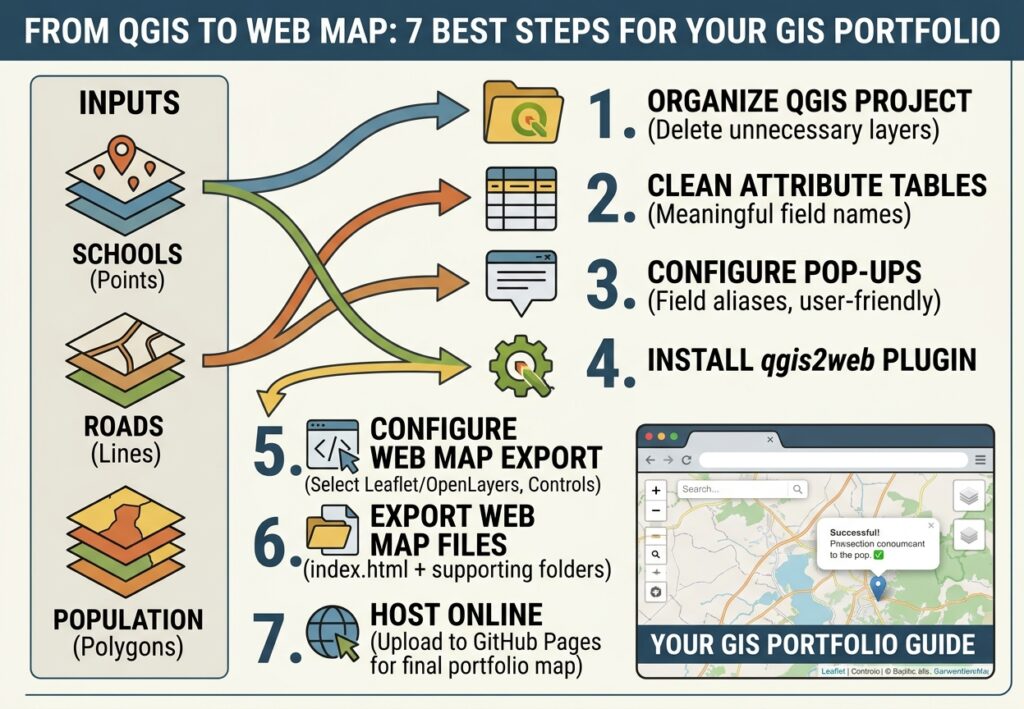
This guide walks through the complete workflow, from preparing QGIS layers to exporting and hosting an interactive map online.
1. Desktop GIS vs Interactive Web Maps
Traditional GIS assignments often finish with a PDF containing:
- Map title
- Legend
- Scale bar
- North arrow
- Data sources
- Analysis results
- Interpretation
A web map can provide an additional layer of interaction.
| Desktop GIS map | Interactive web map |
|---|---|
| Usually static | Interactive |
| Printed or exported as PDF | Viewed in a browser |
| User cannot inspect individual features easily | Users can click features |
| Fixed map extent | Users can zoom and pan |
| Static legend | Interactive layer controls |
| Limited attribute access | Pop-ups can display attributes |
| Mainly presentation-focused | Presentation + exploration |
For a student portfolio, an interactive map can demonstrate that you understand more than basic cartographic design.
It can show employers that you understand the transition from desktop GIS to Web GIS.
2. What You Need
For this workflow, you need:
- QGIS
- A completed GIS project
- Vector data such as Shapefile, GeoPackage, GeoJSON, or other supported formats
- The qgis2web plugin
- A web browser
- A GitHub account if you want free online hosting
- A portfolio website or GitHub Pages site, if available
A simple project might contain:
GIS Project
│
├── Roads
├── Rivers
├── Schools
├── Administrative Boundaries
└── Population Data
For a portfolio project, choose data that tells a clear spatial story.
Examples include:
- Mapping schools and population density
- Urban land-use mapping
- Flood-risk mapping
- Public transport accessibility
- Crime hotspot analysis
- Environmental suitability analysis
- Agricultural land suitability
- Healthcare facility accessibility
3. Prepare Your QGIS Project Before Exporting
The quality of the web map depends heavily on how well the original QGIS project is organized.
Before opening qgis2web, clean up your project.
3.1 Organize Your Layers
Remove unnecessary layers and temporary datasets.
For example:
Project
│
├── Base Data
│   ├── Roads
│   └── Rivers
│
├── Analysis Results
│   ├── Flood Risk
│   └── Schools
│
└── Boundaries
    └── Study Area
Only export the layers that users actually need.
This reduces the size of the final web map.
4. Prepare Vector Layers
qgis2web works particularly well with vector datasets.
Common examples include:
- Points
- Lines
- Polygons
For example:
Point layer
Schools
Possible fields:
| Field | Example |
|---|---|
| school_name | Green Valley Primary |
| type | Primary |
| enrollment | 452 |
| district | West District |
Polygon layer
Flood Risk Zones
Possible fields:
| Field | Example |
|---|---|
| risk_level | High |
| area_km2 | 4.72 |
| population | 8,430 |
Make sure the attribute table contains meaningful information before exporting.
5. Clean Your Attribute Tables
Interactive maps become much more useful when users can click a feature and immediately understand what they are looking at.
Open the layer’s Attribute Table and check for:
- Meaningful field names
- Missing values
- Duplicate records
- Unnecessary technical fields
- Incorrect data types
- Extremely long text fields
Avoid exposing unnecessary fields such as:
fid
objectid
shape_length
shape_area
internal_id
temporary_code
unless they have a meaningful purpose.
6. Create Useful Pop-Up Field Aliases
One important advantage of qgis2web is that attribute information can be displayed in interactive pop-ups.
Instead of showing:
school_nm
sch_type
enrol_tot
dist_code
you can configure the presentation to communicate:
School Name
School Type
Student Enrollment
District
This is especially important in a portfolio project because it demonstrates attention to user experience.
Good pop-up design
A school feature might display:
School Name: Green Valley Primary

Type: Primary School

Enrollment: 452

District: West District
The user should not have to understand your database schema to interpret the map.
7. Install the qgis2web Plugin
Open QGIS.
Go to:
Plugins → Manage and Install Plugins
Search for:
qgis2web
Select the plugin and click:
Install Plugin
After installation, qgis2web can be accessed through the QGIS interface.
[Insert Screenshot of QGIS Plugin Manager showing qgis2web]
8. Open qgis2web
With your project open, go to:
Web → qgis2web → Create web map
Depending on your QGIS version and interface configuration, the qgis2web command may appear through the plugin’s toolbar or menu.
The qgis2web dialog will open.
You will normally see options relating to:
- Layers
- Appearance
- Export
- Pop-ups
- Basemaps
- Controls
- JavaScript library
The two major JavaScript mapping options are:
- Leaflet
- OpenLayers
9. Leaflet vs OpenLayers
qgis2web can export the project using either Leaflet or OpenLayers.
| Feature | Leaflet | OpenLayers |
|---|---|---|
| Beginner friendliness | High | Moderate |
| Lightweight maps | Excellent | Good |
| Web mapping popularity | Very high | High |
| Simple portfolio maps | Excellent | Good |
| JavaScript ecosystem | Large | Large |
| Learning curve | Relatively low | Higher |
| Student portfolio | Excellent choice | Useful alternative |
For many beginner portfolio projects, Leaflet is a practical choice because it produces a lightweight, browser-based map and is widely used in Web GIS development.
OpenLayers is also a powerful option, particularly when your project requires more advanced web mapping functionality.
10. Configure the Export
In the qgis2web interface, review the available export settings.
Depending on the version of qgis2web and your project, you may be able to configure:
- Mapping library
- Visible layers
- Basemaps
- Pop-ups
- Layer controls
- Search
- Measurement tools
- Zoom controls
- Highlighting
- Scale display
- Address or feature search
Do not automatically export every available field and tool.
Think about the person who will use your portfolio map.
Ask:
“What does this user actually need to explore?”
[Insert Screenshot of Export Settings]
11. Configure Your Layers
Each layer should have a clear name.
Avoid:
layer_01
final_final2
roads_new
polygon_copy
Use names such as:
Road Network
Schools
Rivers
Flood Risk
Administrative Boundaries
Clear layer names immediately make the project look more professional.
12. Configure Pop-Ups
The pop-up configuration is one of the most important parts of the workflow.
For each layer, identify the fields that should appear when someone clicks a feature.
For example, for a school layer:
School Name
School Type
Enrollment
District
For a road layer:
Road Name
Road Type
Surface
Length
For a flood-risk layer:
Risk Level
Population
Area
Risk Score
Avoid displaying dozens of fields.
A user should be able to understand the feature within a few seconds.
13. Use Meaningful Field Names
A database field might originally be:
pop_2025A web map user should see something closer to:
Population (2025)Likewise:
road_clscould become:
Road ClassificationThis is where field aliases and pop-up configuration become important.
The goal is to separate the technical database structure from the user-facing interface.
14. Configure the Layers Panel
An interactive map can contain many layers, but users need a simple way to control them.
A layer panel can allow users to turn datasets on and off.
For example:
☑ Roads
☑ Schools
☐ Rivers
☐ Flood Risk
☑ Study Area
This is more useful than displaying every layer simultaneously.
Think of the layer panel as the map’s interactive legend.
[Insert Screenshot of Web Preview]
15. Preview the Web Map
Before exporting the final project, preview it.
Check:
Navigation
Can you:
- Zoom in?
- Zoom out?
- Pan?
- Return to the study area?
Layers
Can you:
- Turn layers on?
- Turn layers off?
- Understand what each layer represents?
Pop-ups
Can you:
- Click features?
- Read the attributes?
- Understand the field labels?
Cartography
Check:
- Colors
- Line thickness
- Point symbols
- Transparency
- Layer order
- Basemap contrast
The web version should preserve the important visual hierarchy of the original QGIS project.
16. Export the Web Map
Once the preview works correctly, select the export option.
Choose an output directory such as:
GIS_Web_Map/A typical exported project may contain files similar to:
GIS_Web_Map/
│
├── index.html
├── css/
├── js/
├── data/
├── images/
└── layers/
The exact structure depends on the qgis2web version and configuration.
The important file is generally:
index.htmlThis acts as the entry point for the web map.
17. Understand What qgis2web Actually Does
You do not need to become an expert JavaScript developer to use qgis2web.
The basic process is:
QGIS Project
      ↓
qgis2web
      ↓
HTML + CSS + JavaScript
      ↓
Web Mapping Library
      ↓
Interactive Browser Map
For a Leaflet export:
QGIS
 ↓
qgis2web
 ↓
Leaflet
 ↓
HTML/CSS/JavaScript
 ↓
Web Browser
This is an excellent introduction to Web GIS because you can see how desktop GIS data becomes a browser-based application.
18. Host Your Map with GitHub Pages
One convenient option for a student portfolio is GitHub Pages.
Your exported web map can be placed inside a GitHub repository and served as a website.
A simple repository could look like:
my-gis-portfolio/
│
├── index.html
├── css/
├── js/
├── data/
├── images/
└── README.md
The index.html file provides the starting page for your web map.
19. Basic GitHub Pages Workflow
A typical workflow is:
Step 1 — Create a repository
Create a new GitHub repository for your project.
Example:
urban-flood-risk-mapStep 2 — Upload the exported qgis2web files
Upload the complete exported folder contents.
Make sure you preserve the folder structure.
For example:
index.html
css/
js/
data/
Do not upload only index.html if the map depends on additional JavaScript, CSS, data, or image files.
Step 3 — Enable GitHub Pages
Open the repository’s settings and locate the Pages configuration.
Select the branch and folder containing the website.
GitHub then provides a public website address for the project.
Step 4 — Test the published map
Open the published URL in a browser.
Test:
- Zoom
- Layer controls
- Pop-ups
- Search
- Symbols
- Basemap
- Mobile responsiveness
20. Add the Map to Your GIS Portfolio
A web map becomes much more valuable when presented as part of a complete project.
Instead of simply writing:
“GIS Project — Flood Mapping”
create a project page containing:
Project Title
Urban Flood Risk Assessment Using GIS
Problem
What spatial problem did you investigate?
Data
Explain your datasets.
For example:
- DEM
- Roads
- Rivers
- Buildings
- Population
- Administrative boundaries
Methods
Describe your workflow.
Data Collection
      ↓
Data Cleaning
      ↓
Spatial Analysis
      ↓
Raster Processing
      ↓
Risk Classification
      ↓
Cartographic Design
      ↓
Interactive Web Map
Results
Briefly explain what the analysis revealed.
Interactive Map
Embed or link to the qgis2web map.
Tools
List:
QGIS
qgis2web
Leaflet
GitHub Pages
This turns a simple GIS assignment into a professional portfolio case study.
21. Make the Project Employer-Friendly
Employers looking at a GIS portfolio usually need to understand your contribution quickly.
For each project, clearly state:
Project: Urban Flood Risk Mapping
Software: QGIS
Web GIS: qgis2web / Leaflet
Analysis: Raster reclassification + weighted overlay
Data: DEM, roads, rivers, population
Output: Interactive web map
Skills demonstrated:
- Spatial analysis
- Cartography
- Data management
- Raster processing
- Web GIS
- Map communication
This makes your technical skills much easier to identify.
22. qgis2web vs ArcGIS StoryMaps
qgis2web is not the only way to create a web-based GIS portfolio.
Another option students may encounter is ArcGIS StoryMaps.
The two approaches serve somewhat different purposes.
| qgis2web | ArcGIS StoryMaps |
|---|---|
| Strong connection to QGIS | Strong connection to ArcGIS ecosystem |
| Generates web map files | Story-oriented presentation |
| Good for technical GIS portfolios | Good for narrative presentations |
| Leaflet/OpenLayers | ArcGIS web mapping ecosystem |
| Greater control over exported web files | Strong guided storytelling interface |
| Useful for learning Web GIS concepts | Useful for communicating project narratives |
A student might use qgis2web when the goal is:
“Here is my interactive GIS analysis.”
A StoryMap may be more appropriate when the goal is:
“Here is the story behind my geographic analysis.”
For example, a disaster-risk project could combine maps, photographs, explanatory text, charts, and narrative sections in a StoryMap-style presentation.
23. Troubleshooting Blank Web Maps
One of the most frustrating problems is opening the exported HTML file and seeing a blank map.
Possible causes include:
Problem 1 — Incorrect file structure
You may have moved index.html without moving the associated files.
For example:
index.htmlwithout:
css/
js/
data/
layers/
can cause the map to fail.
Solution
Keep the complete qgis2web export structure together.
24. Check Browser Developer Tools
If the map is blank, open the browser’s developer tools.
In Chrome or Edge:
F12Then check the Console and Network tabs.
Look for errors such as:
404 Not Foundor missing JavaScript/data files.
A 404 error often means the browser cannot locate a required file.
25. Check Your Coordinate Reference System
CRS problems can also produce unexpected results.
For web mapping, geographic coordinates are commonly handled using:
WGS 84 / EPSG:4326while Web Mercator is commonly used by many web basemaps:
WGS 84 / Pseudo-Mercator
EPSG:3857
Make sure your layers and project are configured appropriately before exporting.
If a layer appears far away from the expected location, investigate its CRS definition and coordinate transformation.
26. Fix Broken Pop-Ups
If the map displays correctly but clicking features produces an empty or broken pop-up, check:
- Whether the layer contains attributes
- Whether the selected fields still exist
- Whether fields contain valid values
- Whether the exported data contains the attributes
- Whether the layer was successfully exported
Start with one simple field.
For example:
nameTest the pop-up.
Then gradually add additional fields.
This makes it easier to identify which configuration is causing the problem.
27. Fix Slow Loading Times
Large datasets are one of the biggest problems with beginner web maps.
A desktop GIS can comfortably handle large datasets that are inappropriate for a browser-based map.
For example, exporting hundreds of thousands of detailed polygon features can create a very large web map.
This can cause:
- Slow loading
- High browser memory use
- Long download times
- Poor performance on mobile devices
28. Simplify Geometry Before Exporting
If a polygon layer contains excessive geometric detail, simplify it before publishing.
The general workflow is:
Original Layer
      ↓
Geometry Simplification
      ↓
Smaller Dataset
      ↓
qgis2web
      ↓
Faster Web Map
For example, highly detailed administrative boundaries may contain far more vertices than necessary for a web map viewed at a regional scale.
Use an appropriate simplification tolerance while preserving the shape needed for your map’s purpose.
Always keep your original dataset unchanged.
Create a simplified copy for web publishing.
29. Filter Unnecessary Features
You do not necessarily need every feature in the web map.
Suppose your database contains:
25,000 buildingsbut your project only analyzes:
500 buildings within the study areaExport only the relevant features.
This reduces the amount of data the browser has to load.
30. Avoid Excessive Pop-Up Information
Pop-ups containing large amounts of text can also reduce usability.
Instead of showing 20 fields:
ID
Code
Name
Category
Subcategory
Area
Length
Population
Owner
Date
Source
...
show only the fields relevant to the user.
A concise pop-up is usually easier to read.
31. Common qgis2web Problems
| Problem | Possible cause | Solution |
|---|---|---|
| Blank map | Missing exported files | Preserve entire export folder |
| Layer missing | Unsupported/failed export | Check layer format and export settings |
| Pop-up empty | Fields not configured | Review pop-up fields |
| Features in wrong location | CRS problem | Check layer CRS |
| Map loads slowly | Large dataset | Simplify/filter data |
| Broken basemap | Network connection | Test another basemap |
| 404 errors | Incorrect file paths | Check folder structure |
| Some symbols missing | Complex styling | Simplify symbology |
| Website works locally but not online | Hosting/path issue | Inspect browser console and repository structure |
32. A Professional Web GIS Workflow
A strong student workflow can be summarized as:
1. Define the spatial problem
            ↓
2. Collect GIS data
            ↓
3. Clean and prepare data
            ↓
4. Perform spatial analysis
            ↓
5. Design the QGIS map
            ↓
6. Configure attributes/pop-ups
            ↓
7. Install qgis2web
            ↓
8. Configure Leaflet/OpenLayers
            ↓
9. Preview the web map
            ↓
10. Simplify data if necessary
            ↓
11. Export the web map
            ↓
12. Host it online
            ↓
13. Add it to your portfolio
The important point is that web GIS should be considered part of the communication stage of a GIS project, rather than an afterthought.
33. Portfolio Project Example
Imagine you completed a university project titled:
“GIS-Based Analysis of Healthcare Facility Accessibility”
Your desktop GIS analysis might contain:
- Health facilities
- Roads
- Population
- Administrative boundaries
- Travel-distance zones
You could transform the final project into an interactive web map.
The user could:
- Zoom into the study area.
- Turn roads on or off.
- Click health facilities.
- View facility information.
- Examine accessibility zones.
- Compare different administrative areas.
Your portfolio page could then present:
Healthcare Accessibility Analysis
│
├── Project Background
├── Research Question
├── Data Sources
├── GIS Methodology
├── Spatial Analysis
├── Cartographic Design
├── Interactive Web Map
└── Key Findings
This tells a much stronger story than uploading a PDF alone.
34. Skills You Demonstrate
A single interactive GIS portfolio project can demonstrate several skills simultaneously.
GIS Analysis
You show that you can manipulate and analyze spatial data.
Cartography
You demonstrate visual hierarchy, symbology, labeling, and map design.
Data Management
You demonstrate that you understand attributes, formats, CRS, and data preparation.
Web GIS
You demonstrate an understanding of how GIS content can be delivered through a browser.
Basic Programming Concepts
Using qgis2web exposes you to:
- HTML
- CSS
- JavaScript
- Leaflet
- OpenLayers
- Web-based spatial data
You do not need to master JavaScript before beginning.
The important first step is understanding how the technologies fit together.
35. Beginner Web GIS Mental Model
Think about the process this way:
QGIS is where you prepare the geographic information.
qgis2web is the bridge.
Leaflet or OpenLayers provides the interactive map framework.
HTML/CSS/JavaScript provide the web interface.
GitHub Pages or another web host makes the project accessible online.
In simplified form:
GIS DATA
   ↓
QGIS
   ↓
qgis2web
   ↓
Leaflet / OpenLayers
   ↓
HTML + CSS + JavaScript
   ↓
WEB BROWSER
   ↓
YOUR GIS PORTFOLIO
Understanding this pipeline is more important than memorizing individual buttons.
36. Final Web GIS Portfolio Checklist
Before publishing your map, check:
QGIS Project
- Layers have meaningful names
- Unnecessary layers removed
- CRS checked
- Attribute tables cleaned
- Symbology is clear
- Labels are readable
Pop-Ups
- Important fields selected
- Field names are understandable
- Unnecessary fields removed
- Missing values checked
qgis2web
- Leaflet or OpenLayers selected
- Required layers enabled
- Layer panel configured
- Pop-ups tested
- Web preview checked
Performance
- Large datasets filtered
- Complex geometries simplified where appropriate
- Unnecessary features removed
- Web map tested on a normal internet connection
Publishing
- Complete export folder uploaded
-
index.htmlis present - Supporting files preserved
- Published URL tested
- Mobile view checked
Portfolio
- Project title included
- Problem statement included
- Data sources documented
- Methodology explained
- Interactive map linked
- GIS tools listed
- Results summarized
Conclusion
Learning how to create interactive web map QGIS projects is a practical way for GIS students to move beyond static cartographic outputs and begin developing Web GIS skills.
With qgis2web, a finished QGIS project can be converted into an interactive Leaflet or OpenLayers web map without requiring advanced programming knowledge. The workflow involves preparing clean vector data, designing meaningful pop-ups, configuring layers, previewing the map, exporting the web files, and hosting them online.
For a student building a web GIS portfolio, the most important goal is not simply producing a map that works. The project should communicate a complete spatial workflow:
problem → data → analysis → cartography → interaction → communication.
A strong portfolio can therefore combine your QGIS analysis with an interactive web map, a short methodology, documented data sources, and a clear explanation of your findings.
Once you are comfortable with qgis2web, the next step is to inspect the generated HTML, CSS, and JavaScript and gradually learn how Leaflet works underneath the export. That progression can take you from a GIS student using a plugin to a GIS analyst who can begin building customized Web GIS applications.
For a portfolio-focused student audience, this structure also gives you a natural path from QGIS → qgis2web → Leaflet → GitHub Pages → custom Web GIS development.