
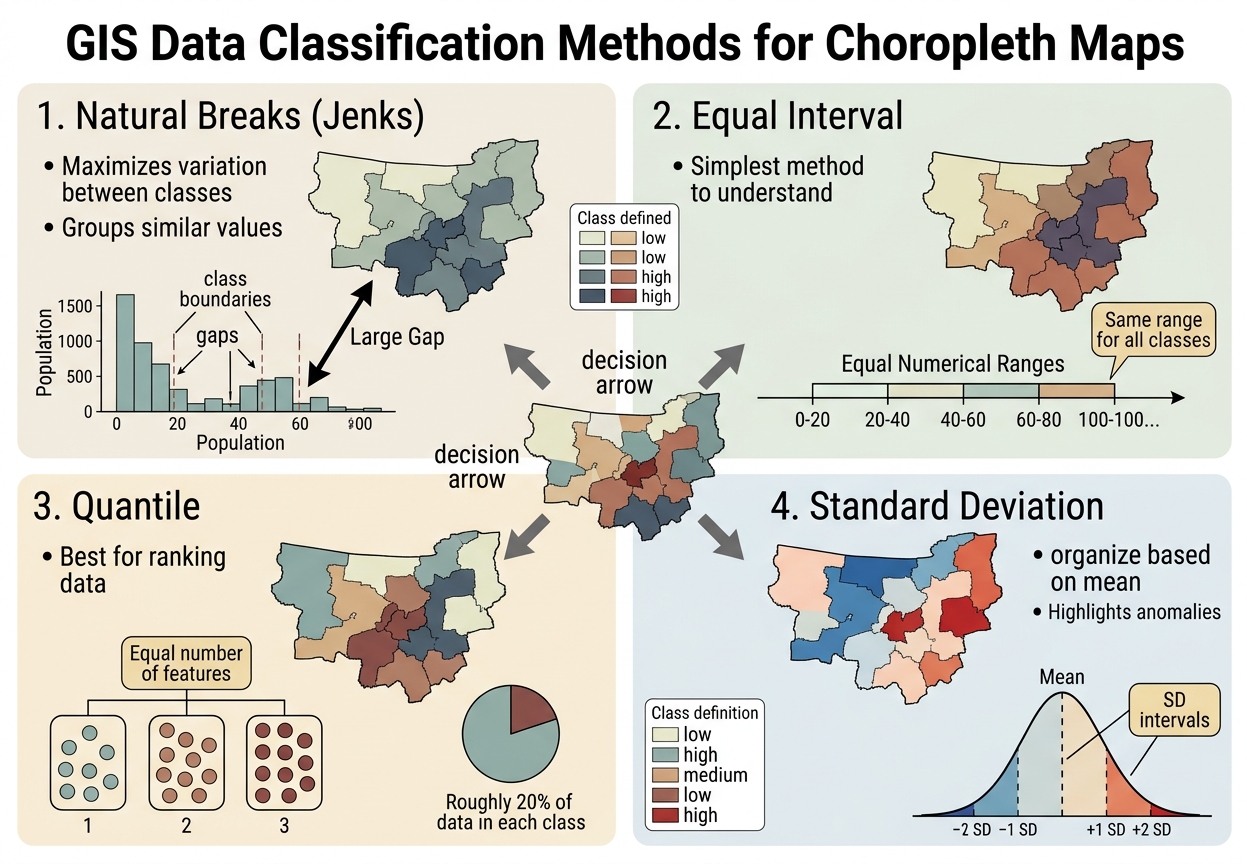
Data Classification Methods in GIS: Natural Breaks vs Equal Interval and Other Choropleth Methods
A choropleth map can make the same dataset tell very different visual stories depending on how numerical values are divided into classes. Data classification methods in GIS determine which observations are grouped together and therefore which areas appear “low,” “medium,” or “high” on the final map.
For GIS students, this is important because classification is not merely a formatting choice. A poor classification method can hide important variation, exaggerate differences, or create a misleading visual impression.
The four methods most commonly encountered in introductory GIS are:
- Natural Breaks (Jenks)
- Equal Interval
- Quantile
- Standard Deviation
Mastering these data classification methods in GIS prevents misinterpretation of spatial trends across choropleth maps.
1. Natural Breaks (Jenks)
Natural Breaks, also called Jenks Natural Breaks, attempts to place class boundaries where there are relatively large gaps in the data. When analyzing spatial data, choosing the right data classification methods in GIS helps highlight cluster patterns. Comparing different data classification methods in GIS helps analysts determine whether Jenks natural breaks best represent internal data groupings.
How it works
The algorithm searches for class boundaries that:
- Minimize variation within each class
- Maximize variation between classes
Imagine population values such as:
2, 3, 4, 5, 6, 8, 40, 45, 48, 52
There is a substantial gap between 8 and 40. Natural Breaks can recognize this separation and place a class boundary around it.
Best uses
Natural Breaks is particularly useful when:
- Data are skewed
- Values form recognizable clusters
- There are natural gaps between groups
- You want classes that reflect the structure of the dataset
It is commonly useful for mapping:
- Population
- Property values
- Crime counts
- Income
- Disease cases
- Other unevenly distributed socioeconomic data
Advantages
- Reflects the actual distribution of the data
- Can reveal meaningful clusters
- Often produces visually intuitive maps
- Useful for highly uneven datasets
Disadvantages
- Class boundaries depend on the particular dataset
- Two different datasets may produce completely different intervals
- Comparisons between maps can become difficult
- It may create classes with very unequal numerical ranges
Key idea: Natural Breaks asks, “Where does the data naturally separate?”
2. Equal Interval
Equal Interval divides the entire range of values into intervals of identical numerical width. When comparing spatial datasets, using standard data classification methods in GIS like Equal Interval keeps numerical ranges consistent.When reporting continuous spatial variables, standard data classification methods in GIS provide structured bounds for comparative reporting.
For example, suppose values range from 0 to 100 and you want five classes:
| Class | Range |
|---|---|
| 1 | 0–20 |
| 2 | 20–40 |
| 3 | 40–60 |
| 4 | 60–80 |
| 5 | 80–100 |
Every class covers exactly 20 units.
How it works
The calculation is essentially:
Class interval=Maximum−MinimumNumber of classes\text{Class interval} = \frac{\text{Maximum}-\text{Minimum}}{\text{Number of classes}}
Best uses
Equal Interval works well when:
- The data are relatively uniformly distributed
- The numerical range has meaningful interpretation
- You want the map reader to understand the magnitude of values
- The same class boundaries need to be applied consistently
It can be useful for variables such as:
- Temperature
- Rainfall
- Elevation
- Environmental measurements
Advantages
- Very easy to understand
- Class ranges have clear numerical meaning
- Useful for comparing maps when identical intervals are retained
- Simple to explain in an academic report
Disadvantages
If most observations are concentrated in a small part of the range, Equal Interval can produce classes containing very few or even no features.
For example, if most counties have populations between 0 and 30, but one city has a population of 100, several equal intervals may be dominated by that extreme value.
Key idea: Equal Interval asks, “How can I divide the numerical range into equal-sized pieces?”
3. Quantile Classification
Quantile classification creates classes containing approximately the same number of observations. When evaluating socioeconomic datasets, applying data classification methods in GIS such as Quantile helps rank geographic features into balanced categories.
For example, with 100 geographic features and five classes, each class would contain approximately 20 features.
The numerical ranges themselves may be very different.
Example
Suppose five classes are required:
| Class | Number of areas |
|---|---|
| Very Low | 20 |
| Low | 20 |
| Moderate | 20 |
| High | 20 |
| Very High | 20 |
The first class might cover a numerical range of only 0–10, while another could cover 10–100 if the data are highly skewed.
Best uses
Quantile works well when:
- You want each class to contain a similar number of geographic units
- You need strong visual differentiation across areas
- The objective is to rank observations
- The data distribution allows reasonably meaningful quantile groups
It can be useful for:
- Socioeconomic rankings
- Population comparisons
- Election participation rates
- Income rankings
- Index scores
Advantages
- Usually produces a visually balanced map
- Makes it easy to distinguish high- and low-ranking areas
- Avoids classes containing very few observations
- Useful when relative ranking is more important than absolute magnitude
Disadvantages
Quantile can exaggerate small numerical differences.
For example, values of:
48, 49, 50, 51
might be placed into different classes simply because the method needs to distribute observations evenly.
Conversely, very different values might be grouped into the same class.
Key idea: Quantile asks, “How can I divide the observations into similarly sized groups?”
4. Standard Deviation
Standard Deviation classification organizes values according to their distance from the mean. Selecting appropriate data classification methods in GIS ensures outlier values stand out clearly against regional averages.
genui{“learning_viz”:{“type_id”:”STANDARD_DEVIATION”,”initial_values”:{“sigma”:1.5}}}
Instead of focusing primarily on the minimum and maximum values, the method emphasizes whether observations are:
- Below the mean
- Near the mean
- Above the mean
- Far from the mean
A map might therefore contain categories such as:
More than 2 standard deviations below the mean
1–2 standard deviations below the mean
Within 1 standard deviation of the mean
1–2 standard deviations above the mean
More than 2 standard deviations above the mean
Best uses
Standard Deviation is particularly useful when:
- The mean is meaningful
- The data have a reasonably symmetric distribution
- You want to identify unusually high or low values
- The objective is to show deviation from an average
Potential applications include:
- Income relative to a regional mean
- Rainfall anomalies
- Population density deviations
- Temperature anomalies
- Crime rates relative to an average
Advantages
- Highlights unusually high and low values
- Provides statistical context
- Useful for identifying areas that depart substantially from the mean
- Particularly informative for approximately normally distributed data
Disadvantages
- Less intuitive for audiences unfamiliar with standard deviation
- Can work poorly with strongly skewed data
- Class boundaries may not correspond to meaningful real-world thresholds
Key idea: Standard Deviation asks, “How unusual is this value compared with the dataset’s mean?”
Quick Reference Matrix
| Classification Method | Best Data Type | Main Strength | Potential Visual Distortion |
|---|---|---|---|
| Natural Breaks (Jenks) | Skewed / clustered | Reveals natural groupings | Makes comparisons between different maps difficult |
| Equal Interval | Uniform / relatively even | Easy numerical interpretation | Can leave some classes nearly empty |
| Quantile | Ranked data / moderately distributed | Equal number of observations per class | Can exaggerate small differences |
| Standard Deviation | Normal / approximately symmetric | Shows deviation from mean | Can be misleading with highly skewed data |
Important: “Best data type” is a guideline, not a rigid rule. The appropriate classification depends on the purpose of the map, the distribution of the data, and the intended audience.
Why Classification Can Change the Visual Story
Imagine two neighborhoods with values of 49 and 51.
With one classification method, both may appear in the same class.
With another, they could fall into different classes and receive noticeably different colors.
Now imagine two other neighborhoods with values of 10 and 30. A different classification could place both into the same category.
This demonstrates an important cartographic principle:
The map does not simply display the data; the classification system determines how the data are visually grouped.
Therefore, a GIS analyst should avoid choosing a classification method merely because it produces the most attractive map.
Practical Recommendation: Inspect the Histogram First
Before selecting a classification method in ArcGIS Pro or QGIS, examine the distribution of the variable.Understanding different data classification methods in GIS allows you to choose the right data representation for your audience.
Look for:
1. Clusters
If the histogram shows distinct groups separated by gaps, Natural Breaks may be appropriate.
2. A relatively even distribution
If values are spread relatively evenly across the range, Equal Interval may work well.
3. Strong ranking requirements
If you need approximately equal numbers of areas in each category, consider Quantile.
4. A meaningful mean
If the research question concerns how much areas deviate from the average, consider Standard Deviation.
5. Extreme skewness or outliers
Be cautious. An extreme value can strongly influence methods based on the minimum and maximum range.
In QGIS
When styling a graduated layer, inspect the distribution of your attribute values before settling on a classification. QGIS provides classification options including:
- Equal Interval
- Quantile
- Natural Breaks (Jenks)
- Standard Deviation
- Pretty Breaks
Compare the resulting class boundaries and inspect how many features fall into each class. Experimenting with different data classification methods in GIS inside the layer style properties ensures your map effectively communicates spatial patterns.
In ArcGIS Pro
The Symbology pane’s graduated-colour classification tools allow you to compare classification methods and examine class breaks. Use the histogram to understand the distribution before deciding which classification communicates your variable appropriately. Comparing different data classification methods in GIS within the Symbology pane allows you to see how class breaks affect your map layout.
A Simple Decision Guide
Use this as a starting point:
Are there obvious clusters or gaps?
→ Consider Natural Breaks
Do you need equal numerical ranges?
→ Consider Equal Interval
Do you need roughly equal numbers of areas in each class?
→ Consider Quantile
Do you want to emphasize departures from the average?
→ Consider Standard Deviation
But always return to the research question.
For an academic GIS project, your report should ideally explain why you selected the classification method.
For example:
Natural Breaks (Jenks) classification was selected because the population values exhibited several distinct clusters, allowing the class boundaries to reflect the underlying distribution of the data.
That is considerably stronger than:
Natural Breaks was used because it looked better.
Final takeaway
There is no universally “best” data classification method in GIS. Natural Breaks, Equal Interval, Quantile, and Standard Deviation each emphasize different characteristics of the same dataset.Mastering these data classification methods in GIS ensures your choropleth maps remain accurate and unbiased.
Inspect the data distribution first, identify what you want the map to communicate, select an appropriate classification, and document that decision in your methodology.