
Client-Side Spatial Analysis in Web GIS Using Turf.js and Mapbox GL JS
1. Introduction to Client-Side Spatial Analysis in Web GIS Using Turf.js and Mapbox GL JS
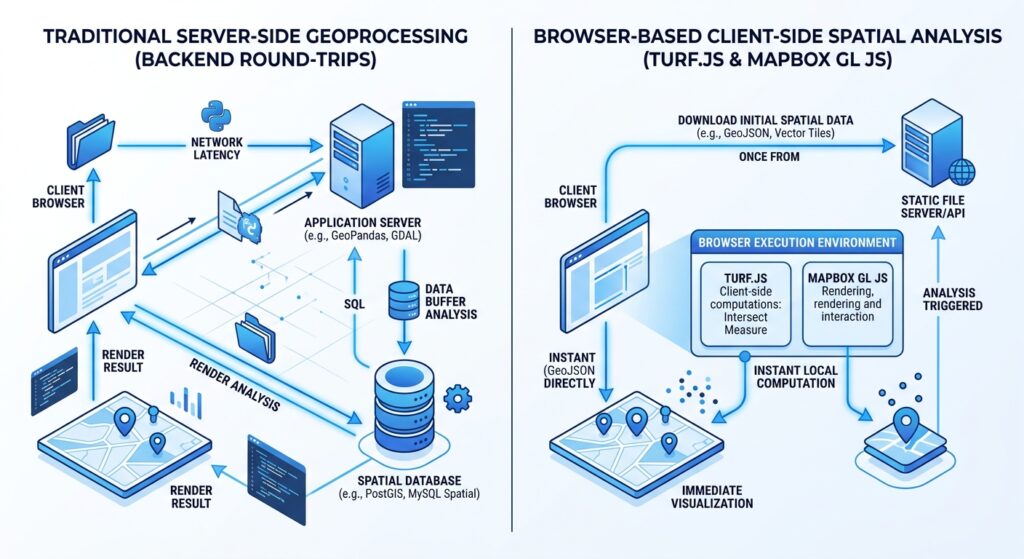
Traditional web GIS applications often send spatial queries to a backend service, which processes the request using a spatial database or geoprocessing engine before returning the results to the browser. This architecture is effective for large datasets, shared analytical services, and complex operations, but repeated network requests can introduce latency into interactive workflows.
Client-side spatial analysis offers another approach. By combining Turf.js with Mapbox GL JS, developers can execute many common geospatial operations directly in the user’s browser.
Turf.js is a JavaScript library for geospatial computing. It implements operations such as buffering, distance measurement, geometric intersections, convex hull generation, and point-in-polygon analysis. It accepts GeoJSON inputs and returns GeoJSON outputs, making it convenient to integrate with Mapbox GL JS.
Mapbox GL JS handles map rendering, vector and raster layers, interactive events, and user navigation. Turf.js supplies the spatial analysis engine. Together, they allow a web application to create geometries, evaluate spatial relationships, and update the map without sending every analysis request to a server.
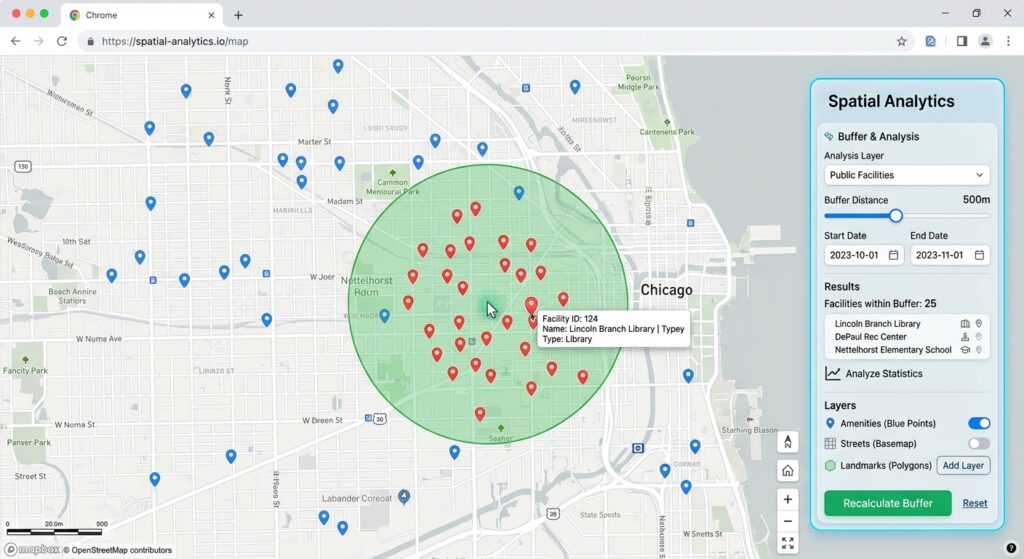
For example, a browser-based service-planning application can let a user click a location, generate an 800-metre buffer, and identify facilities inside the buffer immediately. The analysis can run locally as long as the necessary GeoJSON data is already available in the browser.
One distinction is important: client-side analysis does not eliminate all network traffic. The basemap, initial GeoJSON files, and other remote resources may still be downloaded. What it eliminates is the need for a server round-trip for each supported spatial calculation.
This tutorial develops an interactive Web GIS application with the following capabilities:
- Loading GeoJSON point features into a Mapbox map.
- Creating dynamic buffers around user-clicked coordinates.
- Generating a convex hull from multiple clicked locations.
- Identifying points contained within the resulting polygon.
- Displaying selected features and analytical geometries dynamically.
- Managing performance as the GeoJSON dataset grows.
2. Setting Up the Environment
2.1. Required technologies
| Technology | Responsibility |
|---|---|
| Mapbox GL JS | Basemap rendering, map interactions, and display layers |
| Turf.js | Client-side spatial operations |
| GeoJSON | Interchange format for spatial features |
| HTML and CSS | Application layout and interface |
| JavaScript | Event handling, analysis logic, and layer updates |
The example uses CDN-hosted libraries to keep the setup simple. For a larger production project, a package manager and a module bundler provide better dependency management.
2.2. Obtain a Mapbox access token
Mapbox GL JS requires a public access token to access Mapbox services.
- Create or access your account at https://account.mapbox.com/.
- Find your public access token, which typically begins with
pk.. - Replace the placeholder in the example code with your token.
A public token is visible in front-end source code by design. Restrict it to the appropriate website URLs and permissions. Never expose a secret token beginning with sk. in browser code.
2.3. Load the libraries
Mapbox’s CDN setup guide documents the required stylesheet and JavaScript bundle. Turf.js also provides browser bundles through CDNs.
Add the following dependencies to the HTML document’s <head> section:
<!-- Mapbox GL JS styles -->
<link
  href="https://api.mapbox.com/mapbox-gl-js/v3.33.0/mapbox-gl.css"
  rel="stylesheet"
/>

<!-- Mapbox GL JS rendering engine -->
<script src="https://api.mapbox.com/mapbox-gl-js/v3.33.0/mapbox-gl.js"></script>

<!-- Turf.js spatial analysis library -->
<script src="https://cdn.jsdelivr.net/npm/@turf/turf@7.4.0/turf.min.js"></script>
Turf.js exposes a global turf object when loaded using this browser bundle. The application can then call methods such as turf.buffer(), turf.convex(), and turf.pointsWithinPolygon().
Documentation:
- Mapbox GL JS CDN setup: https://docs.mapbox.com/mapbox-gl-js/guides/get-started/use-with-cdn/
- Turf.js installation: https://turfjs.org/docs/getting-started
2.4. Understand the GeoJSON coordinate system
The example uses GeoJSON coordinates in longitude-latitude order:
const location = turf.point([36.8219, -1.2864]);The first number is longitude; the second is latitude. These values represent a sample location near Nairobi, Kenya.
Do not reverse this order. GeoJSON uses [longitude, latitude], whereas many GIS interfaces display coordinates in latitude-longitude order.
Also distinguish between angular coordinates and linear distance units. GeoJSON point coordinates are not metres. Turf.js allows buffer distances to be specified explicitly in units such as metres or kilometres.
3. Step-by-Step Code Walkthrough
Step 1: Load vector point data into a Mapbox web map
The first step is to create the map and provide it with vector features to display.
For the demonstration, the facilities are embedded in the JavaScript as a GeoJSON FeatureCollection. The names and coordinates are illustrative, not verified real-world facilities.
In a production application, the same data could be loaded from a static GeoJSON file, an API, or another permitted data source.
Create a file named index.html and use the following application as your starting point:
<!DOCTYPE html>
<html lang="en">
<head>
  <meta charset="UTF-8" />
  <meta
    name="viewport"
    content="width=device-width, initial-scale=1.0"
  />

  <title>Client-Side Spatial Analysis with Turf.js</title>

  <link
    href="https://api.mapbox.com/mapbox-gl-js/v3.33.0/mapbox-gl.css"
    rel="stylesheet"
  />

  <script src="https://api.mapbox.com/mapbox-gl-js/v3.33.0/mapbox-gl.js"></script>

  <script src="https://cdn.jsdelivr.net/npm/@turf/turf@7.4.0/turf.min.js"></script>

  <style>
    /* Fill the browser window with the interactive map. */
    html,
    body {
      height: 100%;
      margin: 0;
      font-family: Arial, sans-serif;
    }

    #map {
      position: absolute;
      inset: 0;
    }

    /* Floating controls remain above the map canvas. */
    #panel {
      position: absolute;
      z-index: 2;
      top: 12px;
      left: 12px;
      width: min(320px, calc(100vw - 48px));
      padding: 16px;
      background: white;
      border-radius: 8px;
      box-shadow: 0 2px 12px rgba(0, 0, 0, 0.18);
      box-sizing: border-box;
    }

    #panel h1 {
      margin-top: 0;
      font-size: 19px;
    }

    #panel label {
      display: block;
      margin: 12px 0 5px;
      font-size: 14px;
      font-weight: bold;
    }

    #panel select,
    #panel input,
    #panel button {
      width: 100%;
      padding: 9px;
      box-sizing: border-box;
      font: inherit;
    }

    #panel button {
      margin-top: 12px;
      cursor: pointer;
    }

    #status,
    #matches {
      font-size: 13px;
      line-height: 1.5;
      overflow-wrap: anywhere;
    }
  </style>
</head>

<body>
  <div id="map"></div>

  <section id="panel">
    <h1>Browser-Based Spatial Analysis</h1>

    <p>
      Click the map to run a spatial operation locally.
    </p>

    <label for="analysis-mode">Analysis operation</label>
    <select id="analysis-mode">
      <option value="buffer">Buffer around clicked location</option>
      <option value="hull">Convex hull from clicked locations</option>
    </select>

    <label for="buffer-radius">Buffer radius (metres)</label>
    <input
      id="buffer-radius"
      type="number"
      min="50"
      max="5000"
      step="50"
      value="800"
    />

    <button id="clear-analysis" type="button">
      Clear analysis
    </button>

    <h2>Results</h2>
    <p id="status">Initializing the map...</p>
    <p><strong>Facilities inside polygon:</strong> <span id="match-count">0</span></p>
    <p id="matches">No analysis has been performed.</p>
  </section>

  <script>
    // Replace this placeholder with your Mapbox PUBLIC access token.
    mapboxgl.accessToken = "YOUR_MAPBOX_PUBLIC_ACCESS_TOKEN";

    // Demonstration point data.
    // These locations and facility names are illustrative.
    // GeoJSON positions are always [longitude, latitude].
    const siteData = {
      type: "FeatureCollection",
      features: [
        {
          type: "Feature",
          properties: { name: "Demo Clinic - CBD" },
          geometry: {
            type: "Point",
            coordinates: [36.8219, -1.2864]
          }
        },
        {
          type: "Feature",
          properties: { name: "Demo Library - Westlands" },
          geometry: {
            type: "Point",
            coordinates: [36.8040, -1.2675]
          }
        },
        {
          type: "Feature",
          properties: { name: "Demo Market - Kilimani" },
          geometry: {
            type: "Point",
            coordinates: [36.7875, -1.2925]
          }
        },
        {
          type: "Feature",
          properties: { name: "Demo School - Upper Hill" },
          geometry: {
            type: "Point",
            coordinates: [36.8110, -1.3001]
          }
        },
        {
          type: "Feature",
          properties: { name: "Demo Depot - Parklands" },
          geometry: {
            type: "Point",
            coordinates: [36.8190, -1.2637]
          }
        },
        {
          type: "Feature",
          properties: { name: "Demo Hub - Lavington" },
          geometry: {
            type: "Point",
            coordinates: [36.7750, -1.2825]
          }
        }
      ]
    };

    // A reusable, empty GeoJSON collection for clearing map layers.
    const emptyCollection = {
      type: "FeatureCollection",
      features: []
    };

    // Retains user-clicked points when building a convex hull.
    let hullPoints = [];

    // Create the Mapbox map.
    const map = new mapboxgl.Map({
      container: "map",
      style: "mapbox://styles/mapbox/streets-v12",
      center: [36.807, -1.282],
      zoom: 12
    });

    map.addControl(new mapboxgl.NavigationControl(), "top-right");

    // Cache UI elements so handlers can update them efficiently.
    const modeElement = document.getElementById("analysis-mode");
    const radiusElement = document.getElementById("buffer-radius");
    const statusElement = document.getElementById("status");
    const countElement = document.getElementById("match-count");
    const matchesElement = document.getElementById("matches");

    // Register data sources and layers only after the map style loads.
    map.on("load", () => {
      // Original data: all facilities.
      map.addSource("sites", {
        type: "geojson",
        data: siteData
      });

      // Polygon created by the current analysis.
      map.addSource("analysis-polygon", {
        type: "geojson",
        data: emptyCollection
      });

      // Location or locations selected by the user.
      map.addSource("clicked-points", {
        type: "geojson",
        data: emptyCollection
      });

      // Features that passed the spatial query.
      map.addSource("query-results", {
        type: "geojson",
        data: emptyCollection
      });

      // Draw the analysis polygon beneath the points.
      map.addLayer({
        id: "analysis-fill",
        type: "fill",
        source: "analysis-polygon",
        paint: {
          "fill-color": "#16a34a",
          "fill-opacity": 0.20
        }
      });

      map.addLayer({
        id: "analysis-outline",
        type: "line",
        source: "analysis-polygon",
        paint: {
          "line-color": "#15803d",
          "line-width": 2
        }
      });

      // Display every input point.
      map.addLayer({
        id: "site-points",
        type: "circle",
        source: "sites",
        paint: {
          "circle-radius": 6,
          "circle-color": "#2563eb",
          "circle-stroke-color": "#ffffff",
          "circle-stroke-width": 1.5
        }
      });

      // Display user-selected coordinates.
      map.addLayer({
        id: "clicked-point-symbols",
        type: "circle",
        source: "clicked-points",
        paint: {
          "circle-radius": 5,
          "circle-color": "#f59e0b",
          "circle-stroke-color": "#ffffff",
          "circle-stroke-width": 2
        }
      });

      // Highlight points inside the analysis polygon.
      map.addLayer({
        id: "query-result-points",
        type: "circle",
        source: "query-results",
        paint: {
          "circle-radius": 8,
          "circle-color": "#dc2626",
          "circle-stroke-color": "#ffffff",
          "circle-stroke-width": 2
        }
      });

      statusElement.textContent =
        "Ready. Click the map to begin.";

      // This click handler runs all spatial calculations in the browser.
      map.on("click", (event) => {
        const clickedPoint = turf.point([
          event.lngLat.lng,
          event.lngLat.lat
        ]);

        if (modeElement.value === "buffer") {
          // BUFFER MODE:
          // Generate a new buffer around the clicked coordinate.
          hullPoints = [];

          const radius = Number(radiusElement.value);

          // Validate the radius before calling Turf.js.
          if (!Number.isFinite(radius) || radius < 50 || radius > 5000) {
            statusElement.textContent =
              "Enter a buffer radius between 50 and 5000 metres.";
            return;
          }

          // `units: "meters"` makes the intended distance explicit.
          // More steps generally create a smoother polygon.
          const bufferPolygon = turf.buffer(
            clickedPoint,
            radius,
            {
              units: "meters",
              steps: 32
            }
          );

          map.getSource("clicked-points").setData(clickedPoint);

          runPolygonQuery(
            bufferPolygon,
            `Buffer generated: ${radius} metres.`
          );

          return;
        }

        // CONVEX HULL MODE:
        // Add the clicked coordinate to the collection.
        hullPoints.push(clickedPoint);

        map.getSource("clicked-points").setData(
          turf.featureCollection(hullPoints)
        );

        // A polygon cannot be constructed from fewer than three
        // non-collinear locations.
        if (hullPoints.length < 3) {
          map.getSource("analysis-polygon").setData(emptyCollection);
          map.getSource("query-results").setData(emptyCollection);

          countElement.textContent = "0";
          matchesElement.textContent = "No polygon has been created yet.";

          statusElement.textContent =
            `Selected ${hullPoints.length} location(s). Click at least three non-collinear locations.`;

          return;
        }

        // Calculate the convex hull around all selected points.
        const hullPolygon = turf.convex(
          turf.featureCollection(hullPoints)
        );

        // Coincident or collinear inputs might not produce a polygon.
        if (!hullPolygon) {
          map.getSource("analysis-polygon").setData(emptyCollection);
          map.getSource("query-results").setData(emptyCollection);

          countElement.textContent = "0";
          matchesElement.textContent = "No valid hull is available.";

          statusElement.textContent =
            "Select at least three non-collinear locations.";
          return;
        }

        runPolygonQuery(
          hullPolygon,
          `Convex hull generated from ${hullPoints.length} locations.`
        );
      });

      // Clear analytical outputs while retaining the original dataset.
      function clearAnalysis() {
        hullPoints = [];

        map.getSource("analysis-polygon").setData(emptyCollection);
        map.getSource("clicked-points").setData(emptyCollection);
        map.getSource("query-results").setData(emptyCollection);

        countElement.textContent = "0";
        matchesElement.textContent = "No analysis has been performed.";
        statusElement.textContent = "Analysis cleared. Click the map to begin.";
      }

      document
        .getElementById("clear-analysis")
        .addEventListener("click", clearAnalysis);

      modeElement.addEventListener("change", clearAnalysis);
    });

    /**
     * Draw a polygon and find all demo sites that lie within it.
     *
     * @param {Object} polygon A Turf.js polygon feature.
     * @param {string} message A short description of the operation.
     */
    function runPolygonQuery(polygon, message) {
      if (!polygon) {
        statusElement.textContent = "The operation did not produce a polygon.";
        return;
      }

      // Update the geometry layer without rebuilding the map.
      map.getSource("analysis-polygon").setData(polygon);

      // Test the points against the analysis polygon.
      // This calculation runs locally; there is no analysis API call.
      const matches = turf.pointsWithinPolygon(
        siteData,
        polygon
      );

      // Send only the selected features to the highlighting layer.
      map.getSource("query-results").setData(matches);

      // Update the interface with the query results.
      countElement.textContent = String(matches.features.length);

      if (matches.features.length === 0) {
        matchesElement.textContent = "No demo facilities found inside the polygon.";
      } else {
        const names = matches.features.map(
          (feature) => feature.properties.name
        );

        // textContent avoids treating feature properties as HTML.
        matchesElement.textContent = names.join(", ");
      }

      statusElement.textContent =
        `${message} Spatial analysis completed in the browser.`;
    }

    // Report errors to the browser console during development.
    map.on("error", (event) => {
      console.error("Mapbox GL JS error:", event.error);
    });
  </script>
</body>
</html>
How to run the application
- Replace
YOUR_MAPBOX_PUBLIC_ACCESS_TOKENwith your public token. - Save the file as
index.html. - Serve it from a local development server, such as the VS Code Live Server extension, rather than relying on direct file opening. This also prepares the project for loading external GeoJSON resources.
- Open the page in a WebGL2-compatible browser.
- Click the map in buffer mode. Adjust the radius and click again to recalculate.
- Change to convex hull mode and click at least three non-collinear locations. Each new point updates the hull and facility query.
- Use Clear analysis to remove the current geometry and results.
Step 2: Calculate dynamic buffers or convex hulls
The central operation in an interactive Web GIS is transforming user input into a spatial geometry.
A. Buffer analysis using turf.buffer()
A buffer creates a polygon around a point, line, or other supported geometry at a specified distance.
For a point (P) and buffer radius (r), the buffer can be expressed conceptually as:
[
B(P,r)={x\mid d(x,P)\leq r}
]
where (d(x,P)) is the geographic distance from a location (x) to the input point.
The key Turf.js call is:
const clickedPoint = turf.point([
  event.lngLat.lng,
  event.lngLat.lat
]);

const radiusMeters = 800;

const bufferPolygon = turf.buffer(
  clickedPoint,
  radiusMeters,
  {
    units: "meters",
    steps: 32
  }
);
The logic has four stages:
- Read the map click event.
- Convert the clicked longitude and latitude into a GeoJSON Point feature.
- Pass the point, radius, and unit to
turf.buffer(). - Receive a polygon that can be drawn or passed to another spatial operation.
The steps parameter controls how many segments approximate each quadrant of the buffer. A larger value produces a smoother-looking boundary but adds vertices to the geometry. The default is eight, so 32 segments is a useful demonstration setting rather than a universal performance optimum.
Turf’s buffer documentation is available at https://turfjs.org/docs/api/buffer.
B. Convex hull generation using turf.convex()
A convex hull creates a polygon enclosing a collection of points. It is useful for visualizing the overall footprint of selected locations, such as a group of observation sites or facilities.
Unlike a buffer, a hull requires several input coordinates.
// Convert user-selected Point features into a FeatureCollection.
const selectedPoints = turf.featureCollection(hullPoints);

// Calculate the convex hull.
const hullPolygon = turf.convex(selectedPoints);

if (hullPolygon) {
  // The result can be drawn or used in a spatial query.
  map.getSource("analysis-polygon").setData(hullPolygon);
}
Three or more non-collinear locations are required to form a polygon. The function can return no polygon if the input does not define a valid two-dimensional hull.
A convex hull may include empty spaces between scattered input points because it encloses them using a convex boundary. It is therefore not equivalent to a detailed administrative boundary or a service area following road networks.
Turf’s API reference explains the operation at https://turfjs.org/docs/api/convex.
Step 3: Perform point-in-polygon queries in the browser
Generating a polygon is only part of a spatial analysis workflow. Many Web GIS applications must also identify which features satisfy a spatial condition.
For example, a utility planner might need to identify every facility within 800 metres of a proposed service location. A conservation application could select monitoring sites inside a study area.
Turf.js provides turf.pointsWithinPolygon() for this operation.
// siteData is a GeoJSON FeatureCollection of Point features.
// bufferPolygon is a Polygon or MultiPolygon feature.

const facilitiesInside = turf.pointsWithinPolygon(
  siteData,
  bufferPolygon
);

console.log(
  "Facilities inside polygon:",
  facilitiesInside.features.length
);
The function evaluates the input points against the polygon and returns a FeatureCollection containing the points within at least one supplied polygon.
This operation is distinct from querying the visible map canvas. The input is the GeoJSON dataset itself, not simply whatever happens to be visible at the current zoom level.
Consequently, the query can return a point even when the point is not currently visible because of the map’s viewport or styling. Conversely, the query cannot find features that were never loaded into the browser’s dataset.
The official reference is https://turfjs.org/docs/api/pointsWithinPolygon.
Understanding the result
Suppose the original dataset contains 500 facilities. A buffer is generated around the user’s click, and 18 features satisfy the point-in-polygon test.
The returned FeatureCollection contains the 18 matching points and their properties. The application can use it to:
- Update the number of matching facilities.
- Highlight matching points on the map.
- Display names and other attributes.
- Calculate additional summary statistics.
- Export the selection as GeoJSON.
The important architectural principle is that the input features and polygon are already in the browser. Turf.js can perform the query without making an HTTP request to a spatial-processing endpoint.
Step 4: Render analysis results dynamically without server round-trips
Mapbox GL JS separates data sources from visual layers. This makes it possible to update a geometry or result dataset without recreating the whole map.
The complete application creates these four sources:
| Source | Purpose |
|---|---|
sites |
Original point dataset |
analysis-polygon |
Current buffer or hull |
clicked-points |
User-selected locations |
query-results |
Points that pass the spatial query |
The operation below updates the current polygon:
map.getSource("analysis-polygon").setData(bufferPolygon);The results layer can be updated separately:
map.getSource("query-results").setData(facilitiesInside);setData() updates the data for a GeoJSON source, allowing Mapbox GL JS to refresh the corresponding rendered features.
Reference: https://docs.mapbox.com/mapbox-gl-js/api/sources/#geojsonsource.
Keeping source data separate from layer styling has practical benefits. The application can preserve the original facility layer, highlight selected features in a different colour, and clear the analysis output without discarding the original data.
The application therefore follows this sequence:
- Receive a map interaction.
- Generate the analysis geometry with Turf.js.
- Pass the geometry and original points to the spatial query.
- Update the polygon and result sources.
- Refresh the result count and list.
No backend geoprocessing request is needed for these individual operations.
4. Loading External GeoJSON Data
The demonstration embeds its point dataset in JavaScript so that the spatial logic is easy to follow. Larger applications usually load their vector data from a static file or API.
A simple example is:
async function loadFacilities() {
  const response = await fetch("./data/facilities.geojson");

  if (!response.ok) {
    throw new Error(
      `Failed to load facilities: HTTP ${response.status}`
    );
  }

  const geojson = await response.json();

  // Basic input validation.
  if (
    geojson.type !== "FeatureCollection" ||
    !Array.isArray(geojson.features)
  ) {
    throw new Error("Expected a GeoJSON FeatureCollection.");
  }

  // Each feature must be a point for this specific workflow.
  for (const feature of geojson.features) {
    if (
      !feature.geometry ||
      feature.geometry.type !== "Point" ||
      !Array.isArray(feature.geometry.coordinates)
    ) {
      throw new Error("The input contains a non-Point feature.");
    }
  }

  return geojson;
}
After loading the data successfully, use the returned FeatureCollection in place of the illustrative siteData object.
If the dataset is loaded asynchronously, the application should wait for it before enabling the analysis controls. It should also handle missing files, malformed GeoJSON, unsupported geometries, and network errors.
For large remote datasets, avoid fetching the entire dataset unnecessarily. Retrieve an appropriate subset or use spatially partitioned data when the application permits it.
5. Performance Considerations for Client-Side Geoprocessing
JavaScript geospatial computing can make an application feel responsive, but the browser remains subject to CPU, memory, and rendering constraints.
5.1. Understand the cost of repeated spatial queries
The demonstration evaluates all points whenever the user creates a new polygon. If there are (N) points and the query examines every point, the basic workload grows approximately in proportion to (N), excluding the cost of the individual geometry tests.
That approach is reasonable for small datasets. With hundreds of thousands or millions of points, repeating a full scan after every click may cause noticeable delays.
The first optimization is to restrict the candidate set before performing expensive geometric tests.
For example:
function queryPointsWithinPolygon(allPoints, polygon) {
  // Calculate the geographic bounding box of the polygon.
  const [minX, minY, maxX, maxY] = turf.bbox(polygon);

  // Keep only point features that fall within the bounding box.
  const candidates = allPoints.features.filter((feature) => {
    const [longitude, latitude] = feature.geometry.coordinates;

    return (
      longitude >= minX &&
      longitude <= maxX &&
      latitude >= minY &&
      latitude <= maxY
    );
  });

  // The polygon test is now applied to the candidate subset.
  return turf.pointsWithinPolygon(
    turf.featureCollection(candidates),
    polygon
  );
}
This bounding-box prefilter reduces the number of expensive point-in-polygon tests when most features fall outside the polygon. However, it still scans every input feature to build the candidate set. For large datasets, a spatial index such as RBush or Flatbush can locate candidate features more efficiently.
5.2. Use a Web Worker for expensive computations
Turf.js calculations are generally synchronous. A long-running operation on the main JavaScript thread can prevent the interface from responding smoothly until the calculation finishes.
A Web Worker allows analysis to run on a separate thread. A production implementation can move the Turf operations into a worker and return only the selected features or summary statistics to the main thread.
When implementing this pattern, consider the cost of copying large GeoJSON objects between threads and whether the same source data can be kept in the worker across multiple queries.
5.3. Avoid repeatedly replacing the entire dataset
Mapbox GL JS processes GeoJSON source data to render it. Replacing a very large source after every minor interaction can become expensive even when the Turf calculation itself is quick.
A more efficient pattern is to keep the original dataset stable and update only the polygon and selected-feature sources, as shown in the example.
If users only need to view the data at small scales, clustering or vector tiles may be appropriate for rendering. However, clustering is a display and aggregation strategy, not a substitute for exact point-in-polygon analysis on the complete original dataset.
5.4. Choose the correct processing architecture
| Dataset or workload | Suitable approach |
|---|---|
| Small GeoJSON layer and simple interactive queries | Turf.js in the browser |
| Moderate dataset with repeated spatial queries | Candidate filtering and a spatial index |
| Expensive calculations or complex geometry processing | Web Workers and careful profiling |
| Very large data, concurrent users, or authoritative shared results | Server-side spatial processing |
| Large-scale web map display | Vector tiles or other partitioned data delivery |
Client-side analysis is particularly valuable when low interaction latency and local user exploration matter more than centralized processing.
Server-side analysis remains useful when datasets are too large to download, permissions must be enforced, calculations are computationally expensive, or results must be reproducible and consistent across users.
5.5. Be careful with units, geometry, and accuracy
A buffer distance is only meaningful when its units are specified correctly. In the example, the user enters metres and Turf receives { units: "meters" }. Do not pass a metre value while accidentally treating it as kilometres.
The result should also be interpreted within Turf’s geometry model. Buffer polygons approximate circular shapes using vertices; increasing steps improves visual smoothness but does not create infinitely precise boundaries.
For applications requiring high-accuracy engineering measurements, country-specific legal boundaries, or operations in specialized coordinate reference systems, validate the output against the applicable projected-coordinate workflow or authoritative geospatial engine.
6. Conclusion
Client-side spatial analysis in Web GIS expands an interactive map from a visualization interface into an environment where users can create and evaluate geometries immediately.
Mapbox GL JS supplies the interactive map, GeoJSON sources, and rendering layers. Turf.js supplies operations such as buffering, convex hull generation, and point-in-polygon queries.
The workflow developed in this tutorial demonstrates how to:
- Load vector point data into a Mapbox map.
- Turn user clicks into buffers or convex hulls.
- Query the original data with
turf.pointsWithinPolygon(). - Update analytical layers with
GeoJSONSource.setData(). - Improve performance through filtering, indexing, and worker-based processing where appropriate.
The resulting pattern is useful for site selection, service coverage, field-data exploration, environmental monitoring, and other applications that benefit from interactive spatial queries.
The main design principle is to perform lightweight analysis locally when it improves responsiveness, while choosing a backend or hybrid architecture when data volume, computational complexity, access control, or analytical requirements demand it. Ultimately, mastering Client-Side Spatial Analysis in Web GIS Using Turf.js and Mapbox GL JS enables fast, responsive browser-based geoprocessing without backend latency.
References
- Mapbox GL JS documentation: https://docs.mapbox.com/mapbox-gl-js/guides/
- Mapbox GL JS GeoJSON sources: https://docs.mapbox.com/mapbox-gl-js/api/sources/
- Turf.js documentation: https://turfjs.org/docs/getting-started
- Turf.js buffer: https://turfjs.org/docs/api/buffer
- Turf.js convex hull: https://turfjs.org/docs/api/convex
- Turf.js point-in-polygon collection query: https://turfjs.org/docs/api/pointsWithinPolygon