
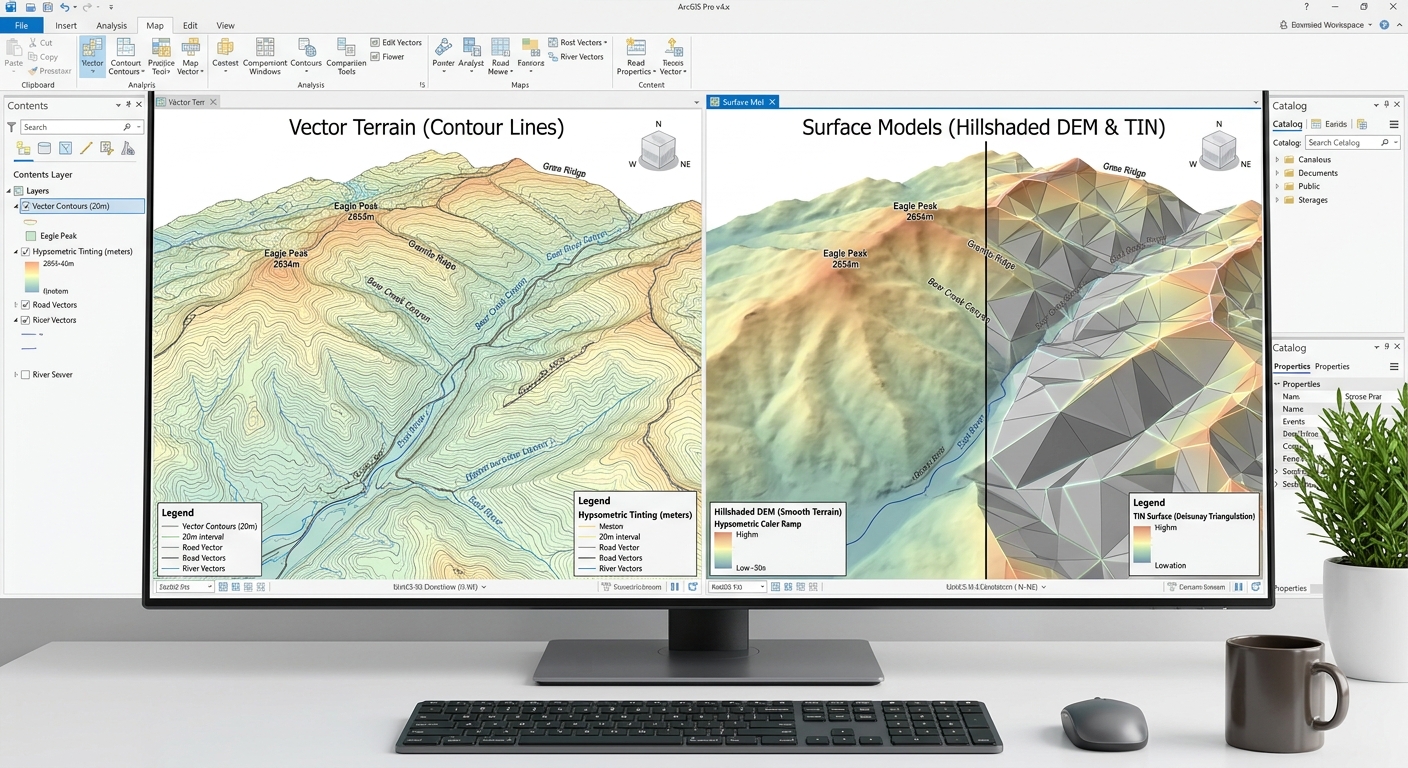
How to Convert Elevation Contour Lines into a DEM/TIN in QGIS & ArcGIS Pro
Introduction: Why Convert Contour Lines into a Terrain Surface?
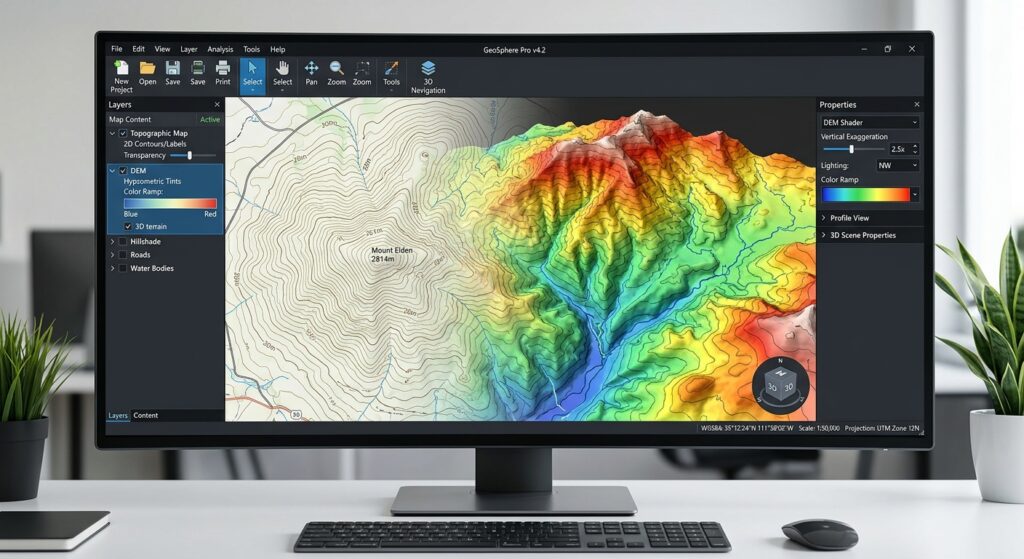
Convert Elevation Contour Lines into a DEM TIN efficiently using this complete workflow for topographic vector features in GIS. They are commonly found on topographic maps and are used to represent landforms such as hills, valleys, ridges, and slopes.
Although contour lines are useful for visualizing terrain, many GIS operations require a continuous elevation surface. For example, calculating slope, deriving aspect, modeling surface runoff, and creating 3D terrain visualizations are often performed using a Digital Elevation Model (DEM) or a Triangulated Irregular Network (TIN).
Converting contour lines to a DEM or TIN involves interpolating elevations between the known contour lines to estimate the terrain surface.
Two common representations are available:
- Digital Elevation Model (DEM): A raster grid in which each cell stores an estimated elevation value.
- Triangulated Irregular Network (TIN): A surface represented by connected, non-overlapping triangles whose vertices store elevation information.
Both can represent terrain, but they use different data structures and interpolation methods.
This tutorial explains how to convert contour lines to a DEM or TIN in QGIS and ArcGIS Pro, including data preparation, tool configuration, surface-quality assessment, and troubleshooting.
1. Prerequisites: Prepare Your Contour Data
Before creating a terrain surface, ensure that your contour dataset contains reliable elevation information.
1.1 Inspect the elevation attribute
Load your contour layer into QGIS or ArcGIS Pro and open its attribute table.
A typical contour dataset might contain:
| Contour_ID | ELEV_M | Contour_Type |
|---|---|---|
| C001 | 100 | Index |
| C002 | 105 | Intermediate |
| C003 | 110 | Index |
| C004 | 115 | Intermediate |
| C005 | 120 | Index |
In this example, ELEV_M contains the elevation of each contour in meters.
Your elevation field may instead be named ELEV, HEIGHT, CONTOUR, or Z_VALUE. The important requirement is that it stores the correct elevation for each line.
Check that:
- The elevation field contains numeric values.
- Every contour has the correct elevation.
- The horizontal coordinate system is suitable for your study area.
- The horizontal and vertical measurement units are known.
- The contour lines contain no unexplained gaps, duplicates, or incorrect elevation assignments.
- The contour interval and source-map scale are documented.
If your line geometries are two-dimensional, use the elevation attribute rather than assuming that the geometry contains valid Z coordinates.
1.2 Reproject the contour layer
Interpolation should generally use a suitable projected coordinate reference system (CRS), particularly when you intend to calculate slope, aspect, or distances.
For a study area in Kenya, for example, an appropriate UTM zone may be suitable depending on the location and required accuracy. Select the CRS based on the actual study extent rather than automatically choosing the same projection for every project.
A suitable projected CRS helps ensure that cell size and horizontal distances are expressed in meaningful linear units.
1.3 Understand the limitations of contour-based interpolation
Contour lines do not contain all the information required to reconstruct the exact original terrain.
For example, a broad hill between two contour lines may have an unknown summit elevation unless a spot height or other elevation observation is available. A DEM generated from contours is therefore an estimated surface, not a recovery of every detail of the original landscape.
The contour interval, source-map quality, spatial coverage, and interpolation method all affect the result.
2. Workflow in QGIS: Creating an Elevation Raster from Contours
QGIS provides a built-in TIN Interpolation tool for creating a raster surface from vector data. You can also use Inverse Distance Weighted (IDW) interpolation when working with elevation sample points derived from contours.
For terrain reconstruction, start with TIN interpolation because it can use line features to constrain the surface.
Step 1: Load the contour layer into QGIS
Open QGIS and create a new project or open an existing one.
From the menu, select:
Layer → Add Layer → Add Vector Layer
Browse to your contour dataset and click Add.
Supported formats include Shapefile, GeoPackage, and other vector formats supported by your QGIS installation.
Open the attribute table and verify the elevation field.
If your layer is stored in a geographic CRS, use:
Processing Toolbox → Reproject Layer
Choose an appropriate projected CRS for the study area and save the output as a new layer.
For example:
Contours_Projected.gpkg
Keeping a separate projected copy helps preserve the original data.
Step 2: Open the TIN Interpolation tool
Open the Processing Toolbox by selecting:
Processing → Toolbox
Search for:
TIN Interpolation
Open the tool listed under the Interpolation group.
QGIS TIN interpolation constructs a triangulated surface using the selected input features, then interpolates values within the triangles. The output can include an interpolated raster and an optional triangulation-edge layer. See the QGIS Interpolation documentation.
Step 3: Configure the interpolation input
In the TIN Interpolation dialog, add your contour layer as an input.
Configure the interpolation settings as follows:
| Parameter | Recommended configuration |
|---|---|
| Input layer | Contours_Projected |
| Interpolation attribute | ELEV_M |
| Use Z-coordinate | Disabled if elevation is stored in the attribute field |
| Feature type | Structured lines, where appropriate for the contour constraints |
| Interpolation method | Linear for a baseline surface |
| Extent | Study area or a suitably buffered extent |
| Output raster | DEM_TIN.tif |
| Triangulation output | Optional triangulation-edge layer |
The feature-type choices determine how QGIS interprets the input geometry. Contours represent continuous lines of known elevation, whereas breaklines are generally intended for features where a significant change in terrain continuity must be represented, such as a cliff edge or river bank.
Use the elevation field associated with the contour layer. Do not enable Z-coordinate interpolation unless the line geometry actually contains meaningful elevation coordinates.
Step 4: Select the interpolation method
The QGIS TIN Interpolation tool supports linear and Clough-Tocher cubic interpolation.
Linear interpolation is a useful baseline because it produces a piecewise planar surface within the triangulation.
Clough-Tocher cubic interpolation can produce a smoother surface, but smoother appearance does not automatically mean greater terrain accuracy.
Run the linear method first. If a smoother surface is required, compare the cubic result against the contours and independent elevation observations, where available.
Step 5: Set the output extent and raster resolution
The output extent determines where the raster is created, while the pixel size determines the spacing of its grid cells.
For example, a 10-meter output cell size produces a nominal grid spacing of 10 meters. This does not mean that the resulting DEM has 10-meter terrain accuracy.
Choose a resolution supported by the input data and research purpose. Making cells much smaller than the information content of the original contour data may increase file size without improving the true accuracy of the surface.
For reproducible analysis, use consistent output extents, cell sizes, and raster alignment when generating terrain models for multiple study areas or dates.
Step 6: Run the interpolation
Click Run.
QGIS creates the interpolated raster and, if selected, a layer representing the triangulation edges.
Save the raster to a permanent location, such as:
DEM_TIN.tif
Do not leave an important analytical result only as a temporary processing layer.
What did QGIS produce?
The raster is a continuous grid of estimated elevation values suitable for subsequent raster-based terrain analysis.
The optional triangulation output shows the edges of the triangles used in the interpolation. It is useful for inspecting the underlying triangulation, but it is not the same as an ArcGIS-style persistent, editable TIN dataset.
Step 7: Alternative QGIS method — IDW interpolation
Inverse Distance Weighted interpolation estimates an unknown elevation using nearby sample points, assigning greater influence to points closer to the location being estimated.
However, QGIS’s standard IDW Interpolation tool accepts point input, not contour lines directly. To apply IDW to contour data, you first need to derive elevation sample points from the lines.
Follow these steps:
- Open the Processing Toolbox and search for Densify by Interval.
- Apply it to the contour layer to add vertices along the lines at a suitable interval.
- Search for Extract Vertices and create a point layer from the densified contours.
- Confirm that the extracted points retain the correct elevation attribute.
- Search for IDW Interpolation in the Processing Toolbox.
- Select the extracted point layer as the input.
- Set the interpolation attribute to
ELEV_M. - Choose the output extent and pixel size.
- Set the output raster to
DEM_IDW.tif. - Run the tool and inspect the result.
The spacing used to densify the contours affects the sample distribution and computational cost. Avoid creating extremely dense points without a clear reason.
Important: IDW applied to vertices sampled from contour lines does not enforce the entire contour geometry as an elevation constraint. The resulting surface can differ from the source contour elevations between the sampled points. For many contour-based terrain workflows, TIN interpolation or a contour-aware method is more appropriate.
The QGIS documentation describes the IDW interpolation algorithm and its behavior.
3. Workflow in ArcGIS Pro: Creating a DEM with Topo to Raster
ArcGIS Pro provides several tools for terrain interpolation. The appropriate choice depends on whether you need a regular raster DEM or a triangulated surface model.
For creating a raster from contour lines, Topo to Raster is a particularly useful option because it is designed to produce a hydrologically appropriate terrain surface from topographic inputs.
Topo to Raster is available through the Spatial Analyst toolset and requires the relevant extension license. See the official Topo to Raster documentation.
Step 1: Add the contour data
Open ArcGIS Pro and load the contour feature class into a map.
Use the ribbon:
Map → Add Data
Browse to the contour dataset and add it.
Open the attribute table and identify the elevation field, such as ELEV_M.
Check that the elevation values are numeric and that the spatial reference and units are suitable for the analysis.
If necessary, reproject the contours using:
Analysis → Tools → Project
Choose a suitable projected coordinate system for the study area.
Step 2: Open Topo to Raster
Go to:
Analysis → Tools
In the Geoprocessing pane, search for:
Topo to Raster
Open the Spatial Analyst version of the tool.
This tool interpolates a raster surface from supported elevation-related inputs. When the input type is Contour, it uses contour geometry and elevation information to help reconstruct the terrain morphology.
Step 3: Configure the contour inputs
In the Topo to Raster parameters, add an input feature entry with the following settings:
| Parameter | Example setting |
|---|---|
| Input feature data | Contours_Projected |
| Field | ELEV_M |
| Type | Contour |
| Output surface raster | DEM_TopoToRaster |
| Output cell size | A suitable value based on source-data detail |
| Output extent | Defined analysis extent, preferably with an input-data margin |
Make sure you select the Contour input type rather than Point Elevation.
The field must contain the elevation represented by each contour line. The tool cannot reconstruct meaningful elevations if the wrong attribute is supplied.
If known streams, lake boundaries, sinks, or other terrain constraints are available and relevant to the study, consider whether they should be added as additional inputs. Such features can improve the representation of drainage or terrain structure when their geometry and attributes are reliable.
Step 4: Set the output cell size
Choose a raster cell size appropriate for the original contour interval, source-map scale, study extent, and intended analysis.
For example, a 10-meter cell size can be suitable for some regional datasets, but it is not a universal requirement. A coarser source dataset may not justify a fine output grid.
You should also verify that the output raster’s spatial reference and elevation units are appropriate for later slope, aspect, and hydrological calculations.
Step 5: Define the output extent carefully
Interpolation near the edge of the input dataset can be less reliable because observations are not available on every side of the output cells.
Where appropriate, interpolate using a buffered area that extends beyond the final study boundary, then clip the raster to the required extent afterward.
The Topo to Raster documentation recommends a margin between the output extent and the input-data extent to reduce edge-related interpolation problems. The exact settings should reflect the size and distribution of the available terrain inputs.
Step 6: Run Topo to Raster
Click Run.
ArcGIS Pro generates the output raster, which you can save as:
DEM_TopoToRaster.tif
Add the raster to the map and inspect the surface. The resulting DEM can be used for raster-based slope, aspect, hillshade, and other terrain analyses.
If drainage or hydrological characteristics are important to your study, validate the generated surface rather than assuming that the tool automatically reproduces every stream, sink, or ridge correctly.
4. Workflow in ArcGIS Pro: Creating a TIN Surface with Create TIN
If your objective is to create an actual TIN rather than a regular raster grid, use the Create TIN geoprocessing tool.
A TIN represents a surface through connected triangular facets. Unlike a DEM, its nodes are irregularly distributed rather than arranged on a regular grid.
ArcGIS Pro requires the 3D Analyst extension for the Create TIN tool. See the official Create TIN documentation.
Step 1: Open Create TIN
In ArcGIS Pro, navigate to:
Analysis → Tools
Search for:
Create TIN
Open the tool in the Geoprocessing pane.
Step 2: Set the output TIN and coordinate system
Enter an output name, for example:
Terrain_TIN
Select an appropriate projected coordinate system for the output TIN.
A projected coordinate system is recommended rather than a geographic coordinate system because the triangulation process depends on planar geometry and distance relationships.
Step 3: Configure the contour input features
In the Input Feature Class parameter table, add the contour layer.
Configure its parameters:
| Parameter | Example setting |
|---|---|
| Input Features | Contours_Projected |
| Height Field | ELEV_M |
| Type | Soft Line, where appropriate for continuous contour constraints |
| Tag Field | Optional, if a relevant integer attribute is needed |
For 2D contours that store elevation in an attribute, select that numeric field as the Height Field. If the geometry genuinely contains valid Z coordinates, Shape.Z may be used instead.
A Soft Line is generally appropriate when a line constrains a continuous surface rather than representing a sharp elevation discontinuity. Use a hard-line representation for actual terrain breaks, such as cliffs, where that distinction is supported by the source data.
Do not confuse the contour lines themselves with cliff breaklines. Contours connect points of equal elevation; they do not inherently define vertical terrain discontinuities.
Step 4: Run Create TIN
Click Run.
ArcGIS Pro constructs the triangulated surface from the specified input geometry and elevation information.
The resulting TIN can be inspected in a map or scene. Triangle shapes and spacing reflect the input geometry and triangulation method, so the quality of the result depends on the contour distribution, elevation data, and coverage.
Step 5: Convert the TIN to a raster DEM if required
If subsequent operations require a raster DEM, use the TIN To Raster tool.
Navigate to:
Analysis → Tools → TIN To Raster
Select the TIN as the input surface, choose an appropriate output raster interpolation method, define the output cell size, and specify the output path.
For example:
DEM_From_TIN.tif
Run the tool and inspect the resulting raster.
This allows you to maintain the TIN as a surface model while also generating a raster DEM for workflows that use regular grid cells.
5. Evaluating Surface Quality
A successful interpolation run does not guarantee a reliable terrain model. You should evaluate the surface before calculating derivatives or using it for environmental decisions.
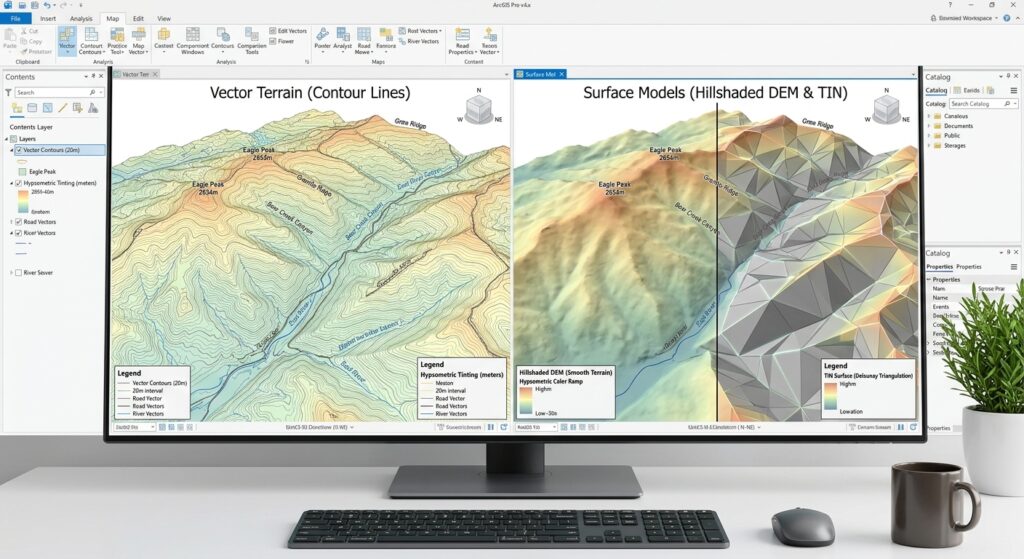
5.1 Compare the surface with the original contours
Display the interpolated DEM with the original contours overlaid.
Check whether:
- The elevation gradient is consistent with the contour values.
- The main hills, valleys, ridges, and depressions appear in plausible locations.
- There are unexpected flats or abrupt artifacts.
- The outer edge of the surface behaves reasonably.
- The raster contains unexpected NoData regions or isolated elevation spikes.
A hillshade can make visual inspection easier because it emphasizes changes in terrain form.
5.2 Identify flat tops and flat areas
Large flat areas can occur when the input contours do not contain enough information to identify a summit, valley bottom, or local terrain variation.
For example, if several contours surround a hill but no spot elevation indicates its peak, the interpolated surface may produce an overly flat or generalized summit.
Possible remedies include:
- Incorporating reliable spot heights.
- Adding supplementary elevation data.
- Using a terrain-aware interpolation method.
- Checking whether the source contours omit important local features.
Simply decreasing the output cell size will not recover missing terrain information.
5.3 Identify artificial cliff edges
Artificial cliff-like patterns may occur where interpolation creates abrupt transitions that are inconsistent with the landscape.
In a TIN, abrupt slope changes can also appear along triangle edges because each triangle represents a planar surface.
Investigate whether the problem comes from incorrect elevation attributes, sparse contour coverage, an inappropriate feature-type setting, or an actual terrain discontinuity that needs to be represented explicitly.
Do not introduce hard breaklines merely to sharpen the terrain visually. Hard breaklines should correspond to real or defensibly modeled terrain discontinuities.
5.4 Look for IDW artifacts
IDW interpolation can produce local peaks, pits, or bull’s-eye patterns around clusters of input points. Its results can be particularly sensitive to uneven sample distribution.
When using contour-derived points, inspect whether the surface shows artificial ridges, flat regions, or patterns unrelated to the original contours.
Compare the IDW raster against a TIN-derived or contour-aware DEM if the results will be used for quantitative terrain analysis.
5.5 Validate using independent elevation observations
If independent survey points, GNSS measurements, or a reliable reference DEM are available, compare the interpolated elevations against those reference values.
For each validation point, calculate the difference:
[
e_i = z_{\mathrm{model},i}-z_{\mathrm{reference},i}
]
where:
- (e_i) is the elevation error.
- (z_{\mathrm{model},i}) is the elevation from the interpolated surface.
- (z_{\mathrm{reference},i}) is the reference elevation.
A common summary measure is the root mean square error:
[
RMSE=\sqrt{\frac{1}{n}\sum_{i=1}^{n}e_i^2}
]
A lower RMSE indicates smaller overall differences for the validation sample, although its interpretation depends on the accuracy of the reference data and the design of the validation sample.
Avoid validating a DEM only against the same contour features used to construct it. Independent observations provide a more meaningful assessment of predictive accuracy.
6. Common Errors and Troubleshooting
Error 1: Elevation values are missing or stored as text
Cause: The interpolation tool cannot interpret the selected field as numeric elevation data.
Solution: Inspect the attribute table, convert the elevation values to a valid numeric field, and check for null values or inconsistent units.
Error 2: The DEM looks excessively flat
Cause: The contour interval may be too large to represent local terrain changes, or the selected interpolation method may generalize the surface.
Solution: Check the contour spacing, add reliable spot heights where available, and compare an alternative interpolation method. Do not assume a finer output cell size will improve the underlying terrain accuracy.
Error 3: The terrain displays unexpected spikes or pits
Cause: Incorrect contour elevations, duplicate or inconsistent input features, uneven sampling, or interpolation artifacts may be responsible.
Solution: Verify the source attributes, inspect the contour geometry, and compare results across methods. Use depression or sink treatment only where it is justified by the analytical objective and the source data.
Error 4: The DEM shows severe boundary artifacts
Cause: Interpolation has been performed too close to the edge of the available contour data.
Solution: Use an appropriate input margin, create the surface over a broader extent, and clip the final raster to the study boundary afterward.
Error 5: Slope values appear implausible
Cause: The DEM may use unsuitable horizontal or vertical units, have incorrect elevation scaling, or contain interpolation artifacts.
Solution: Verify the CRS and elevation units, check the elevation range, confirm the Z-factor or vertical-unit settings required by the relevant tool, and inspect the DEM before calculating slope.
Error 6: Create TIN or Topo to Raster is unavailable
Cause: The relevant ArcGIS Pro extension license may not be available.
Solution: Check the licensing and extension availability. Create TIN uses 3D Analyst, while the Spatial Analyst version of Topo to Raster requires Spatial Analyst. QGIS provides its own interpolation tools, although its native TIN output is not equivalent to an ArcGIS TIN dataset.
7. DEM vs. TIN: Which Surface Model Should You Use?
The choice between a DEM and a TIN depends on the purpose of the analysis and the characteristics of the input data.
| Characteristic | DEM (Raster) | TIN |
|---|---|---|
| Data structure | Regular grid of elevation cells | Irregular network of triangles |
| Surface representation | Elevation stored per cell | Elevation represented at nodes and across triangular facets |
| Terrain analysis | Widely supported by raster-based tools | Useful for surface modeling and triangulated terrain analysis |
| Spatial detail | Controlled partly by raster cell size | Controlled by node distribution and triangulation |
| Breaklines | Require appropriate raster representation or supplementary processing | Can be explicitly incorporated into the triangulation |
| Storage and processing | Efficient for many grid-based calculations, although large rasters can be demanding | Can represent varying point density, but large TINs can become complex |
| Common uses | Slope, aspect, hillshade, hydrology, raster modeling | Engineering surfaces, irregular terrain modeling, breakline-aware surfaces |
| Main limitation | Regular grids may smooth or generalize important features | Triangle edges can produce abrupt changes in slope |
Choose a DEM when:
- You need to calculate slope and aspect using raster tools.
- Your workflow depends on raster algebra or hydrological processing.
- You need consistent cell-based inputs for spatial modeling.
- You want an output format that is broadly supported by raster GIS workflows.
Choose a TIN when:
- You need an explicit triangulated surface.
- You want to represent irregularly distributed elevation information.
- Important breaklines need to be incorporated into the terrain model.
- Your workflow involves TIN editing, engineering surfaces, or other triangulation-based operations.
In some projects, creating both is worthwhile: maintain the TIN as the triangulated surface representation and derive a raster DEM for standard terrain analysis.
8. Conclusion
Converting contour lines into a DEM or TIN is a fundamental terrain-analysis workflow in GIS. It allows elevation information stored in vector isolines to be transformed into a surface suitable for visualization, slope and aspect derivation, hydrological analysis, and 3D modeling.
The two software packages offer different tools for this process:
- QGIS: Use TIN Interpolation for a contour-constrained interpolation workflow. Use IDW only after preparing suitable elevation sample points, recognizing that this approach does not enforce the full contour lines as constraints.
- ArcGIS Pro: Use Topo to Raster when creating a terrain raster from contour and related topographic inputs. Use Create TIN when a triangulated surface model is required, and TIN To Raster when a raster DEM is also needed.
The quality of the resulting surface depends on more than the choice of software. Correct elevation attributes, a suitable projected CRS, realistic output resolution, reliable contour coverage, and careful validation are essential.
A good terrain model should represent the information supported by the source data without implying a level of detail or accuracy that the original contours cannot provide.