

Converting Excel CSV Coordinates into Shapefiles Programmatically with Python
Converting Excel CSV Coordinates into Shapefiles Programmatically with Python saves time when you regularly receive tabular GIS data as spreadsheets containing latitude and longitude values.
With Python, pandas, GeoPandas, and Shapely, you can automate the entire workflow: read the table, clean the coordinates, create point geometries, assign a CRS, and export the result as a Shapefile or GeoPackage.
This is especially useful for automated GIS data cleaning and repeatable GIS workflows.
1. Introduction: Converting Excel CSV Coordinates into Shapefiles Programmatically with Python

Imagine receiving a CSV file every week containing:
| Site_ID | Name | Latitude | Longitude | Population |
|---|---|---|---|---|
| 001 | Site A | -1.286389 | 36.817223 | 1200 |
| 002 | Site B | -1.292066 | 36.821945 | 850 |
| 003 | Site C | -1.300000 | 36.810000 | 640 |
You could:
- Open QGIS or ArcGIS Pro.
- Import the CSV.
- Tell the software which columns contain X and Y.
- Set the CRS.
- Export the layer.
- Repeat the process next week.
That works, but it is not very efficient when the workflow is repeated frequently.
A Python script can perform the same process automatically:
CSV
 ↓
Read with pandas
 ↓
Clean coordinates
 ↓
Create Point geometries
 ↓
Assign CRS
 ↓
Export Shapefile / GeoPackage
This approach is particularly useful when processing dozens or hundreds of files.
2. Prerequisites
You need Python and three main libraries:
- pandas — reads and manipulates tabular data.
- GeoPandas — adds geospatial capabilities to pandas.
- Shapely — creates and works with geometric objects such as points.
Install them with:
pip install pandas geopandas shapelyYou can verify the installation with:
import pandas as pdimport geopandas as gpdimport shapelyprint("pandas:", pd.__version__)print("geopandas:", gpd.__version__)print("shapely:", shapely.__version__)Tip: If you are using Conda, installing GeoPandas through
conda-forgecan sometimes be easier because GeoPandas depends on several geospatial packages.
3. Example CSV Structure
For this tutorial, assume your file is called:
sites.csvAnd contains:
Site_ID,Name,Latitude,Longitude,Population
001,Site A,-1.286389,36.817223,1200
002,Site B,-1.292066,36.821945,850
003,Site C,-1.300000,36.810000,640
The important columns are:
LatitudeLongitude
The other columns become attributes in the resulting GIS layer.
4. Step 1 — Read the CSV with Pandas
The first step is to load the CSV into a pandas DataFrame.
import pandas as pd# Read the CSV filedf = pd.read_csv("sites.csv")# Display the first five recordsprint(df.head())You can also inspect the column names:
print(df.columns)And check the data types:
print(df.dtypes)You might see something like:
Site_ID        int64
Name          object
Latitude     float64
Longitude    float64
Population     int64
dtype: object
At this point, the data is still an ordinary table. It does not contain GIS geometry yet.
5. Step 2 — Clean the Coordinate Columns
This is one of the most important parts of the workflow.
Real-world spreadsheets are rarely perfectly clean. Coordinates may contain:
- Empty cells
- Leading or trailing spaces
- Numbers stored as text
- Commas or other formatting characters
- Invalid values
For example:
" -1.286389 "
"36.817223 "
Although these look like numbers, they may actually be strings.
Remove unnecessary spaces
df["Latitude"] = df["Latitude"].astype(str).str.strip()df["Longitude"] = df["Longitude"].astype(str).str.strip()Then convert them to numeric values:
df["Latitude"] = pd.to_numeric(df["Latitude"], errors="coerce")df["Longitude"] = pd.to_numeric(df["Longitude"], errors="coerce")The errors="coerce" option converts values that cannot be interpreted as numbers into NaN.
For example:
"-1.286389" → -1.286389
"36.817223" → 36.817223
"unknown"   → NaN
Remove missing coordinates
df = df.dropna(subset=["Latitude", "Longitude"])This prevents rows without usable coordinates from creating invalid geometries.
Validate the coordinate ranges
For latitude and longitude in the WGS 84 coordinate system:
- Latitude must be between -90 and 90
- Longitude must be between -180 and 180
You can filter invalid records:
df = df[ df["Latitude"].between(-90, 90) & df["Longitude"].between(-180, 180)]This is a useful step in an automated GIS data cleaning pipeline.
6. Step 3 — Convert the DataFrame into a GeoDataFrame
Now we can turn the coordinate columns into actual GIS point geometries.
Import the required GeoPandas and Shapely functionality:
import geopandas as gpd
from shapely.geometry import Point
Create the geometry:
geometry = [
    Point(lon, lat)
    for lon, lat in zip(df["Longitude"], df["Latitude"])
]
Notice the order:
Point(longitude, latitude)Longitude comes first. Latitude comes second.
Now create a GeoDataFrame:
gdf = gpd.GeoDataFrame(
    df,
    geometry=geometry
)
You can inspect it:
print(gdf.head())You now have a spatial dataset.
7. Step 4 — Set the Coordinate Reference System
The coordinates in our example are latitude/longitude coordinates using WGS 84.
Its EPSG code is:
EPSG:4326Assign it to the GeoDataFrame:
gdf = gdf.set_crs("EPSG:4326")You can verify it:
print(gdf.crs)Output:
EPSG:4326Why explicitly define the CRS?
A coordinate such as:
36.817223, -1.286389has little meaning to GIS software without knowing the coordinate reference system.
The CRS tells GIS software how those coordinates relate to the Earth’s surface.
Important:
set_crs()assigns the existing coordinate system. It does not transform the coordinates.
If you need to convert the data to another CRS, use:
gdf = gdf.to_crs("EPSG:XXXX")For example:
gdf_projected = gdf.to_crs("EPSG:3857")8. Step 5 — Export to an ESRI Shapefile
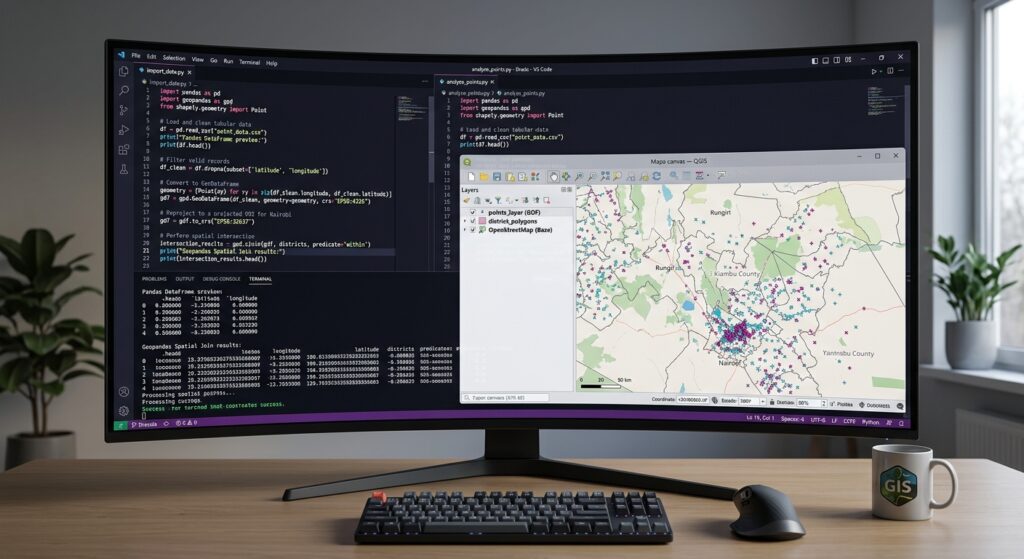
Once the GeoDataFrame is ready, exporting it is straightforward.
gdf.to_file(
    "sites.shp",
    driver="ESRI Shapefile"
)
This creates a Shapefile dataset.
However, remember that a Shapefile is actually a collection of files, typically including:
sites.shp
sites.shx
sites.dbf
sites.prj
Keep these files together.
The .shp file alone is not the complete dataset.
9. Export to GeoPackage
GeoPackage is often a better modern alternative to Shapefile.
You can export the same GeoDataFrame using:
gdf.to_file(
    "sites.gpkg",
    layer="sites",
    driver="GPKG"
)
This produces:
sites.gpkgUnlike a Shapefile, the main dataset is contained in a single file.
GeoPackage also avoids several traditional Shapefile limitations, making it useful for modern GIS workflows.
10. Complete Script
Once you understand the individual steps, they can be combined into one reusable script.
import pandas as pdimport geopandas as gpdfrom shapely.geometry import Point# --------------------------------------------------# 1. Read CSV# --------------------------------------------------df = pd.read_csv("sites.csv")# --------------------------------------------------# 2. Clean coordinate columns# --------------------------------------------------# Remove leading/trailing spacesdf["Latitude"] = df["Latitude"].astype(str).str.strip()df["Longitude"] = df["Longitude"].astype(str).str.strip()# Convert coordinates to numeric valuesdf["Latitude"] = pd.to_numeric( df["Latitude"], errors="coerce")df["Longitude"] = pd.to_numeric( df["Longitude"], errors="coerce")# Remove rows with missing coordinatesdf = df.dropna( subset=["Latitude", "Longitude"])# --------------------------------------------------# 3. Remove invalid coordinatesThis script now performs the entire Convert CSV to Shapefile Python GeoPandas workflow automatically.
11. Saving GeoJSON with Python
You can also export the same data to GeoJSON.
gdf.to_file(
    "sites.geojson",
    driver="GeoJSON"
)
This can be particularly useful when working with web GIS applications.
A complete export section might therefore look like:
# Shapefile
gdf.to_file(
    "sites.shp",
    driver="ESRI Shapefile"
)

# GeoPackage
gdf.to_file(
    "sites.gpkg",
    layer="sites",
    driver="GPKG"
)

# GeoJSON
gdf.to_file(
    "sites.geojson",
    driver="GeoJSON"
)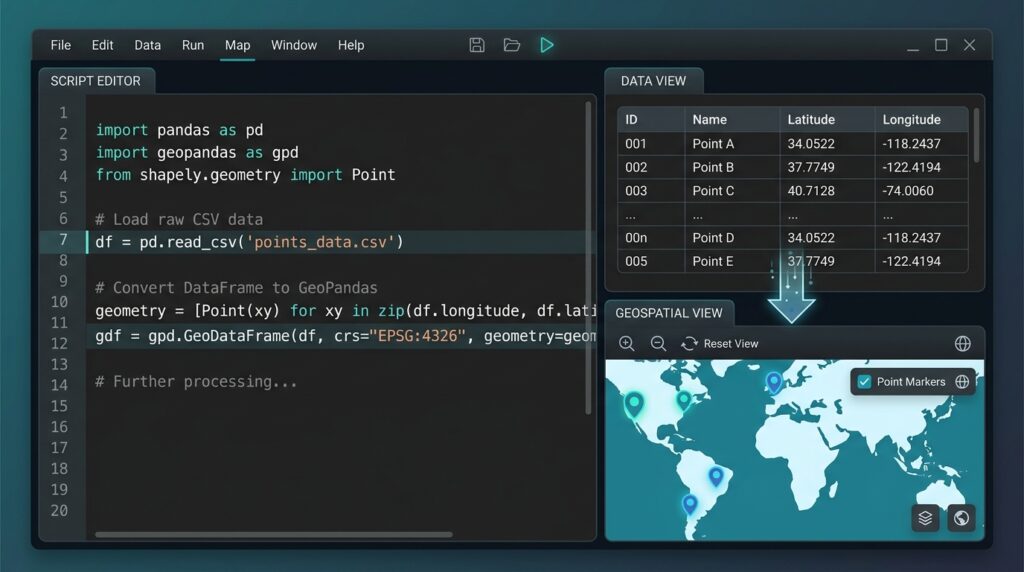
This gives you three common GIS formats from the same source table.
12. Common Pitfall: Inverted Latitude and Longitude
One of the most common mistakes when converting coordinates programmatically is reversing the coordinate order.
Correct:
Point(longitude, latitude)Incorrect:
Point(latitude, longitude)For example, consider:
Latitude:  -1.286389
Longitude: 36.817223
The correct Shapely point is:
Point(36.817223, -1.286389)not:
Point(-1.286389, 36.817223)The second version can place your points thousands of kilometres away from their intended location.
Quick diagnostic
Before creating the geometry, inspect a few coordinates:
print(df[["Latitude", "Longitude"]].head())Then check your resulting layer in QGIS or ArcGIS Pro.
13. Common Pitfall: Numbers Stored as Strings
A CSV might contain:
Latitude
-1.286389
-1.292066
-1.300000
but pandas could interpret the values as strings if the column contains inconsistent formatting.
Check the data type:
print(df["Latitude"].dtype)If necessary, convert it:
df["Latitude"] = pd.to_numeric(
    df["Latitude"],
    errors="coerce"
)
Do the same for longitude:
df["Longitude"] = pd.to_numeric(
    df["Longitude"],
    errors="coerce"
)
14. Common Pitfall: Spaces in Column Names
Sometimes Excel exports produce column names such as:
" Latitude"
"Longitude "
This can cause:
df["Latitude"]to fail.
A useful cleaning step is:
df.columns = df.columns.str.strip()You can also make column names lowercase:
df.columns = df.columns.str.strip().str.lower()Then your columns become:
site_id
name
latitude
longitude
population
Your code would then use:
df["latitude"]
df["longitude"]
This is particularly useful when building scripts that process files from different sources.
15. Common Pandas and GeoPandas Errors
KeyError: 'Latitude'
This usually means pandas cannot find a column with exactly that name.
Check:
print(df.columns.tolist())Look for differences such as:
"Latitude "
" latitude"
"LATITUDE"
Then clean the column names:
df.columns = df.columns.str.strip()ValueError: could not convert string to float
Your coordinate column probably contains invalid text.
Use:
df["Latitude"] = pd.to_numeric(
    df["Latitude"],
    errors="coerce"
)
Then find missing values:
print(df[df["Latitude"].isna()])Geometry is empty or invalid
Check for missing coordinates:
print(df[["Latitude", "Longitude"]].isna().sum())Then remove them:
df = df.dropna(
    subset=["Latitude", "Longitude"]
)
Points appear in the wrong location
First check the axis order:
Point(longitude, latitude)Then check the CRS:
print(gdf.crs)For latitude/longitude coordinates, it should normally be:
EPSG:432616. A More Robust Automated Workflow
Once the basic script works, you can turn it into a reusable function.
import pandas as pd
import geopandas as gpd
from shapely.geometry import Point


def csv_to_geodata(
    input_file,
    output_file,
    latitude_col="Latitude",
    longitude_col="Longitude"
):

    # Read CSV
    df = pd.read_csv(input_file)

    # Clean column names
    df.columns = df.columns.str.strip()

    # Clean coordinates
    df[latitude_col] = pd.to_numeric(
        df[latitude_col].astype(str).str.strip(),
        errors="coerce"
    )

    df[longitude_col] = pd.to_numeric(
        df[longitude_col].astype(str).str.strip(),
        errors="coerce"
    )

    # Remove missing coordinates
    df = df.dropna(
        subset=[latitude_col, longitude_col]
    )

    # Validate coordinate ranges
    df = df[
        df[latitude_col].between(-90, 90) &
        df[longitude_col].between(-180, 180)
    ]

    # Create geometry
    geometry = [
        Point(lon, lat)
        for lon, lat in zip(
            df[longitude_col],
            df[latitude_col]
        )
    ]

    # Create GeoDataFrame
    gdf = gpd.GeoDataFrame(
        df,
        geometry=geometry,
        crs="EPSG:4326"
    )

    # Export
    gdf.to_file(
        output_file,
        driver="ESRI Shapefile"
    )

    return gdf


# Run the conversion
result = csv_to_geodata(
    "sites.csv",
    "sites.shp"
)

print(result)
Now you can reuse the same function for different datasets without rewriting the entire workflow.
17. Practical GIS Automation Tips
Once you are comfortable with this workflow, you can expand it considerably.
For example, a Python script can:
- Process hundreds of CSV files.
- Standardize column names.
- Remove invalid coordinates.
- Detect missing values.
- Create point geometries.
- Reproject layers.
- Export multiple GIS formats.
- Merge datasets.
- Calculate spatial attributes.
- Generate summary reports.
Instead of manually cleaning and importing each file, you can create a repeatable pipeline:
Raw Excel/CSV
      ↓
Column cleaning
      ↓
Coordinate validation
      ↓
Missing-value handling
      ↓
Point creation
      ↓
CRS assignment
      ↓
GIS export
      ↓
Ready-to-use spatial data
That is where GeoPandas becomes particularly powerful: it allows familiar pandas-style data processing to be combined with spatial operations.
18. Summary
The basic workflow for Convert CSV to Shapefile Python GeoPandas is:
- Read the CSV using
pandas. - Clean the coordinate columns.
- Convert latitude and longitude to numeric values.
- Remove missing or invalid coordinates.
- Create Shapely
Pointgeometries. - Convert the DataFrame into a GeoDataFrame.
- Assign the correct CRS, such as
EPSG:4326. - Export the result as Shapefile, GeoPackage, or GeoJSON.
The most important code pattern to remember is:
df = pd.read_csv("sites.csv")df["Latitude"] = pd.to_numeric( df["Latitude"], errors="coerce")df["Longitude"] = pd.to_numeric( df["Longitude"], errors="coerce")gdf = gpd.GeoDataFrame( df, geometry=[ Point(lon, lat) for lon, lat in zip( df["Longitude"], df["Latitude"] ) ], crs="EPSG:4326")gdf.to_file( "sites.shp", driver="ESRI Shapefile")Once this pattern becomes familiar, you can move beyond one-off conversions toward automated GIS data cleaning pipelines that process large numbers of tabular datasets consistently and reproducibly.