
Spatial Data vs Non Spatial Data: 5 Key Differences Every GIS Student Should Know
When comparing spatial data vs non spatial data, spatial data describes where something is located .Spatial data and non-spatial data are two fundamental geographic data types used in Geographic Information Systems (GIS). Spatial data describes where something is located and its geometry, while non-spatial data describes characteristics or attributes about that thing without explicitly representing its location.
1. Spatial Data vs Non-Spatial Data: Side-by-Side Comparison
| Feature | Spatial Data | Non-Spatial Data |
|---|---|---|
| Definition | Data that represents the location, shape, and spatial relationships of real-world features. | Data that describes characteristics or attributes of features without directly representing their geographic location. |
| Representation | Points, lines, polygons, and raster cells/pixels. | Rows, columns, numbers, text, categories, dates, and other tabular values. |
| Storage Format | Shapefiles, GeoJSON, GeoPackage, geodatabases, GeoTIFF, and other spatial formats. | CSV, Excel spreadsheets, relational databases, and standard tables. |
| Example Use Cases | Mapping roads, analyzing land use, tracking GPS locations, and modeling flood risk. | Recording population, income, road names, business information, or household characteristics. |
| Software Used | QGIS, ArcGIS Pro, Google Earth Engine, PostGIS, and other GIS platforms. | Excel, SQL databases, Python, R, and database management systems; also commonly used within GIS software. |
The distinction becomes particularly important when learning spatial data vs non spatial data examples, because many real-world GIS datasets contain both types of information.
2. Deep Dive into Spatial Data
Spatial data is information that contains a geographic or geometric component. It answers questions such as:
- Where is a feature?
- What shape does it have?
- How large is it?
- What features are nearby?
- What is its relationship to other geographic features?
For example, a dataset showing the locations of hospitals in Nairobi is spatial because each hospital has a geographic position.”When analyzing spatial data vs non spatial data, spatial data relies on coordinate reference systems to define geographic position.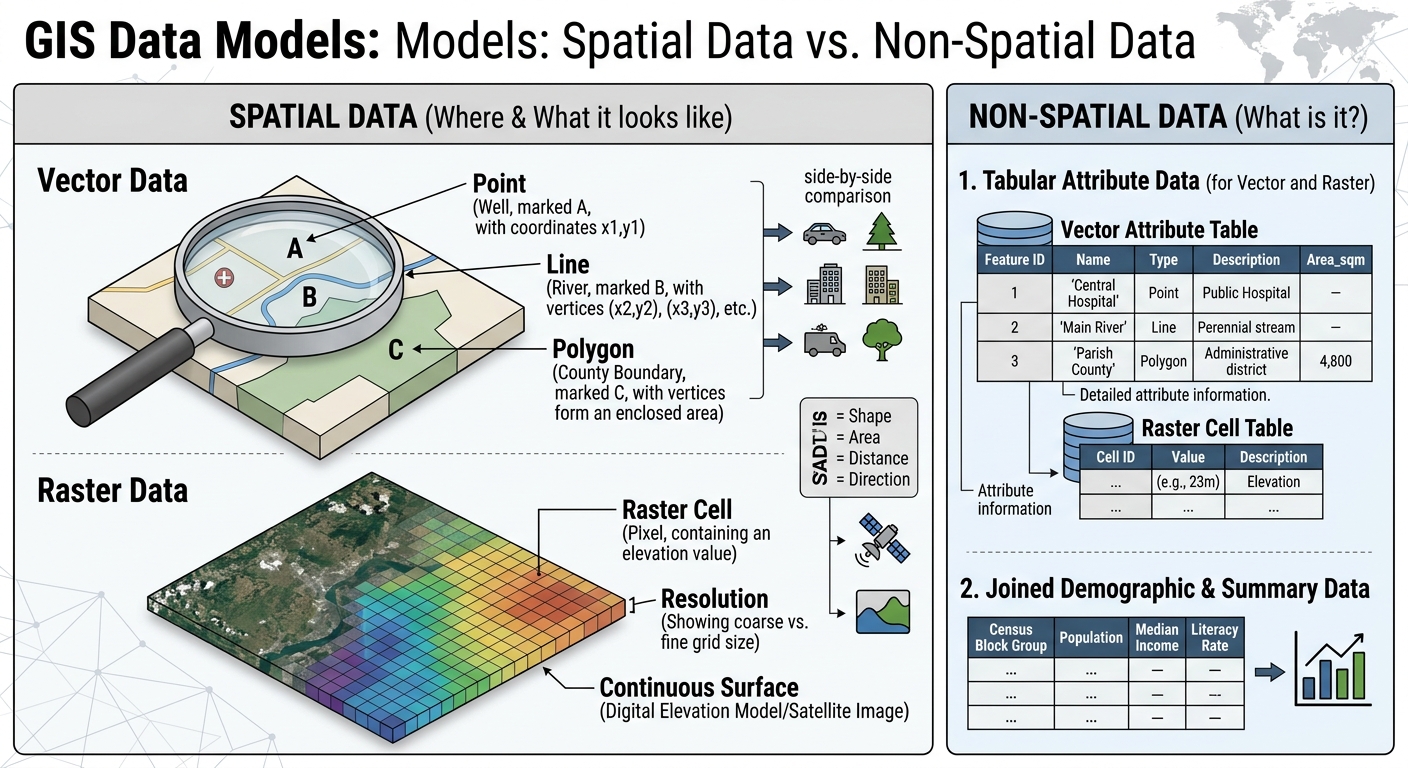
Coordinate Systems
Spatial data normally relies on a coordinate system to define where features exist on Earth’s surface.
Coordinates may be represented using:
- Latitude and longitude
- Projected coordinate systems
- Easting and northing coordinates
- Local or national coordinate reference systems
For example, a GPS receiver might record a location using latitude and longitude. GIS software can then place that location correctly on a map.
Coordinate systems are essential because geographic features must be positioned consistently before performing operations such as measuring distance, calculating area, or overlaying datasets.
Vector Data: Points, Lines, and Polygons
One major spatial data model is vector data. Vector data represents geographic features using geometric objects.
Points represent individual locations with no significant area at the mapping scale.
Examples include:
- A school
- A borehole
- A weather station
- A GPS location
Lines represent linear features.
Examples include:
- Roads
- Rivers
- Railway tracks
- Pipelines
Polygons represent enclosed areas.
Examples include:
- Counties
- Lakes
- Parcels
- Forest reserves
- Buildings
A GIS can calculate properties such as polygon area, line length, and distances between points.
Raster Data
The second major spatial data model is raster data. Raster data represents geographic space as a grid of cells or pixels.
Each cell contains a value representing something measured or classified at that location.
Common raster examples include:
- Satellite imagery
- Digital Elevation Models (DEMs)
- Temperature surfaces
- Rainfall maps
- Land-cover classifications
For example, a satellite image can contain millions of pixels, with each pixel storing information about the Earth’s surface at that location.
A Digital Elevation Model (DEM) goes further by storing elevation values in raster cells. GIS software can use these values to calculate slope, aspect, drainage patterns, and watershed characteristics.
Real-World Spatial Data Examples
Consider a city transportation project. A GIS database might contain:
Road network:
- Lines representing roads
- Coordinates defining their locations
- Road geometry and connectivity
Bus stops:
- Points representing individual stops
- Geographic coordinates
- Attributes such as stop names
Administrative boundaries:
- Polygons representing wards or counties
- Boundary geometry
- Associated administrative information
These datasets allow GIS professionals to perform spatial analysis rather than simply reading information from a table.
3. Deep Dive into Non-Spatial Data
Non-spatial data, sometimes called attribute data when associated with geographic features, describes the properties or characteristics of something.
Unlike spatial data, it does not inherently contain geometry or geographic coordinates .In the spatial data vs non spatial data dynamic, non-spatial data provides the descriptive characteristics or attributes without geometry.
A simple example might be:
| School ID | School Name | Students | Teachers |
|---|---|---|---|
| S001 | Green Valley School | 450 | 25 |
| S002 | Riverside Academy | 620 | 32 |
| S003 | Hilltop School | 380 | 21 |
This table tells us important information about schools, but by itself it does not tell us where those schools are.
Tabular Structures
Non-spatial information is commonly organized into:
- Rows
- Columns
- Fields
- Records
- Tables
Each row generally represents a record, while each column represents a particular attribute.
For example, a population table might contain:
- County name
- Population
- Average household size
- Employment rate
- Literacy rate
- Median income
These values can be analyzed statistically even without geographic coordinates.
Demographic Tables
Demographic information is a common example of non-spatial data.
A demographic dataset could contain:
| County | Population | Male | Female | Households |
|---|---|---|---|---|
| County A | 850,000 | 420,000 | 430,000 | 190,000 |
| County B | 620,000 | 300,000 | 320,000 | 140,000 |
The table contains useful demographic information, but the records do not inherently contain shapes or coordinates.
However, GIS can connect this information to spatial boundaries, transforming the table into a powerful mapping dataset.
Business Records
Business databases provide another example.
A company may maintain records containing:
- Customer ID
- Customer name
- Purchase amount
- Product category
- Transaction date
- Sales representative
These records can be analyzed using spreadsheets, SQL, Python, or statistical software.
If the business later adds addresses or geographic coordinates, the records can potentially be connected to spatial data for geographic analysis.
4. How GIS Bridges Spatial and Non-Spatial Data
One of the most important concepts in GIS is that spatial and non-spatial data do not have to remain separate.Understanding spatial data vs non spatial data joins allows GIS analysts to link tabular records directly to map features.
GIS can connect them using a common field called a key.
For example, suppose you have a spatial layer containing county boundaries:
| County_ID | Geometry |
|---|---|
| 001 | Polygon |
| 002 | Polygon |
| 003 | Polygon |
You could also have a non-spatial population table:
| County_ID | Population |
|---|---|
| 001 | 850,000 |
| 002 | 620,000 |
| 003 | 410,000 |
Both datasets contain County_ID.
GIS can use this shared key to perform a Join.
The resulting geographic layer can contain both:
- The county polygon geometry
- The population attribute
This makes it possible to create a population map.
Joins vs. Relates
A Join generally combines fields from one table with another based on a common field.
A Relate establishes a relationship between tables without necessarily physically combining all their fields into one table.
This distinction becomes useful when working with one-to-many relationships.
For example, one county could have thousands of individual household records. A relate can help connect those records to the county without duplicating the county geometry thousands of times.
This is one reason understanding attribute data vs spatial data is fundamental for GIS students.
5. Spatial Data vs Non-Spatial Data: 5 Key Differences
Difference 1: Geometry
The most fundamental difference is geometry.Another key distinction in spatial data vs non spatial data is storage complexity, as spatial formats require geographic indexes.
Spatial data contains geographic geometry, such as:
- Points
- Lines
- Polygons
- Raster cells
Non-spatial data normally consists of descriptive values such as:
- Names
- Numbers
- Categories
- Dates
- Text
For example, a point representing a hospital is spatial data. Its hospital name, number of beds, and operating status are attribute information.
In simple terms: spatial data tells you “where”; non-spatial data tells you “what” or “how much.”
Difference 2: Storage Complexity
Spatial data generally requires more specialized storage structures because the computer must store geographic information in addition to ordinary attributes.
A spatial feature may need to store:
- Coordinates
- Geometry
- Coordinate reference system information
- Attributes
- Spatial indexes
Common spatial formats include GeoPackage, Shapefile, GeoJSON, GeoTIFF, and spatial databases.
Non-spatial data can often be stored using relatively simple formats such as:
- CSV
- Excel
- TXT
- Standard relational database tables
Raster datasets can become particularly large because high-resolution imagery may contain millions or billions of cells.
Difference 3: Query Methods
Non-spatial data is often queried using conventional database operations.
For example:
SELECT *
FROM students
WHERE age > 20;
A GIS can perform these attribute queries but can also perform spatial queries.
Examples include:
- Which hospitals are within 5 km of a road?
- Which buildings intersect a flood zone?
- Which farms are located inside a watershed?
- Which schools are closest to a particular settlement?
These operations depend on geographic relationships such as distance, intersection, containment, adjacency, and proximity.
Spatial queries therefore extend traditional data analysis into geographic analysis.
Difference 4: Visualization
Non-spatial data is commonly presented through:
- Tables
- Bar charts
- Line graphs
- Statistical summaries
- Dashboards
Spatial data can be visualized directly on maps.
For example, population data in a spreadsheet might be displayed as a bar chart.
When population attributes are joined to county polygons, GIS can produce a choropleth map showing population differences geographically.
This adds an important analytical dimension: location.
Instead of simply asking how many people live in each area, researchers can investigate spatial patterns and relationships.
Difference 5: Processing Power
Spatial analysis can require substantial computational resources, particularly when datasets are large or operations are complex.
For example, analyzing a small spreadsheet containing 10,000 records may be relatively straightforward.
Processing:
- High-resolution satellite imagery
- Large DEMs
- Massive GPS datasets
- Nationwide road networks
- Large spatial databases
can require considerably more memory, storage, processing power, and specialized algorithms.
GIS operations such as raster analysis, spatial interpolation, network analysis, and large-scale overlay processing can therefore become computationally intensive.
Modern GIS platforms and cloud systems help address these challenges by providing optimized spatial databases, parallel processing, and distributed computing capabilities.
Conclusion: Understanding the Relationship Between Spatial and Non-Spatial Data
The key distinction in spatial data vs non spatial data is straightforward: spatial data represents geographic location and geometry, while non-spatial data describes characteristics and attributes.
However, GIS becomes especially powerful when the two are combined. A map showing county boundaries becomes much more useful when demographic, economic, environmental, or administrative attributes are connected to those boundaries through a shared identifier.
Remember the five major differences:
- Geometry — spatial data has geographic geometry.
- Storage complexity — spatial datasets require specialized geographic structures.
- Query methods — spatial data supports geographic relationships and spatial queries.
- Visualization — spatial information can be represented directly on maps.
- Processing power — complex spatial datasets and analyses can require significant computational resources.
Discussion question: If you were building a GIS project for your local area, what spatial dataset would you choose, and what non-spatial attributes would you join to it to make the analysis more useful?