
Vector vs. Raster Data: The Ultimate Cheatsheet for GIS Students
Vector vs Raster GIS: Why This Difference Matters
When studying Vector vs Raster GIS, one of the first decisions that can feel confusing is whether your data should be represented as points, lines, and polygons or as a grid made up of pixels. Why would a road be a line in one dataset but an image of pixels in another? And when should you use a shapefile instead of a raster?
Understanding Vector vs Raster GIS is fundamental because the choice of data model affects how you store, analyze, visualize, and interpret geographic information.
In simple terms, vector data represents geographic features using points, lines, and polygons, while raster data represents geographic phenomena using a regular grid of cells or pixels. Neither model is universally better. Each is designed for different types of spatial information and analysis.
This cheatsheet gives GIS students a practical foundation for understanding vector vs raster data, choosing the appropriate model for assignments, and avoiding common mistakes in spatial analysis.
What Are GIS Data Models?
A GIS data model is a way of organizing geographic information so that a computer can store and analyze relationships between locations and attributes.
The two fundamental spatial data models are:
- Vector data — represents discrete geographic objects with coordinates.
- Raster data — represents geographic information as a grid of cells.
Think of it this way:
Vector = objects
Raster = surfaces
A school, road, or property boundary can be treated as an individual geographic object. Elevation, temperature, rainfall, or satellite imagery is often better represented as a continuous surface.
This distinction is at the heart of Vector vs Raster GIS.
Understanding Vector Data
What Is Vector Data?
Vector data represents geographic features using coordinates. These features are normally categorized as points, lines, or polygons.
Vector data is particularly useful when geographic features have clearly defined boundaries or locations.
1. Points
A point represents a specific geographic location.
Points have an X and Y coordinate and can represent features such as:
- Schools
- Hospitals
- Water wells
- Weather stations
- Businesses
- GPS locations
- Electricity poles
- Trees
For example, a GIS map of health facilities might represent every hospital as a point.
A point is appropriate when the location is important but the physical size of the feature is not the primary focus of the analysis.
2. Lines
Lines, sometimes called polylines, represent linear geographic features.
Examples include:
- Roads
- Rivers
- Railways
- Pipelines
- Power transmission lines
- Hiking trails
A road network, for example, can be represented as connected line features. Each road segment can also have attribute information such as road name, surface type, speed limit, or length.
3. Polygons
Polygons represent areas enclosed by boundaries.
Common examples include:
- Land parcels
- Counties
- Forest reserves
- Lakes
- Buildings
- Agricultural fields
- Administrative boundaries
For example, a cadastral map may use polygons to represent individual property parcels. Each polygon can contain attributes such as parcel number, land-use category, or area.
Common Vector File Formats
Several formats are widely encountered in GIS courses.
Shapefile
The ESRI Shapefile is one of the most recognizable vector formats in GIS education.
Despite being called a single file, a shapefile normally consists of multiple associated files, commonly including:
.shp— geometry.shx— spatial index.dbf— attribute data.prj— coordinate reference system information
Students should remember that a shapefile has limitations, including field-name and file-size constraints.
GeoJSON
GeoJSON is a text-based format based on JSON and is commonly used for web mapping and data exchange.
It can represent:
- Points
- Lines
- Polygons
- Collections of geographic features
GeoJSON is particularly useful when working with web GIS applications.
Advantages of Vector Data
Vector data offers several important advantages:
- High geometric precision for clearly defined boundaries
- Efficient representation of discrete features
- Strong support for attribute information
- Excellent for network and boundary-based analysis
- Often efficient for storing relatively simple geographic features
- Appropriate for cadastral and administrative mapping
For example, representing a property boundary as a polygon allows the boundary to be stored precisely rather than approximated by a coarse grid.
Disadvantages of Vector Data
Vector data also has limitations:
- Complex geometries can become difficult to manage
- Overlay operations can become computationally intensive
- Continuous phenomena can be awkward to represent
- Network and topology errors may occur
- Data preparation can require significant editing
This is one reason Vector vs Raster GIS is not simply a matter of choosing the format with the highest precision.
Understanding Raster Data
What Is Raster Data?
Raster data represents geographic information as a regular grid of cells.
Each cell, commonly called a pixel, contains a value representing some geographic property.
A raster can be visualized as a huge spreadsheet where every cell has:
- A geographic location
- A value
- A defined cell size
For example, a temperature raster might contain a temperature value for every cell across a study area.
How Raster Resolution Works
One of the most important concepts in raster GIS is spatial resolution.
Spatial resolution describes the ground area represented by each pixel.
For example:
- A 30 m raster has cells representing approximately 30 × 30 metres on the ground.
- A 10 m raster has cells representing approximately 10 × 10 metres.
- A 1 m raster provides much finer spatial detail.
Higher spatial resolution generally means smaller cells and more detailed representation—but also potentially larger datasets and greater processing requirements.
Therefore, choosing resolution is an important part of Vector vs Raster GIS decision-making.
Common Raster Examples
Digital Elevation Models
A Digital Elevation Model (DEM) represents elevation across a geographic area.
Each raster cell contains an elevation value.
DEMs can be used to calculate:
- Slope
- Aspect
- Hillshade
- Watersheds
- Drainage patterns
- Terrain characteristics
Satellite Imagery
Satellite imagery is naturally raster-based because sensors record measurements across arrays of pixels.
Different bands may record different portions of the electromagnetic spectrum.
Satellite imagery can therefore support:
- Land-cover classification
- Vegetation analysis
- Change detection
- Agricultural monitoring
- Urban growth analysis
Land-Cover Maps
Raster data can also represent categories such as:
- Forest
- Cropland
- Water
- Urban areas
- Grassland
- Bare land
Each cell contains a classification value.
Common Raster File Formats
GeoTIFF
GeoTIFF is one of the most widely used geospatial raster formats.
It combines raster imagery with geographic referencing information, making it particularly useful for:
- Satellite imagery
- DEMs
- Land-cover datasets
- Aerial imagery
- Scientific spatial analysis
Other raster formats exist, but GeoTIFF is particularly important for GIS students to recognize.
Advantages of Raster Data
Raster data is especially powerful for continuous geographic phenomena.
Advantages include:
- Excellent for continuous surfaces
- Ideal for remote sensing
- Well suited to map algebra
- Effective for terrain analysis
- Straightforward cell-based calculations
- Useful for environmental modeling
For example, calculating areas of high flood risk can involve combining raster layers representing elevation, rainfall, slope, and land cover.
Disadvantages of Raster Data
Raster data also presents challenges:
- Large datasets can require substantial storage
- Resolution determines the level of spatial detail
- Resampling can introduce errors
- Boundaries may appear less precise
- Fine-resolution analysis can require significant processing power
A 1-metre raster covering a large geographic area can contain millions or billions of cells.
Vector vs Raster Data: Side-by-Side Comparison
The following matrix provides a quick reference for Vector vs Raster GIS.
| Category | Vector | Raster |
|---|---|---|
| Structure | Points, lines, and polygons | Grid of cells/pixels |
| Ideal Use Case | Discrete features with defined boundaries | Continuous surfaces and imagery |
| Common File Formats | Shapefile, GeoJSON, GeoPackage | GeoTIFF, IMG, ASCII Grid |
| Precision | High precision for feature boundaries | Depends strongly on cell size/resolution |
| Analysis Types | Network, proximity, boundaries, topology | Map algebra, terrain, classification, surface analysis |
| Storage Size | Often efficient for simple discrete features | Can become very large at high resolution |
The most important lesson is that Vector vs Raster GIS is about matching the data model to the geographic phenomenon and analytical task.
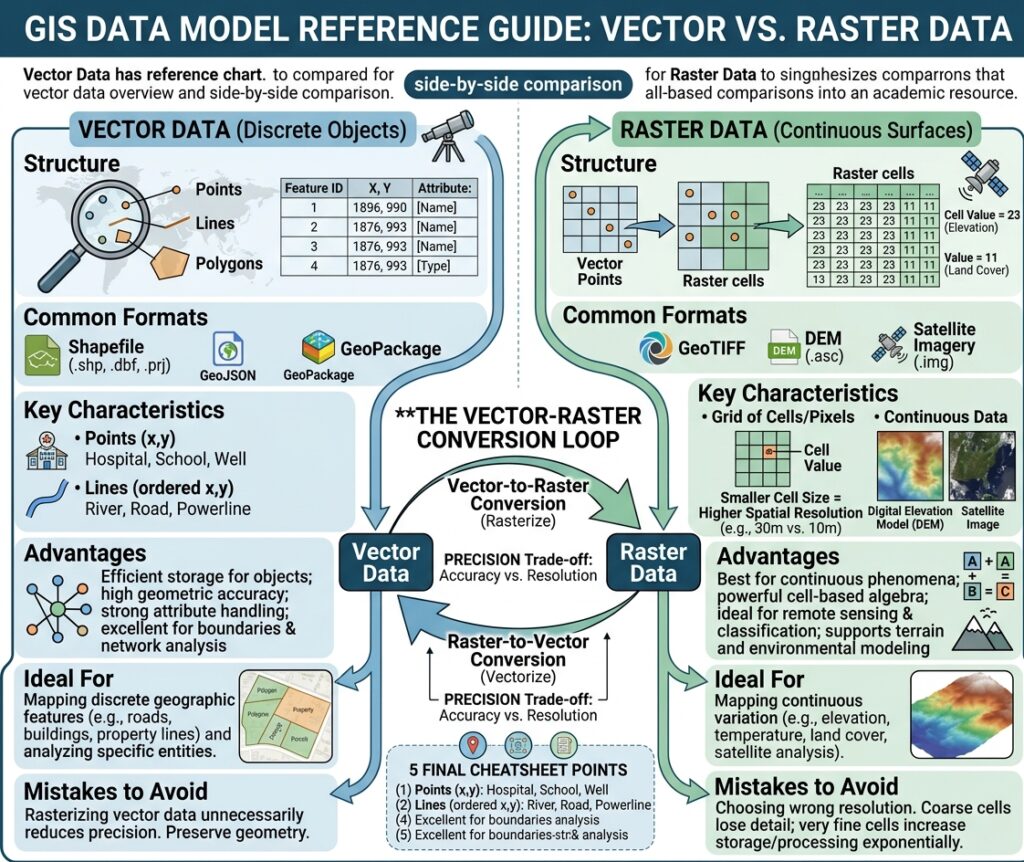
When to Use Vector vs Raster GIS in Assignment
Knowing the definitions is only half the challenge. GIS assignments often ask you to select an appropriate data model for a specific problem.
Here are four practical scenarios.
Scenario 1: Mapping Property Parcels
Assignment: Create a map showing individual land parcels and calculate their areas.
Recommended model: Vector
Property parcels have clearly defined boundaries and are individual geographic features.
A polygon layer is therefore appropriate because each parcel can have:
- A unique identifier
- Ownership-related attributes
- Land-use information
- Calculated area
- Boundary geometry
Using raster data would introduce unnecessary approximation if precise parcel boundaries are already available.
Scenario 2: Mapping a Road Network
Assignment: Analyze the shortest route between several locations.
Recommended model: Vector
Roads are naturally represented as lines.
A vector road network can contain attributes such as:
- Road length
- Travel speed
- Road type
- Direction
- Travel time
This makes vector data appropriate for network analysis and route optimization.
Scenario 3: Flood Risk Zoning
Assignment: Identify areas potentially exposed to flooding based on elevation and terrain.
Recommended model: Raster, often combined with vector
A DEM can provide continuous elevation information across the study area.
Raster analysis can then be used to derive:
- Elevation
- Slope
- Flow direction
- Flow accumulation
- Potential drainage patterns
Vector data may subsequently be used to overlay roads, buildings, administrative boundaries, or population locations.
This illustrates an important principle: Vector vs Raster GIS does not always mean choosing one model exclusively. GIS projects frequently use both.
Scenario 4: Land Suitability Analysis
Assignment: Identify locations suitable for agricultural development based on soil, slope, rainfall, and distance from roads.
Recommended model: Primarily raster
Many suitability criteria are spatial surfaces.
You might have raster layers representing:
- Soil suitability
- Rainfall
- Elevation
- Slope
- Temperature
These layers can be standardized and combined using raster-based map algebra.
Vector roads or protected-area boundaries could then be incorporated into the final analysis.
Common Student Mistakes in GIS Assignments
Even after understanding the basic concepts, students frequently make mistakes when applying them.
Mistake 1: Rasterizing Vector Data Unnecessarily
A student may convert a detailed parcel polygon layer into raster simply because a raster layer is required for another part of the assignment.
The problem is that rasterization introduces a cell-based representation and may reduce the precision of boundaries.
Better approach: Keep the original vector dataset and rasterize only when the analytical workflow actually requires it.
Mistake 2: Choosing the Wrong Raster Resolution
Suppose you are analyzing small buildings using a raster with very large cells.
Important features may disappear or become poorly represented.
Conversely, using extremely fine resolution for a huge study area can create unnecessarily large datasets.
Better approach: Select a resolution appropriate to:
- The scale of the study
- The size of the features
- The source data
- The research question
- Available computing resources
Mistake 3: Assuming One Data Model Is Always Better
A common misconception is that vector is “more accurate” and therefore should always be used.
That conclusion is incomplete.
Vector can provide highly precise boundaries for discrete objects, while raster is often more appropriate for representing continuous geographic variation.
For example, a parcel boundary and a temperature surface are fundamentally different kinds of spatial information.
The right question is not:
“Which model is better?”
Instead, ask:
“Which model represents my geographic phenomenon and analytical objective most appropriately?”
A Simple Decision Tree for GIS Students
When faced with a new assignment, ask these questions:
Question 1: Am I mapping individual objects?
If yes, consider vector.
Examples:
- Buildings
- Roads
- Schools
- Parcels
- Administrative boundaries
Question 2: Am I representing a continuous phenomenon?
If yes, consider raster.
Examples:
- Elevation
- Temperature
- Rainfall
- Satellite imagery
- Pollution concentration
Question 3: Does my analysis involve networks or precise boundaries?
Vector may be appropriate.
Question 4: Does my analysis involve surfaces, cells, or map algebra?
Raster may be appropriate.
Question 5: Do I need both?
Very often, the answer is yes.
Real-world GIS workflows frequently combine vector and raster datasets. A flood-risk project, for example, could use raster elevation and rainfall data alongside vector buildings and roads.
Shapefile vs Raster: What Should Students Remember?
A common classroom comparison is shapefile vs raster, but technically these are not exactly equivalent concepts.
A shapefile is a vector file format. Raster describes an entire spatial data model rather than one specific file format.
Therefore:
Shapefile → Vector format
GeoJSON → Vector format
GeoTIFF → Raster format
This distinction is important when answering GIS examination questions. A lecturer may ask you to compare “shapefile and raster,” but you should understand that the comparison is really between a common vector representation and the raster data model.
Vector and Raster Together: The Real GIS Workflow
In professional and academic GIS, vector and raster datasets are rarely isolated from one another.
Imagine a university research project investigating urban flood exposure.
You might use:
- Raster DEM → elevation
- Raster rainfall data → precipitation
- Raster land cover → surface characteristics
- Vector buildings → exposed structures
- Vector roads → transportation infrastructure
- Vector administrative boundaries → reporting areas
The power of GIS comes partly from being able to combine these different spatial data types.
Understanding Vector vs Raster GIS therefore gives you more than a way to pass an examination—it gives you a foundation for spatial modeling and geographic problem-solving.
Final Vector vs Raster GIS Student Cheatsheet
Remember these five points:
- Vector represents objects using points, lines, and polygons.
- Raster represents surfaces using cells or pixels.
- Vector is generally suited to discrete features with defined boundaries.
- Raster is generally suited to continuous phenomena, imagery, and cell-based analysis.
- Many GIS projects require both models.
The key skill is not memorizing that one is “better.” It is learning to recognize the relationship between the geographic phenomenon, data structure, spatial resolution, and analytical objective.
Once you understand that relationship, many GIS decisions become much easier.
Ready for Your Next GIS Assignment?
Whether you are working with shapefiles, GeoJSON, GeoTIFFs, DEMs, satellite imagery, or spatial analysis tools, understanding the difference between vector and raster data is one of the most useful foundations you can develop as a GIS student.
Bookmark this cheatsheet for your next GIS lab, practical, exam revision session, or spatial analysis assignment. And when an assignment becomes more complex, seek expert academic assistance to help you understand the methodology, workflow, and reasoning behind the analysis—not simply the final answer.