
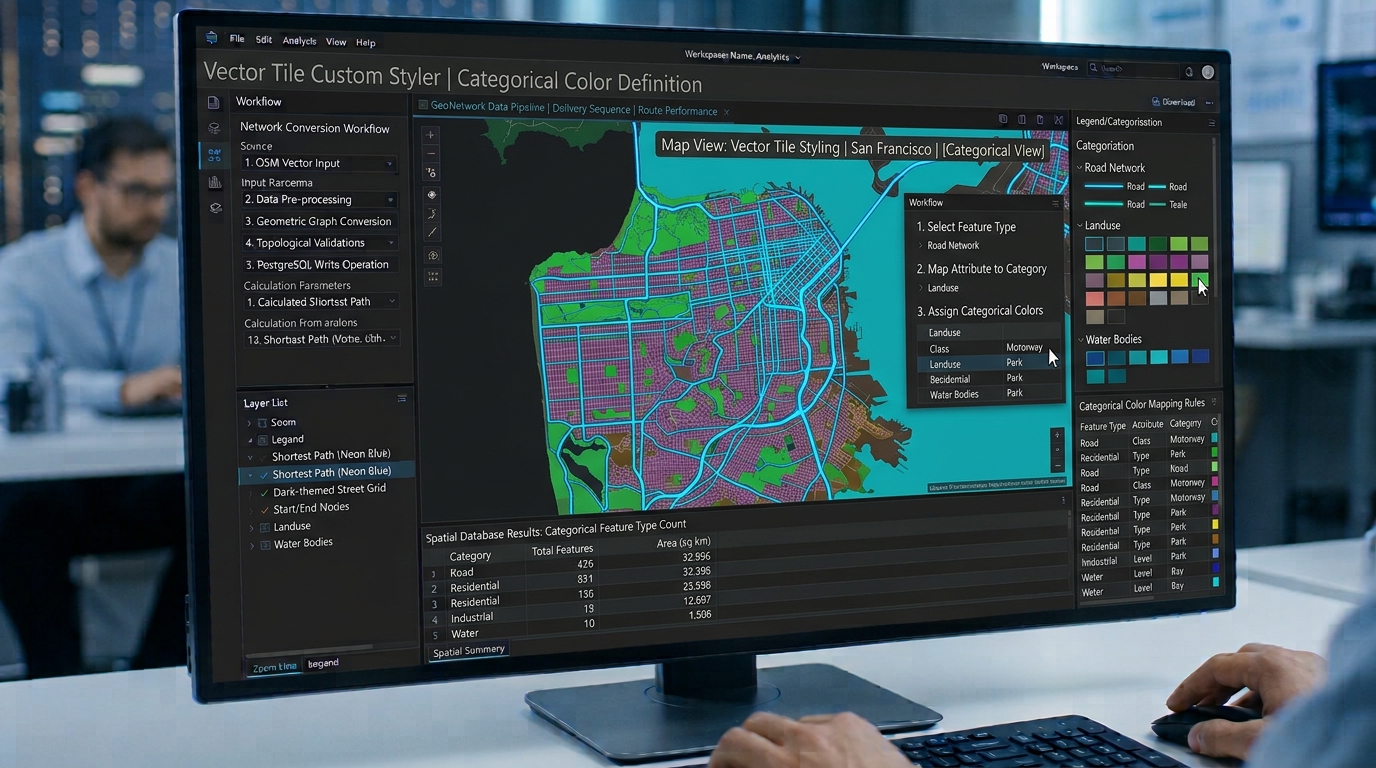
Building High-Performance Web Maps with MapLibre GL JS and Open-Source Vector Tiles
Introduction
MapLibre GL JS vector tiles revolutionize modern web mapping by enabling high-performance spatial rendering, smooth client-side styling, and scalable open-source GIS infrastructure without relying on proprietary SDKs. Modern web mapping requires more than displaying geographic data on a page. A production web GIS must load spatial information quickly, render complex geometries smoothly, respond to user interactions, and scale across desktop and mobile devices. Traditionally, developers have addressed these requirements using commercial mapping platforms that combine a rendering library, hosted tiles, geocoding, and proprietary style services.
The licensing changes to Mapbox GL JS in December 2020 prompted the development of MapLibre GL JS, an open-source fork of the original Mapbox GL JS 1.x codebase. MapLibre has since evolved into an independently developed WebGL mapping library distributed under the three-clause BSD license. It supports interactive vector-tile rendering without requiring the application itself to depend on a proprietary mapping SDK.
For developers building an open-source web mapping stack, the key architectural decision is to separate rendering from data delivery. MapLibre GL JS renders geographic features in the browser, while vector-tile infrastructure supplies only the features needed for a particular map view. PMTiles can package an entire tileset into a single archive, while a tile server such as Martin can publish vector tiles generated from PostGIS.
This tutorial develops a working MapLibre application, connects it to an open vector-tile archive, demonstrates attribute-driven styling, and explains how to optimize large point and polygon datasets.
1. Understand the open-source mapping architecture
A scalable implementation separates four responsibilities.
Rendering: MapLibre GL JS manages the map canvas, camera, vector features, interactive controls, and style expressions.
Data delivery: Vector tiles deliver geographically subdivided features at different zoom levels. Instead of transferring a nationwide road network as one enormous GeoJSON file, the browser requests only the tiles needed for the visible area.
Storage and tile generation: PMTiles stores tiled data in a single archive suitable for static hosting and HTTP range requests. Alternatively, a tile server such as Martin can serve data from PostGIS tables and views.
Presentation: A MapLibre style defines how sources become visible layers, including line widths, polygon fills, symbols, filters, and labels.
The resulting architecture can be represented as:
OSM / PostGIS / processed GIS data
                |
                v
      Vector tile generation
       /                  \
      v                    v
   PMTiles archive      Tile server
   Static hosting       Martin / PostGIS
       \                  /
        v                v
       MapLibre GL JS browser
                |
                v
     Interactive Web GIS application
The advantages extend beyond software licensing. Developers can choose their own hosting, control tile-generation pipelines, and avoid coupling the rendering code to one mapping provider.
However, open-source rendering does not automatically make every map resource free. Tile hosting, server infrastructure, fonts, external data, and their respective licenses still require consideration.
2. Initialize MapLibre GL JS
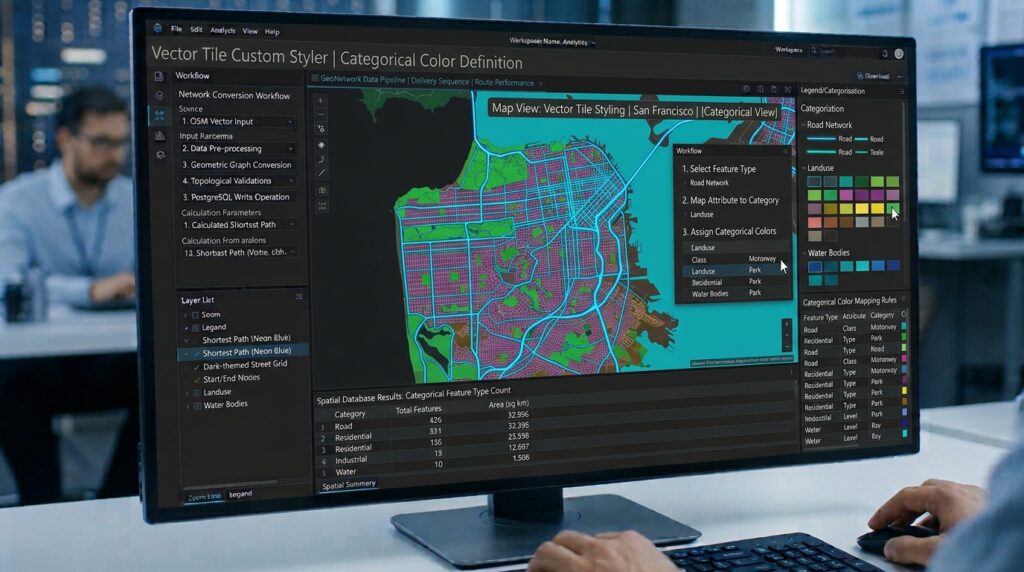
We’ll use Vite for development and npm for dependency management. The tutorial uses MapLibre GL JS 6.15.0, released in October 2026, and PMTiles 3.2.0 for the example integration. Pinning versions makes the build reproducible; review subsequent releases before upgrading.
Create the project
Install Node.js and npm, then run:
npm create vite@latest open-vector-map -- --template vanilla
cd open-vector-map
npm install
npm install maplibre-gl@6.15.0 pmtiles@3.2.0
npm run dev
The project uses Vite’s development server to serve the HTML, CSS, and JavaScript modules.
Replace the starter markup in index.html with:
<!doctype html>
<html lang="en">
  <head>
    <meta charset="UTF-8" />
    <meta name="viewport" content="width=device-width, initial-scale=1.0" />
    <meta
      name="description"
      content="Interactive open-source vector map built with MapLibre GL JS."
    />
    <title>Open Vector GIS</title>
  </head>
  <body>
    <header class="map-header">
      <h1>Open Vector GIS</h1>
      <p>Interactive vector mapping with MapLibre GL JS</p>
    </header>

    <main>
      <div id="map" aria-label="Interactive geographic map"></div>
    </main>

    <script type="module" src="/src/main.js"></script>
  </body>
</html>
Create or replace src/style.css:
* {
  box-sizing: border-box;
}

html,
body {
  margin: 0;
  min-height: 100%;
  font-family: system-ui, sans-serif;
}

body {
  background: #f3f6f8;
  color: #1f2937;
}

.map-header {
  padding: 12px 20px;
}

.map-header h1 {
  margin: 0;
  font-size: 1.35rem;
}

.map-header p {
  margin: 4px 0 0;
  color: #52606d;
}

#map {
  width: 100%;
  height: calc(100vh - 100px);
  min-height: 400px;
}
A defined map-container height is essential. Without a usable height, MapLibre’s rendering surface may collapse or appear blank. The MapLibre stylesheet must also be loaded for built-in controls and popups to display correctly.
Understand the style document
MapLibre uses a JSON style document conforming to the MapLibre Style Specification. The version property identifies the style schema version, not the JavaScript library version. The examples below use style specification version 8.
A style document has three principal components:
sources: the geographic data available to the map.layers: the visual representations of that data.paintandlayout: the appearance, placement, and behavior of individual layers.
A vector source does not automatically become visible. A style layer must reference it and, for vector-tile data, identify the relevant source-layer within the tiles.
3. Connect an open-source vector-tile source

There are two practical approaches: load a PMTiles archive directly, or connect to a self-hosted tile service.
Option A: Load PMTiles directly
PMTiles stores a tile pyramid in one archive, allowing a browser to request individual tiles using HTTP range requests rather than downloading a separate file for every tile. The PMTiles JavaScript library registers a custom URL protocol that enables MapLibre to read this archive.
Create src/main.js:
import * as maplibregl from "maplibre-gl";
import { Protocol, PMTiles } from "pmtiles";

import "maplibre-gl/dist/maplibre-gl.css";
import "./style.css";

// Public demonstration archive.
// Replace this with a tileset you control in production.
const PMTILES_URL =
  "https://pmtiles.io/protomaps(vector)ODbL_firenze.pmtiles";

const protocol = new Protocol();

// Register the custom protocol once per application.
maplibregl.addProtocol("pmtiles", protocol.tile);

async function initializeMap() {
  const archive = new PMTiles(PMTILES_URL);

  // Reuse the archive instance through the protocol handler.
  protocol.add(archive);

  // Obtain the archive's geographic center and zoom limits.
  const header = await archive.getHeader();

  const map = new maplibregl.Map({
    container: "map",
    center: [header.centerLon, header.centerLat],
    zoom: Math.max(header.minZoom, header.maxZoom - 2),
    style: {
      version: 8,

      sources: {
        city: {
          type: "vector",
          url: `pmtiles://${PMTILES_URL}`,
          attribution:
            '© <a href="https://openstreetmap.org/copyright">' +
            "OpenStreetMap contributors</a>"
        }
      },

      layers: [
        {
          id: "background",
          type: "background",
          paint: {
            "background-color": "#edf2f4"
          }
        },
        {
          id: "landuse-fill",
          type: "fill",
          source: "city",
          "source-layer": "landuse",
          paint: {
            "fill-color": "#b7d8b0",
            "fill-opacity": 0.8
          }
        },
        {
          id: "roads-line",
          type: "line",
          source: "city",
          "source-layer": "roads",
          paint: {
            "line-color": "#596579",
            "line-width": [
              "interpolate",
              ["linear"],
              ["zoom"],
              5, 0.4,
              12, 1.5,
              16, 4
            ]
          }
        },
        {
          id: "outside-mask",
          type: "fill",
          source: "city",
          "source-layer": "mask",
          paint: {
            "fill-color": "#edf2f4"
          }
        }
      ]
    }
  });

  map.addControl(
    new maplibregl.NavigationControl(),
    "top-right"
  );

  map.addControl(
    new maplibregl.ScaleControl({
      maxWidth: 120,
      unit: "metric"
    }),
    "bottom-left"
  );

  map.on("error", (event) => {
    console.error("MapLibre error:", event.error);
  });

  map.on("load", () => {
    console.log("Vector map loaded successfully.");
  });

  return map;
}

initializeMap().catch((error) => {
  console.error("Failed to initialize the map:", error);
});
This example uses the public Firenze demonstration tileset documented by MapLibre. Its style-layer names (landuse, roads, and mask) match that example archive; different PMTiles archives may use different source-layer names.
The PMTiles URL and the corresponding protocol registration are the critical parts of the integration:
maplibregl.addProtocol("pmtiles", protocol.tile);

const source = {
  type: "vector",
  url: `pmtiles://${PMTILES_URL}`
};
The pmtiles:// prefix tells the library to use the registered protocol handler. It is not a replacement for the archive’s actual HTTPS URL.
For production, host your own tileset, verify that the server supports HTTP range requests, and configure appropriate CORS response headers. Follow the data provider’s attribution and licensing requirements.
Option B: Connect a self-hosted tile server
If your spatial data is stored in PostGIS, use a tile server such as Martin to expose vector tiles over HTTP. Martin can publish tiles from PostgreSQL tables, views, and suitable database functions.
A MapLibre vector source may look like this:
map.addSource("assets", {
  type: "vector",
  url: "https://tiles.example.org/assets/tiles.json"
});

map.addLayer({
  id: "assets-points",
  type: "circle",
  source: "assets",
  "source-layer": "assets",
  paint: {
    "circle-radius": 5,
    "circle-color": "#e76f51"
  }
});
Replace the example URL and source-layer name with those published by your tile server. A TileJSON endpoint supplies metadata about the tile templates, zoom levels, and available layers.
Alternatively, the source may provide a direct template:
map.addSource("assets", {
  type: "vector",
  tiles: [
    "https://tiles.example.org/tiles/{z}/{x}/{y}.pbf"
  ],
  minzoom: 0,
  maxzoom: 14
});
Use the first method when the server publishes TileJSON and the second when you need to define the tile URL template yourself. For either approach, ensure that the tile data uses a compatible vector-tile format and that each layer references the correct internal source-layer.
4. Style vector features using attribute data
A major advantage of vector mapping is that visual rules can depend on feature attributes. Instead of creating a separate static map for each road category or population class, one layer can render features differently based on their properties.
MapLibre expressions support operations such as get, match, case, step, and interpolate. These expressions let a style document act as a lightweight visualization specification.
Suppose your road tiles contain a string attribute called class with values such as motorway, primary, secondary, and local. The following layer assigns colors according to road class:
map.addLayer({
  id: "roads-by-class",
  type: "line",
  source: "city",
  "source-layer": "roads",

  paint: {
    "line-color": [
      "match",
      ["get", "class"],
      "motorway", "#d1495b",
      "primary", "#ed9b40",
      "secondary", "#e9c46a",
      "local", "#a8b4c0",
      "#64748b"
    ],

    "line-width": [
      "interpolate",
      ["linear"],
      ["zoom"],
      6, 0.5,
      10, 1.2,
      14, 2.5,
      18, 6
    ]
  }
});
The match expression uses the class attribute to select a color. The interpolate expression increases road width as the map zooms in. The fallback color handles unexpected class values.
Important: This example assumes the tiles contain the class property. If your data uses highway, road_type, or another field, change the expression accordingly. The source-layer name identifies the layer inside the vector tiles, while get accesses a property on each feature. These are different concepts.
Visualize numeric attributes
For population density, traffic volume, or building height, use numeric expressions.
map.addLayer({
  id: "population-density",
  type: "fill",
  source: "population",
  "source-layer": "districts",

  paint: {
    "fill-color": [
      "interpolate",
      ["linear"],
      ["get", "density"],
      0, "#fff7bc",
      1000, "#fec44f",
      5000, "#fe9929",
      10000, "#cc4c02"
    ],

    "fill-opacity": 0.75,
    "fill-outline-color": "#ffffff"
  }
});
This layer assumes the districts source-layer contains a numeric density property. The color interpolates continuously between defined stops.
For categorical analysis, match is usually clearer. For continuous measurements, interpolate can create smoother visual transitions. For stepped classifications, consider step so each value range receives a distinct symbol or color.
To update presentation without retransmitting the dataset, change the layer’s paint properties:
map.setPaintProperty(
  "roads-by-class",
  "line-width",
  3
);
This is useful for user-controlled styles, selected thematic variables, and interactive map dashboards.
5. Optimize client-side rendering performance

A high-performance web map requires optimization at multiple stages: data preparation, tile delivery, browser rendering, and interaction.
Use vector tiles for large static datasets
GeoJSON is excellent for small, dynamic datasets, but loading millions of features as one document can consume significant memory and delay rendering. The browser must download, parse, and process that large collection before the map can display it effectively.
Vector tiles subdivide geographic data spatially and generally limit the work required for each viewport. For large static datasets, pre-generated vector tiles or a tile server are often more appropriate than a single huge GeoJSON source.
Before generating tiles:
- Remove attributes that the application never displays or queries.
- Simplify geometries to match the intended zoom levels.
- Avoid excessive coordinate precision.
- Clip and buffer tile boundaries correctly to prevent visible gaps in lines and polygons.
- Set sensible minimum and maximum zoom levels.
These measures reduce transfer size and the number of vertices the browser must render. MapLibre’s large-data optimization guide also recommends simplifying data, chunking large datasets where appropriate, and using vector tiles for larger workloads.
Limit visible features by zoom
A national map does not need to display every local road or building at country scale. Configure tile generation to generalize data and omit details at zoom levels where they cannot be meaningfully displayed.
For example, a road layer can have a minimum zoom:
map.addLayer({
  id: "local-roads",
  type: "line",
  source: "city",
  "source-layer": "roads",
  minzoom: 11,
  paint: {
    "line-color": "#9ca3af",
    "line-width": 1
  }
});
The layer does not render below zoom level 11. Similarly, a detailed building layer can begin at a higher zoom while generalized buildings or land-use polygons remain visible farther out.
Avoid unnecessary layers and duplicate geometry
MapLibre separates sources from visual layers, allowing a single source to support several styles. Use that capability carefully: avoid maintaining multiple copies of the same geographic data merely to apply different visual treatments.
Each additional layer introduces rendering work. Keep layer definitions focused, and simplify filters and expressions where possible. If multiple thematic layers are necessary, measure their impact rather than assuming that every added layer is free.
Cluster dense point data
For a small or medium GeoJSON point dataset, built-in clustering can improve readability and reduce the number of individually rendered symbols.
map.addSource("facilities", {
  type: "geojson",
  data: "/data/facilities.geojson",
  cluster: true,
  clusterMaxZoom: 14,
  clusterRadius: 45
});

map.addLayer({
  id: "facility-clusters",
  type: "circle",
  source: "facilities",
  filter: ["has", "point_count"],
  paint: {
    "circle-color": "#2878b5",
    "circle-radius": [
      "step",
      ["get", "point_count"],
      14,
      100, 20,
      500, 28
    ]
  }
});

map.addLayer({
  id: "facility-count-labels",
  type: "symbol",
  source: "facilities",
  filter: ["has", "point_count"],
  layout: {
    "text-field": ["get", "point_count_abbreviated"],
    "text-size": 12
  }
});

map.addLayer({
  id: "individual-facilities",
  type: "circle",
  source: "facilities",
  filter: ["!", ["has", "point_count"]],
  paint: {
    "circle-radius": 4,
    "circle-color": "#e76f51"
  }
});
Clustering here is provided by the GeoJSON source. For very large nationwide point datasets, cluster or aggregate features during tile generation instead of sending all points to the browser.
Prefer style layers over thousands of DOM markers
HTML markers are useful when a map needs a small number of custom interactive elements. However, thousands of independent DOM markers create browser layout and event-handling overhead.
Use MapLibre’s circle, symbol, line, and fill layers for large feature collections. They are integrated with the map rendering pipeline and are generally better suited to dense datasets.
For frequently updated features, avoid repeatedly replacing an enormous GeoJSON collection when a smaller update or feature-state change is sufficient. Stable feature identifiers can help with highlighting, selection, and hover behavior without rebuilding the entire dataset.
Measure rather than guess
Test on the slowest devices and network connections your audience is likely to use. Profile tile transfer sizes, time to first useful render, memory consumption, interaction responsiveness, and performance when zooming across dense urban areas.
Distinguish network latency from browser rendering cost. Smaller tiles may improve initial loading but increase request counts; larger tiles may reduce requests but increase decoding and rendering work. The correct tile size and zoom strategy depend on the dataset, hosting, and user behavior.
6. Migrate an existing Mapbox GL JS application
For applications built on the open-source Mapbox GL JS 1.x APIs, migration to MapLibre can be relatively straightforward. The libraries share much of their original API design, but they have diverged since Mapbox’s licensing change. A successful migration therefore requires more than replacing the package name.
Install MapLibre:
npm uninstall mapbox-gl
npm install maplibre-gl
Update the import and stylesheet:
// Before
import mapboxgl from "mapbox-gl";
import "mapbox-gl/dist/mapbox-gl.css";

// After
import * as maplibregl from "maplibre-gl";
import "maplibre-gl/dist/maplibre-gl.css";
Update constructor references:
// Before
const map = new mapboxgl.Map({
  container: "map",
  style: "..."
});

// After
const map = new maplibregl.Map({
  container: "map",
  style: "..."
});
MapLibre GL JS 6 is distributed as ES modules. If the project still uses CommonJS require() or older script-tag loading patterns, modernize the imports and bundler configuration using the v5-to-v6 migration guide.
Next, audit every external dependency. A proprietary Mapbox style URL, API token, sprite resource, font endpoint, or hosted tileset will not automatically become an open-source resource when the rendering library changes.
Replace those dependencies with resources you are authorized to use, including self-hosted tiles, open vector-tile archives, and compatible style assets. Test controls, expressions, plugins, and custom layers individually. The official Mapbox migration guide documents additional migration considerations.
Finally, test attribution, CORS, zoom limits, and error handling before deploying. A migration is complete only when both the rendering code and its data-delivery infrastructure operate correctly.
Image placeholder
[Image 1: Web browser rendering a custom-styled vector tile map using MapLibre GL JS]
Alt text: “Web browser screenshot displaying a custom-styled, high-performance vector tile map rendered via MapLibre GL JS.”
The screenshot should show the rendered map, navigation controls, and a visible example of attribute-driven styling, such as roads displayed with different colors according to their classifications.
SEO best practices and internal linking
Include the primary keyword naturally in the title, introduction, and a relevant heading. Complement it with phrases such as “open-source vector tile rendering,” “self-hosted web GIS,” and “high-performance interactive mapping” rather than repeating the exact keyword unnaturally.
Link readers to these related technical tutorials:
- Vector Tiles vs. Traditional Raster Tiles — explain the differences in rendering, styling flexibility, data delivery, and use cases.
- Web-Based Vector Editing with Mapbox GL Draw — show how interactive drawing tools can integrate with a vector mapping application.
- Building Custom Leaflet Plugins — compare approaches to extending web mapping interfaces with reusable controls.
Replace the sample paths with the actual published URLs. Contextual links should help developers move from basic rendering to data architecture, editing, and interface customization.
Conclusion
MapLibre GL JS provides a flexible foundation for building interactive web GIS applications without requiring a proprietary rendering SDK. When combined with PMTiles for static tile delivery or Martin for database-backed vector tiles, it supports a mapping architecture that can scale beyond the limits of large client-side GeoJSON documents.
The most important performance gains come from designing the entire pipeline together: simplify and generalize data before tiling, deliver only the features needed for the current map view, use attribute-driven style expressions, limit unnecessary layers, and profile rendering on real devices.
For developers migrating from Mapbox GL JS, the rendering API may feel familiar, but data sources, styles, plugins, licensing, and hosting must be reviewed independently. A carefully engineered open-source stack can provide both fine-grained cartographic control and infrastructure independence without sacrificing the responsiveness expected of a modern web map.
Technical references: MapLibre GL JS documentation, MapLibre Style Specification, PMTiles integration, MapLibre performance guide, and Martin tile server documentation.