
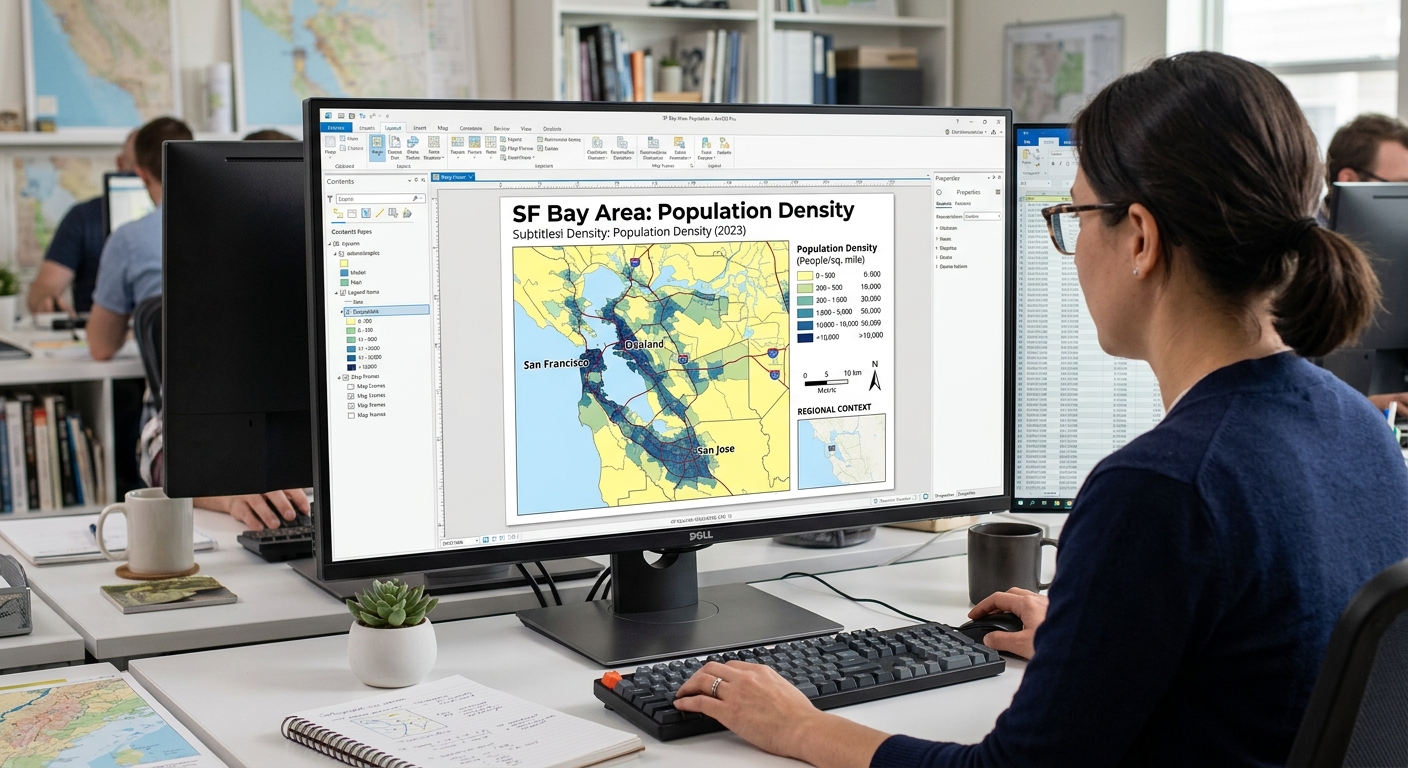
5 Layout Design Rules for Professional GIS Maps (ArcGIS Pro & QGIS)
Introduction: Why Professional Map Design Matters
When applying Layout Design Rules GIS Maps, remember that any GIS map can contain accurate data and sophisticated spatial analysis yet still communicate poorly if its layout is cluttered, its labels overlap, or its colours confuse the reader.
In university assignments, the quality of a map’s presentation affects how easily an examiner can understand the analytical result. For professional clients, a clear map helps communicate findings, reveal spatial patterns, and support decisions.
This is why cartographic design is as important as technical GIS processing.
A professional map does more than display geographic features. It guides the reader’s attention, establishes visual relationships, and presents spatial information in a form that is easy to interpret.
Whether you use QGIS or ArcGIS Pro, the same fundamental principles apply: visual hierarchy, balance, typography, colour selection, and clear legends.
This guide presents five practical Layout Design Rules for GIS Maps that you can apply to university assignments, research reports, environmental assessments, and client deliverables.
Rule 1: Visual Hierarchy and Contrast
Principle: Make the most important information stand out first.
Visual hierarchy determines the order in which readers notice elements on a map. In most thematic maps, the main data layer should attract attention before supporting features such as roads, administrative boundaries, and background imagery.
For example, suppose you are mapping vegetation loss across a county. The vegetation-loss layer should be visually dominant, while roads and settlements provide context without competing for attention.
How to establish visual hierarchy
- Emphasize the primary layer. Use stronger colour contrast, more noticeable symbols, or clearer outlines for the main analytical result.
- Reduce background intensity. Use subdued basemaps and lighter secondary boundaries so that they do not compete with the primary data.
- Create meaningful contrast. Ensure important features are distinguishable from the map background.
- Limit competing colours. Too many bright hues can make it difficult to identify the main message.
- Use symbol weight deliberately. A thicker line can emphasize a major river or boundary, while thin lines can represent secondary features.
<AsyncImage query=”professional GIS thematic map layout vegetation loss highlighted colored polygons subdued light gray basemap clear visual hierarchy cartography” aspectRatio=”16:9″ width=”100%”/>
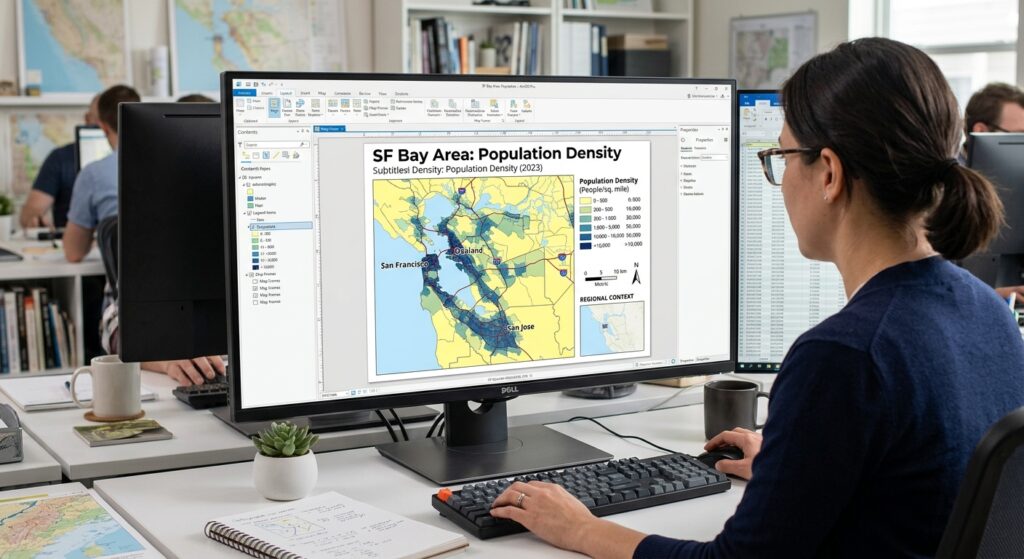
Example: Mapping population density
Imagine a choropleth map showing population density by administrative ward.
A weak design might use a bright basemap, thick boundaries, colourful roads, and saturated choropleth colours all at once. The reader has to work hard to determine which layer matters most.
A stronger design would use:
- A sequential colour scheme for population density.
- Thin, neutral administrative boundaries.
- A quiet or light basemap.
- Only the road and settlement labels needed for orientation.
This creates a visual hierarchy in which the population-density pattern is immediately visible.
Practical Workflow Using Layout Design Rules GIS Maps
In QGIS:
-
Open the layer’s Properties → Symbology or use the Layer Styling panel.
-
Adjust the fill colour, outline width, transparency, and symbol size.
-
Move supporting layers below the main thematic layer when appropriate.
-
Reduce unnecessary basemap contrast.
-
Check the map at its intended final scale.
In ArcGIS Pro:
-
Select the layer in the Contents pane.
-
Open its Symbology settings.
-
Adjust colours, symbol sizes, and outlines.
-
Reorder layers in the Contents pane to control drawing order.
-
Inspect the map at its intended layout scale.
Design test: Step back from the map or reduce its on-screen size. Can you identify the main subject within a few seconds? If not, strengthen the hierarchy.
Rule 2: Map Balance and Element Placement
Principle: Arrange map elements so that the page feels organized, not crowded.
A map layout contains more than the map frame. It may include a title, legend, scale bar, north arrow, data sources, author information, coordinate grid, and inset map.
These elements should support the main map rather than compete with it.
Balance does not necessarily mean perfect symmetry. It means distributing visual weight so that the page feels stable and intentional.
Common layout elements and their purpose
| Element | Purpose | Design recommendation |
|---|---|---|
| Map title | Identifies the subject and study area | Make it prominent, specific, and concise |
| Main map frame | Displays the geographic information | Give it most of the available page space |
| Legend | Explains map symbols and classes | Keep it close to the map without obscuring important features |
| Scale bar | Communicates map distance | Use appropriate units and tie it to the correct map frame |
| North arrow | Indicates orientation where needed | Keep it simple and avoid oversized decorative designs |
| Inset map | Shows regional location or additional detail | Use it when it adds genuine geographic context |
| Source and date | Documents data provenance | Make it readable but visually secondary |
Not every map needs every element. Esri’s layout guidance specifically notes that a legend may be unnecessary when map symbols are self-explanatory. The same principle applies to north arrows and other decorative elements: include them when they improve interpretation, not simply because a template contains them. <text color=”secondary” size=”sm”>Esri layout guidance 【turn756645search8】</text>
A simple layout structure
For a typical university report, consider this arrangement:
┌──────────────────────────────────────────┐
│              MAP TITLE                   │
│        Subtitle or study period          │
├──────────────────────────┬───────────────┤
│                          │               │
│                          │    LEGEND     │
│       MAIN MAP           │               │
│                          │    INSET MAP  │
│                          │               │
│                          │               │
├──────────────────────────┴───────────────┤
│ Scale bar     Data source     CRS / Date │
└──────────────────────────────────────────┘
This is a suggested arrangement, not a fixed template. A landscape map may work better with elements placed beneath the map, while a portrait page may benefit from a narrow information column.
Practical workflow in QGIS
-
Select Project → New Print Layout and name the layout.
-
Use Add Map to draw the main map frame.
-
Add a title with Add Label.
-
Add a legend, scale bar, and other necessary elements using the layout toolbar.
-
Use alignment guides and item properties to align the elements.
-
Leave adequate margins and whitespace around the page.
QGIS Print Layout supports positioning, sizing, grouping, and aligning elements, and can export the result to PDF or image formats. <text color=”secondary” size=”sm”>QGIS Print Layout documentation 【turn756645search3】</text>
Practical workflow in ArcGIS Pro
-
Open the Insert tab and create a new layout using an appropriate page size.
-
Insert a map frame.
-
Add the title, legend, scale bar, and north arrow where useful.
-
Use guides and alignment tools to position elements consistently.
-
Check the Contents pane for overlapping or poorly ordered layout items.
-
Save the project before exporting.
ArcGIS Pro provides layout elements that can be moved, resized, grouped, and formatted through the layout interface. <text color=”secondary” size=”sm”>ArcGIS Pro layout elements 【turn756645search1】</text>
Design test: If the legend or scale bar were removed, would the page become clearer or harder to understand? Keep only elements that contribute to interpreting the map.
Rule 3: Typography and Labeling
Principle: Every label should be readable, purposeful, and appropriately placed.
Typography influences how easily readers identify cities, roads, rivers, administrative areas, and other features. Poor labeling can make an otherwise well-designed map difficult to use.
A common student mistake is to label every feature because the data are available. Professional cartography instead prioritizes important features and reduces unnecessary text.
Choose a clear type hierarchy
Use a small, consistent set of fonts and establish a clear difference between the title, subtitles, map labels, and supporting information.
For example, a printed A4 map might use the following approximate sizes:
| Text element | Suggested starting size | Design treatment |
|---|---|---|
| Main title | 20–28 pt | Bold or semibold |
| Section heading or subtitle | 12–16 pt | Medium weight |
| Important settlement labels | 9–11 pt | Clear, readable type |
| General map labels | 7–10 pt | Normal weight |
| Source notes and credits | 7–9 pt | Simple and unobtrusive |
These are starting ranges, not rigid standards. The suitable size depends on page dimensions, map scale, output medium, audience, and viewing distance. Always test the exported PDF at its intended final size.
Practical typography rules
- Limit font families. One family with different weights is often enough.
- Use size to express importance. Major cities should generally have more visual prominence than minor settlements.
- Use consistent capitalization. For example, reserve all capitals for selected major features rather than using them for every label.
- Avoid unnecessary italics and decorative fonts. Labels must remain easy to read at normal viewing size.
- Prioritize important names. If labels conflict, show the most important features first rather than forcing all labels onto the map.
Prevent label overlap with halos
When text sits over satellite imagery, dense roads, or coloured polygons, a narrow halo or text buffer can improve contrast.
A halo is a thin outline around a label, often white for dark text. It separates the letters from the underlying map and helps keep labels readable.
<AsyncImage query=”GIS map labels with subtle white halo buffer against satellite imagery roads and polygons typography cartography comparison” aspectRatio=”16:9″ width=”100%”/>
In QGIS:
-
Open the layer’s Properties → Labels.
-
Enable labeling and choose the field containing the feature name.
-
Use the Buffer settings to add a subtle outline around the label.
-
Adjust placement and priority to reduce collisions with other labels.
-
Review the map at its intended scale.
In ArcGIS Pro:
-
Select the layer and open the Labeling tab.
-
Enable labeling and choose the label field.
-
Adjust font size, symbol colour, and placement.
-
Open the label symbol properties and configure a halo where needed.
-
Use label classes, priorities, and conflict-resolution settings for crowded areas.
Both applications provide controls for label symbol appearance and placement. <text color=”secondary” size=”sm”>QGIS label buffers 【turn907461search5】 · ArcGIS Pro label styling 【turn907461search0】</text>
Use label placement appropriate to the feature
- Points: Place settlement or facility names near the symbol without covering it.
- Lines: Place river and road names along the line where they remain legible.
- Polygons: Position area names within the polygon when space allows.
If a label cannot fit clearly, consider shortening the displayed name, reducing the label density, or using callouts for selected features.
Design test: Export a draft and read the labels at 100% viewing size. If names overlap, merge into a dense block, or become unreadable, simplify the labeling before changing the entire page design.
Rule 4: Color Theory and Palette Selection
Principle: Choose colours according to what the data represent, not simply according to personal preference.
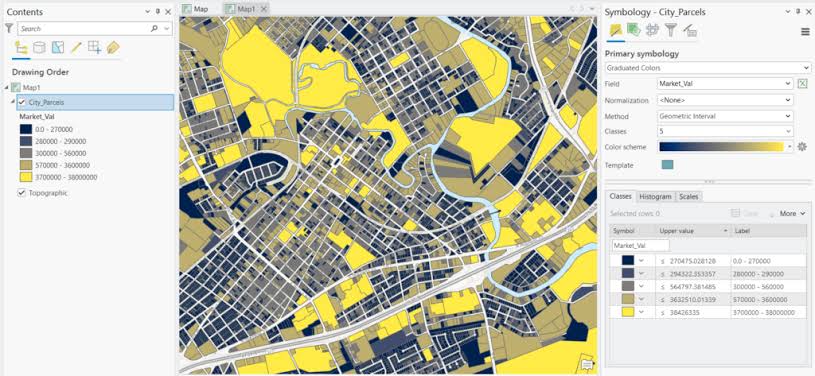
Colour is one of the most powerful tools in thematic cartography. A suitable palette allows readers to identify patterns quickly, while a poor palette can imply relationships that do not exist.
The first step is to identify the type of data you are mapping.
1. Sequential colour schemes
Use for: Ordered numerical values that progress from low to high.
Examples include population density, rainfall, elevation, household income, and vegetation index values.
A sequential palette commonly progresses from lighter to darker shades, so low values and high values are easy to distinguish.
<row gap={2}> {#each [“#f7fbff”,”#deebf7″,”#c6dbef”,”#9ecae1″,”#6baed6″,”#3182bd”,”#08519c”] as color,i} <box background={color} radius=”sm” height=”34px” flex=”1″/> {/each} </row> <text color=”secondary” size=”sm”>Illustrative sequential blue palette: lighter shades represent lower values and darker shades represent higher values.</text>
Practical example: A map of population density by ward could use a light-to-dark blue palette, with the legend clearly indicating which shade corresponds to each numerical range.
2. Diverging colour schemes
Use for: Data organized around a meaningful midpoint, such as zero, a target value, or a long-term average.
Examples include temperature anomalies, income differences relative to a regional average, and changes in vegetation index.
<row gap={2}> {#each [“#b2182b”,”#ef8a62″,”#fddbc7″,”#f7f7f7″,”#d1e5f0″,”#67a9cf”,”#2166ac”] as color,i} <box background={color} radius=”sm” height=”34px” flex=”1″/> {/each} </row> <text color=”secondary” size=”sm”>Illustrative diverging palette: contrasting hues emphasize values on opposite sides of a meaningful midpoint.</text>
The midpoint must have a clear interpretation. Do not automatically use a diverging palette simply because the data contain both high and low values.
3. Qualitative colour schemes
Use for: Categories that do not represent a numerical order.
Examples include land-use classes, soil types, administrative regions, and facility categories.
<row gap={2}> {#each [“#1b9e77″,”#d95f02″,”#7570b3″,”#e7298a”,”#66a61e”,”#e6ab02″] as color,i} <box background={color} radius=”sm” height=”34px” flex=”1″/> {/each} </row> <text color=”secondary” size=”sm”>Illustrative qualitative palette: each distinct hue represents a different category rather than a higher or lower value.</text>
A qualitative palette should help distinguish categories without implying a false ranking. For instance, forest, cropland, built-up land, water, and bare soil can be represented with visually distinct colours appropriate to the map’s purpose.
ColorBrewer provides guidance and palette examples for sequential, diverging, and qualitative schemes. <text color=”secondary” size=”sm”>ColorBrewer colour scheme guidance 【turn756645search2】</text>
Additional colour rules
- Check contrast: Labels and boundaries must remain distinguishable from their backgrounds.
- Consider colour-vision accessibility: Test whether important categories can still be separated by readers with common colour-vision deficiencies.
- Avoid relying on colour alone: Use labels, patterns, outlines, or shapes when categories must remain distinguishable in grayscale or for accessibility.
- Be consistent across map series: Use the same class colours for the same categories throughout a report.
- Do not overuse saturated colours: Reserve strong colours for the most important data or features.
Design test: Look at the legend without reading its labels. Can you tell which values are ordered and which represent separate categories? If not, reconsider the palette.
Rule 5: Legend Design and Data Normalization
Principle: A legend should explain the map quickly, and the mapped values should represent the question you are asking.
The legend is the reader’s key to understanding symbols, colours, line styles, and numerical classes. A poorly designed legend can undermine an otherwise clear map.
Common problems include automatic layer names, excessive decimal places, redundant headings, too many classes, and inconsistent units.
Clean up layer and legend names
GIS layer names are often created for data processing rather than for public communication. A layer called pop_den_v03_final2 may be understandable to its creator but confusing to a reader.
Before exporting:
-
Rename technical layers using descriptive language, such as
Population Density. -
Replace unexplained abbreviations with terms readers understand.
-
Group related symbols logically.
-
Remove layers that do not need to appear in the legend.
-
Use meaningful labels for raster classes and categorized vector layers.
-
Keep units visible in the title or legend, such as
Population density (people/km²).
Round numerical values sensibly
Suppose your classification breaks are:
12.48372 – 35.29481
35.29481 – 58.10634
58.10634 – 80.91786
These values imply more precision than most thematic maps need.
If the analysis supports it, a more readable legend might use:
12.5 – 35.3
35.3 – 58.1
58.1 – 80.9
For whole-number counts or rounded percentages, use an appropriate number of decimal places. However, do not round in a way that changes class boundaries materially or produces confusing overlaps between labels. Retain full numerical precision in the underlying data and apply sensible rounding to display labels.
Understand data normalization
In choropleth mapping, data normalization is different from simply rounding legend numbers.
Normalization adjusts numerical values to enable more meaningful comparisons. For example, mapping total population may make large administrative areas appear dominant simply because they contain more people.
If the research question concerns population concentration, population density or population per 1,000 residents may be more informative, depending on the study’s purpose.
| Mapping question | Potentially suitable measure |
|---|---|
| How many people live in each area? | Total population |
| How densely populated is each area? | Population per square kilometre |
| What share of residents has access to a service? | Percentage with access |
| How frequently does an event occur relative to population? | Rate per defined population base |
Choose the measure that answers the research question. Normalization is not always necessary: when the question concerns total demand or total service volume, raw counts may be exactly what you need.
For a normalized map, state the denominator and units clearly. For example, Clinics per 100,000 residents is more informative than a legend simply labeled Rate.
Build a focused legend
A professional legend should normally:
- Use a clear heading.
- Explain the map’s meaningful symbols and classes.
- Present sequential classes in numerical order.
- Show categories using the same symbols and colours used on the map.
- Avoid listing every background layer when those layers are self-explanatory.
- Use consistent units, number formatting, and decimal precision.
In QGIS:
-
Add a legend in Print Layout.
-
Use the legend’s item properties to control displayed layers and labels.
-
Rename layer headings and edit class labels if necessary.
-
Remove irrelevant layers from the legend.
-
Adjust spacing and font sizes to keep the legend compact.
In ArcGIS Pro:
-
Insert a legend through the Insert tab.
-
Select the legend in the layout and open its properties.
-
Remove or hide unnecessary legend items.
-
Configure headings, labels, and spacing for readability.
-
Verify that the legend reflects the intended layer visibility and symbology.
ArcGIS Pro allows legend contents and synchronization with map layers to be controlled through the legend and legend-item properties. <text color=”secondary” size=”sm”>ArcGIS Pro legend guidance 【turn756645search5】</text>
Design test: Can someone unfamiliar with your project understand the mapped variable, its units, and the meaning of the colours without asking you for an explanation?
Summary: Five-Point Checklist Before Exporting Your GIS Map
Use this checklist for your final layout in QGIS or ArcGIS Pro.
<box border radius=”lg” padding={3} gap={3}> {@body const [done,setDone] = DIL.useState([false,false,false,false,false])} {@body const items = [ {title:”Visual hierarchy”,detail:”The main result stands out, while supporting layers remain subdued.”}, {title:”Balanced layout”,detail:”The title, map frame, legend, scale bar, and other necessary elements are neatly aligned.”}, {title:”Readable typography”,detail:”Labels are legible, important features are prioritized, and overlaps are minimized.”}, {title:”Appropriate colours”,detail:”The palette matches the data type, provides adequate contrast, and supports accessibility.”}, {title:”Clear legend and data”,detail:”Layer names, units, class labels, decimal places, and normalization are explained appropriately.”} ]} <row align=”center” justify=”between”> <title size=”md”>Final map review</title> <text color=”secondary” size=”sm”>{done.filter(Boolean).length} of 5 complete</text> </row> <box background=”surface-tertiary” height=”6px” radius=”full” clip> <box background=”surface-inverted” height=”6px” radius=”full” width={`${done.filter(Boolean).length*20}%`}/> </box> {#each items as item,i} <checkbox key={item.title} checked={done[i]} onChange={v=>setDone(old=>old.map((x,j)=>i===j?v:x))}> <box gap={1}> **{item.title}** <text color=”secondary” size=”sm”>{item.detail}</text> </box> </checkbox> {/each} <button block onClick={() => setDone([false,false,false,false,false])} variant=”outline” color=”secondary”>Reset checklist</button> </box>
Before submitting the final PDF, also confirm that the page size, export resolution, map extent, scale bar, and source credits are appropriate. Open the exported PDF—not just the layout view—and inspect it at normal viewing size.
Conclusion
Professional GIS map design is not about adding more decorations or using more colours. It is about making deliberate choices that guide the reader toward the spatial information that matters.
Visual hierarchy establishes importance. Layout balance organizes the page. Typography and labeling improve readability. Colour theory helps communicate data correctly. A clean legend and appropriate normalization make the analytical result understandable.
Apply these five rules consistently, and your GIS maps will become clearer, more polished, and more suitable for university submissions, research publications, and professional communication. By mastering these Layout Design Rules GIS Maps, your university submissions will look much more professional.
The best GIS map is not the one with the most elements; it is the one that communicates the spatial message with the least unnecessary effort from the reader.