
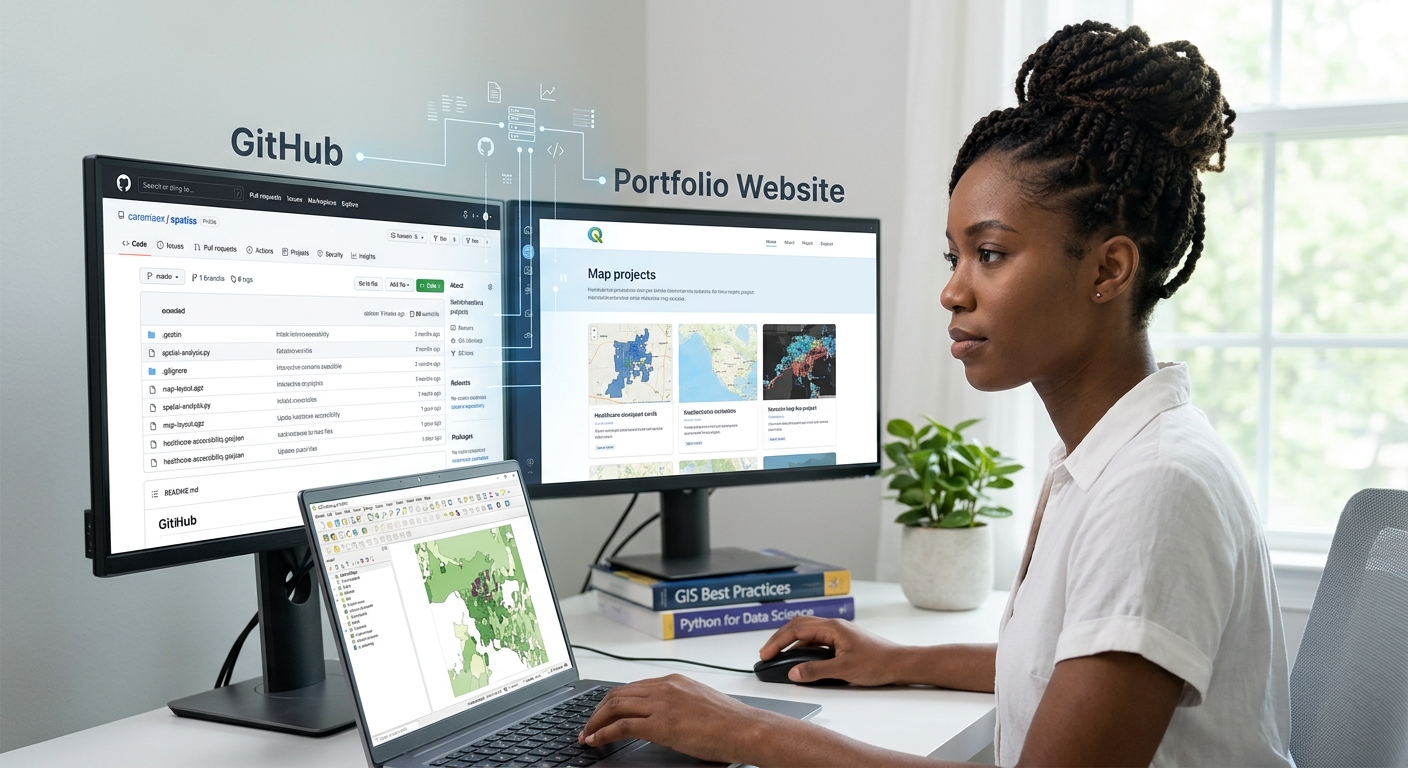
How to Build a GIS Portfolio on GitHub/Web to Land Your First Job
1. Introduction: Why Your GIS Portfolio Matters
To successfully build a GIS Portfolio GitHub web job application, candidates must showcase practical, well-documented projects that demonstrate their technical abilities. Imagine two applicants applying for the same junior GIS analyst position.Both have similar qualifications and list QGIS, ArcGIS Pro, spatial analysis, and cartography on their resumes. The first applicant provides only a resume. The second includes a link to a portfolio showing a well-designed thematic map, a documented spatial analysis project, a Python automation script, and an interactive web map.
The second applicant gives the employer something valuable: evidence of their ability to apply GIS skills to real problems.
A resume communicates what you know. A portfolio demonstrates how you use that knowledge.
For early-career GIS professionals, this distinction matters because employers may want to see whether you can prepare spatial data, solve analytical problems, communicate results, write understandable code, and deliver usable outputs.
Esri’s article on the importance of building a GIS portfolio similarly emphasizes that a portfolio can provide evidence of practical skills beyond a list of qualifications.
Your portfolio does not need dozens of projects, an expensive website, or sophisticated 3D visualizations. It needs a small collection of relevant, well-documented projects that you can explain confidently.
This guide shows you how to build a GIS portfolio using GitHub and a simple website, even if you are still a student and have no professional GIS experience.
By the end, you will understand the four projects to prioritize, how to structure your repositories, how to publish your work, and how to avoid the mistakes that make a portfolio look unfinished.
2. Four Essential Projects Every GIS Portfolio Should Include
Your first portfolio should demonstrate four complementary abilities: spatial problem-solving, cartography, programming, and web mapping.
These are not the only skills employers value, but together they provide a strong foundation for junior GIS analyst and geospatial technology roles.
Project 1: A Spatial Analysis Case Study
What it demonstrates: You can turn a geographic question into a defensible analytical workflow.
A strong GIS project begins with a problem, not simply a tool you wanted to try.
For example, you could investigate:
- Which neighbourhoods have the poorest access to healthcare facilities?
- Which locations are potentially suitable for solar energy development?
- Where has urban land cover expanded over the past decade?
- Which communities are furthest from public transport?
- How has vegetation cover changed across a local watershed?
Choose a question that can be answered using data you can access and validate.
Example project: Mapping healthcare accessibility
Suppose you want to investigate how accessible healthcare facilities are across administrative wards in a county.
A possible workflow is:
Research question
       |
       v
Collect facility locations and ward boundaries
       |
       v
Clean data and verify coordinate systems
       |
       v
Calculate distances or service areas
       |
       v
Summarize accessibility by ward
       |
       v
Map results and identify underserved areas
       |
       v
Interpret findings and limitations
Your repository should document each stage, including why you selected the methods.
What to include:
- Research question: State the problem in one or two sentences.
- Data sources: Provide the original source links, dates, and licences where available.
- Methodology: Explain the tools, processing steps, assumptions, and calculations.
- Results: Include the final map, summary statistics, and key findings.
- Limitations: Discuss missing facilities, data accuracy, travel barriers, and analytical assumptions.
- Reproducibility: Provide scripts or processing instructions where practical.
A good conclusion might say that several wards have greater straight-line distances to the nearest facility. It should not claim that those communities necessarily have the worst real-world access unless the analysis also accounts for factors such as road networks, transport availability, facility capacity, and service quality.
Recommended tools: QGIS, ArcGIS Pro, GeoPandas, PostGIS, or a combination appropriate to the project.
Portfolio tip: Include a before-and-after view or a simple workflow diagram. Recruiters should understand what you did without needing to open the GIS project itself.
Project 2: A High-Quality Cartographic Layout
What it demonstrates: You can transform spatial data into a clear, professional map.
Cartography is more than producing a map that looks attractive. It involves communicating the meaning of spatial information accurately through visual hierarchy, colour, labels, layout, and appropriate symbology.
Choose one of your analytical projects or create a standalone thematic map.
Suitable topics include:
- Population density by administrative ward.
- Land-use and land-cover classification.
- Rainfall distribution across a region.
- Flood exposure near settlements.
- Road density or public transport coverage.
Build a professional map
Your final layout should include the elements needed to understand the map, which may include:
- A clear title that describes the mapped subject and area.
- A main map with appropriate visual hierarchy.
- A useful legend with meaningful class labels and units.
- A scale bar where appropriate.
- A north arrow where it adds orientation value.
- Data sources, map date, and relevant coordinate system information.
- An inset map if readers need regional context.
Avoid adding every possible map element automatically. Include only what helps readers understand the result.
Recommended workflow:
- Clean the attribute data and verify the coordinate reference system.
- Select a classification method appropriate for the data.
- Apply an effective colour scheme and readable labels.
- Create the layout in QGIS or ArcGIS Pro.
- Export the map as a PDF or high-resolution image.
- Inspect the exported file at its intended display or print size.
What to publish: A PNG preview in your repository, a downloadable PDF, and a short explanation of the cartographic decisions you made.
Portfolio tip: Show the final map prominently. Keep the explanation concise, but explain any important decisions, such as why you mapped population density rather than raw population totals.
Mastering these core projects ensures your GIS Portfolio GitHub web job application stands out to hiring managers.
Project 3: A Python Automation or Spatial Programming Example
What it demonstrates: You can use code to make GIS tasks repeatable, efficient, and easier to audit.
Python programming is useful when processing large numbers of datasets, repeating calculations, cleaning spatial tables, or preparing maps for regular reporting.
You do not need to build a complex application for your first coding project. A small script that reliably solves one problem is a perfectly reasonable starting point.
Potential projects include:
- GeoPandas: Batch-clip several vector datasets to a study boundary.
- ArcPy: Automate the export of multiple ArcGIS Pro layouts to PDF.
- Raster processing: Calculate vegetation indices from satellite imagery.
- Data collection: Retrieve permitted public data and convert verified addresses to geographic coordinates.
- Data quality: Check coordinate systems, missing fields, duplicate records, or invalid geometries.
Example: A Python GIS quality-control script
Imagine you have a folder containing several vector datasets. Your script checks whether they have a defined coordinate reference system and reports their feature counts.
Your repository could include:
gis-data-quality-checker/
├── README.md
├── requirements.txt
├── src/
│   └── check_layers.py
├── examples/
│   └── sample_output.txt
├── screenshots/
│   └── terminal_results.png
└── LICENSE
Keep the script readable and make its purpose obvious. Use meaningful variable names, comments where they clarify decisions, and error handling for common problems.
Your README should tell the reader:
- What the script checks.
- Which Python libraries and versions are required.
- How to run it.
- What input data it expects.
- What output it produces.
- What limitations or assumptions apply.
If the project uses ArcPy, state the ArcGIS Pro and licensing requirements. ArcPy is not a standard library that every Python user can import independently.
Recommended tools: Python, GeoPandas, Shapely, pandas, rasterio, PyQGIS, or ArcPy, depending on the task.
Portfolio tip: Demonstrate the result, not just the code. Include a short sample output or screenshot showing how the script works.
Project 4: An Interactive Web Map or Web GIS Application
What it demonstrates: You can make geographic information accessible and interactive beyond desktop GIS software.
An interactive map allows users to pan, zoom, select features, explore attributes, and sometimes filter information or compare scenarios.
It can be especially valuable for demonstrating your work to people who do not use QGIS or ArcGIS Pro.
Suitable projects include:
- A map of local healthcare facilities with searchable attributes.
- A public transport access map.
- An interactive land-cover map.
- A biodiversity observation map.
- A web map presenting the results of a spatial suitability analysis.
Choose a suitable web mapping approach
| Tool | Best for | Technical level |
|---|---|---|
| QGIS with qgis2web | Exporting a QGIS project into an interactive web map | Beginner |
| Leaflet | Building a customized interactive map using JavaScript | Beginner to intermediate |
| ArcGIS Online web maps and apps | Sharing web maps and applications through the Esri ecosystem | Beginner to intermediate |
| Streamlit with a mapping library | Building a Python-based spatial data application | Intermediate |
| Custom JavaScript web GIS | Advanced interaction and tailored user experiences | Intermediate to advanced |
The qgis2web plugin exports suitable QGIS projects into Leaflet or OpenLayers web maps. It can preserve many layer styles and support popups, although not every desktop GIS feature translates directly to the web.
For your first web map, do not attempt to build a complicated platform. Start with one question, a small number of layers, readable symbols, and useful popups.
Recommended workflow:
- Prepare and style the data in QGIS or ArcGIS Pro.
- Remove irrelevant fields and rename the visible attributes.
- Export or publish the map using a suitable web mapping tool.
- Test the map on a different browser and screen size.
- Check that links, popups, legends, and interactive features work.
- Link the live map from your GitHub repository and portfolio website.
Portfolio tip: Put the live-map link near the top of the project README. A reviewer should not have to search through folders to find your finished work.
3. How to Structure Your GitHub Portfolio
GitHub is not just a place to store code. A well-organized repository can function as project documentation, a reproducibility record, and evidence of how you approach technical problems.
The GitHub README documentation explains that a README should communicate what a project does, why it is useful, and how others can use it.
3.1 Set up your GitHub profile
Start with a clear profile that identifies your geospatial interests and links to your strongest work.
- Use a professional username.
- Add a short bio, such as “GIS student focused on spatial analysis, Python automation, and web mapping.”
- Pin your best repositories.
- Add links to your portfolio website and professional profile, if available.
- Keep project descriptions specific rather than listing every tool you have encountered.
You do not need a long biography. The goal is to help a reviewer understand what kind of work you do and where to find evidence of it.
3.2 Organize each project repository
Use descriptive repository names rather than labels such as project1, final_project, or test_map.
For example:
gis-portfolio/
├── healthcare-accessibility/
│   ├── README.md
│   ├── maps/
│   ├── scripts/
│   └── workflow/
│
├── land-cover-analysis/
│   ├── README.md
│   ├── outputs/
│   ├── figures/
│   └── methodology.md
│
├── arcpy-map-export/
│   ├── README.md
│   ├── src/
│   └── requirements.txt
│
└── interactive-health-map/
    ├── README.md
    ├── screenshots/
    └── webmap-link.txt
This structure is an example, not a requirement. Each repository should contain only the files necessary to understand, reproduce, or inspect the project.
For large raster datasets, avoid committing every original file to GitHub. Explain where the data came from, how to obtain it, and what processing was performed. Include a small, legally shareable sample when useful.
3.3 Write a strong README.md
The README is often the first content a reviewer encounters. It should tell a complete story without requiring the reviewer to run your code first.
A practical structure is:
# Healthcare Accessibility Analysis
## Project Overview
What problem does this project investigate?
## Research Question
Which communities are furthest from healthcare facilities?
## Final Output

## Data Sources
- Administrative boundaries: [source link]
- Healthcare locations: [source link]
## Methodology
1. Cleaned and validated input datasets.
2. Checked and harmonized coordinate systems.
3. Calculated distances or service areas.
4. Summarized accessibility by administrative area.
5. Mapped and reviewed the results.
## Key Findings
Summarize the major patterns supported by the analysis.
## Tools Used
QGIS, Python, GeoPandas
## Reproducing the Analysis
Explain the required software, inputs, and execution steps.
## Limitations
Document assumptions and data-quality constraints.
## License and Attribution
Explain the terms that apply to your code and data.Adapt the sections to each project. A cartographic design project might focus on symbology and layout decisions, while a Python repository should explain how to run the script.
3.4 Use screenshots and workflow diagrams
A reviewer may not have the time or software required to open a large GIS project. Screenshots let them inspect your output quickly.
Include a few purposeful images, such as:
- A final map layout.
- A screenshot of an interactive map.
- A before-and-after comparison.
- A workflow diagram.
- A small sample of script output.
Use descriptive filenames like annual_rainfall_map.png instead of image3.png.
Keep images readable and compress them when necessary. Do not include dozens of redundant screenshots that make the repository difficult to navigate.
3.5 Keep your code readable
For Python projects:
- Use consistent indentation.
- Choose descriptive function and variable names.
- Break long scripts into functions when this improves readability.
- Handle expected errors and missing inputs.
- Include a
requirements.txtor environment instructions when dependencies need to be installed. - Remove unused code, hard-coded personal paths, and debug statements before publication.
For example, a function named calculate_distance_to_roads() is easier to understand than f2(). Clear naming makes the workflow more maintainable and helps reviewers follow your reasoning.
Commit changes regularly with meaningful messages, such as add raster alignment checks or document suitability model assumptions. This provides a more useful project history than a series of commits named update.
4. Build a Portfolio Website
GitHub repositories are excellent for technical documentation, but a website can provide a simpler, more visual entry point to your work.
You do not need to build a custom website from scratch. Choose a tool that matches your current skills and available time.
Option A: GitHub Pages
GitHub Pages hosts static websites directly from a GitHub repository. It supports HTML, CSS, JavaScript, and optional build processes, making it a useful option for a portfolio with project cards, screenshots, and links to web maps.
A basic setup is:
-
Create a repository for your portfolio website.
-
Add an
index.htmlor another supported entry file. -
Create sections for your projects, skills, and contact information.
-
Add images and links to your project repositories.
-
Open the repository’s Settings → Pages.
-
Select the appropriate publishing source.
-
Publish the site and test the generated URL.
GitHub Pages offers free hosting for public repositories on GitHub Free, subject to the service’s usage limits. It is a static hosting service, so it does not directly run server-side Python applications. See GitHub Pages setup and GitHub Pages limitations.
Best for: Students who want to demonstrate technical ability, learn basic web development, and maintain control over the appearance of their portfolio.
Option B: Notion
Notion Sites allows you to publish pages as websites. It can be useful when you want to organize project descriptions, screenshots, links, and methodology notes without writing HTML.
To publish:
-
Create a main portfolio page.
-
Add a short professional introduction.
-
Create a section for each of your four projects.
-
Add screenshots, methods, and links to the relevant GitHub repositories.
-
Use Share → Publish to publish the site.
-
Open the public URL in a logged-out browser to check what a visitor can see.
Check the publishing settings before sharing. Publishing a Notion page can also publish its subpages, so ensure that no private notes or unrelated content are unintentionally exposed.
Best for: Students who want to publish quickly and spend more time improving their projects than building a website.
Option C: Google Sites
Google Sites provides a visual website editor. You can create pages, add images and text, embed supported content, and publish the finished site.
A simple structure might contain:
- Home: Your name or professional identity, GIS interests, and a short introduction.
- Projects: One page for each portfolio project.
- Technical skills: GIS, programming, data management, and visualization tools you can demonstrate.
- Resume: A downloadable PDF, if appropriate.
- Contact: A professional email address or link to your preferred contact profile.
Best for: Students who want a straightforward visual presentation and do not need to write website code.
Which option should you choose?
| Your priority | Recommended starting point |
|---|---|
| Learn coding and demonstrate technical skills | GitHub Pages |
| Publish a portfolio quickly with minimal setup | Notion |
| Build a visual site using a page editor | Google Sites |
| Maintain detailed and reproducible code projects | GitHub repositories alongside any website |
You can combine these options. For instance, a Notion or Google Sites portfolio can provide a visual landing page while GitHub contains the source code and detailed documentation.
The most important thing is not the hosting platform. It is whether your work is easy to find, view, understand, and verify.
5. How to Present Your Projects to Employers
A portfolio should make it easy to answer three questions: What problem did you solve? How did you solve it? What did you learn or produce?
Use this short project-summary structure on your website:
Project title: Mapping Healthcare Accessibility in a County
Problem: Identify administrative areas with comparatively limited access to health facilities.
Approach: Clean facility and boundary data, calculate accessibility measures, summarize the results, and produce a thematic map.
Tools: QGIS, Python, GeoPandas.
Deliverables: A final map, documented processing workflow, and reproducible script.
Limitations: The analysis uses the chosen accessibility measure and input data; it does not automatically account for every aspect of healthcare access.
Keep the overview concise and make the detailed methodology available through a link.
Connect project work to your resume
Instead of writing only “Proficient in QGIS and Python,” connect your skill claims to an example.
For instance:
Developed a GeoPandas workflow to validate vector datasets, calculate spatial relationships, and export analysis results for use in QGIS.
Only use statements that accurately describe what you completed. If a project is a learning exercise, label it as such rather than implying it was commissioned by a client.
Your portfolio should supplement your resume, not replace it. Include the website link in your resume’s contact section and make the strongest relevant project easy to access.
6. Common Portfolio Red Flags to Avoid
A portfolio does not need to be perfect, but a few recurring problems can reduce its credibility.
Red flag 1: Messy or undocumented code
A large script without a README, installation instructions, or comments can be difficult to assess.
Fix: Start with a clear entry point, document the expected inputs, explain the outputs, and remove debug code that no longer serves a purpose.
Red flag 2: Attractive maps without methodology
A beautiful layout cannot show whether the analysis was appropriate.
Fix: Explain the data sources, spatial operations, classification method, coordinate system decisions, assumptions, and important limitations.
Red flag 3: Missing data attribution or licensing
Publicly accessible data are not automatically free of reuse conditions.
Fix: Document the source, attribution requirements, licence, and retrieval date. Avoid publishing sensitive personal information, confidential client data, or data you do not have permission to redistribute.
Red flag 4: Broken links and missing files
A web map that no longer loads or a repository that references missing screenshots makes your work appear unfinished.
Fix: Test your links, web maps, downloads, and screenshots before sharing the portfolio. Recheck them after major changes.
Red flag 5: Too many unfinished projects
Ten incomplete repositories may communicate less than three well-documented projects.
Fix: Prioritize the four project categories in this guide. Finish the strongest projects first, then add more when they contribute new skills.
Red flag 6: Overclaiming accuracy or professional experience
A preliminary suitability model is not proof that a location is ready for development. A model based on straight-line distances is not the same as a network travel-time analysis.
Fix: Describe what you actually measured, state your assumptions, and acknowledge limitations. Clear reasoning is a professional strength.
7. A Practical Checklist for Your First GIS Portfolio
Use this checklist to prepare your portfolio for a job application.
<box border radius=”lg” padding={3} gap={3}> {@body const [checked,setChecked] = DIL.useState([false,false,false,false,false,false,false,false])} {@body const tasks = [ “My GitHub profile has a clear bio and links to my best work.”, “I have a documented spatial analysis case study.”, “I have a polished cartographic map with a readable legend.”, “I have a Python or GIS automation project with instructions.”, “I have an interactive web map or a clearly presented web mapping example.”, “Each project includes a README, sources, methodology, results, and limitations.”, “My screenshots, data paths, dependencies, and links have been checked.”, “My resume links directly to my portfolio and strongest relevant project.” ]} <title size=”md”>Portfolio readiness review</title> {#each tasks as task,i} <checkbox key={task} checked={checked[i]} onChange={v=>setChecked(prev=>prev.map((item,j)=>i===j?v:item))}>{task}</checkbox> {/each} <divider color=”subtle”/> <row align=”center” justify=”between”> <text color=”secondary” size=”sm”>{checked.filter(Boolean).length} of {tasks.length} completed</text> <button variant=”outline” color=”secondary” onClick={()=>setChecked(Array(tasks.length).fill(false))}>Reset</button> </row> </box>
8. Conclusion: Build Evidence, Not Just a Collection of Maps
A GIS portfolio is a practical way to show employers how you think, how you work, and what you can deliver.
Your first portfolio does not need expensive hosting, advanced 3D models, or a large collection of projects. Begin with four carefully chosen examples: a spatial analysis case study, a professional map layout, a Python automation project, and an interactive web map.
Document the process, show the results, and explain the decisions behind your work. Keep your GitHub repositories organized and use a simple website to make the strongest examples easy to explore.
As you develop new skills, improve existing projects rather than adding unfinished work just to make the portfolio larger. A well-documented project history turns any standard resume into a compelling GIS Portfolio GitHub web job showcase that proves your practical capabilities.
Your first GIS job may require experience you have not yet had the opportunity to gain. A well-built portfolio helps you demonstrate the practical skills you have already developed—and gives an employer a reason to look beyond your resume.