
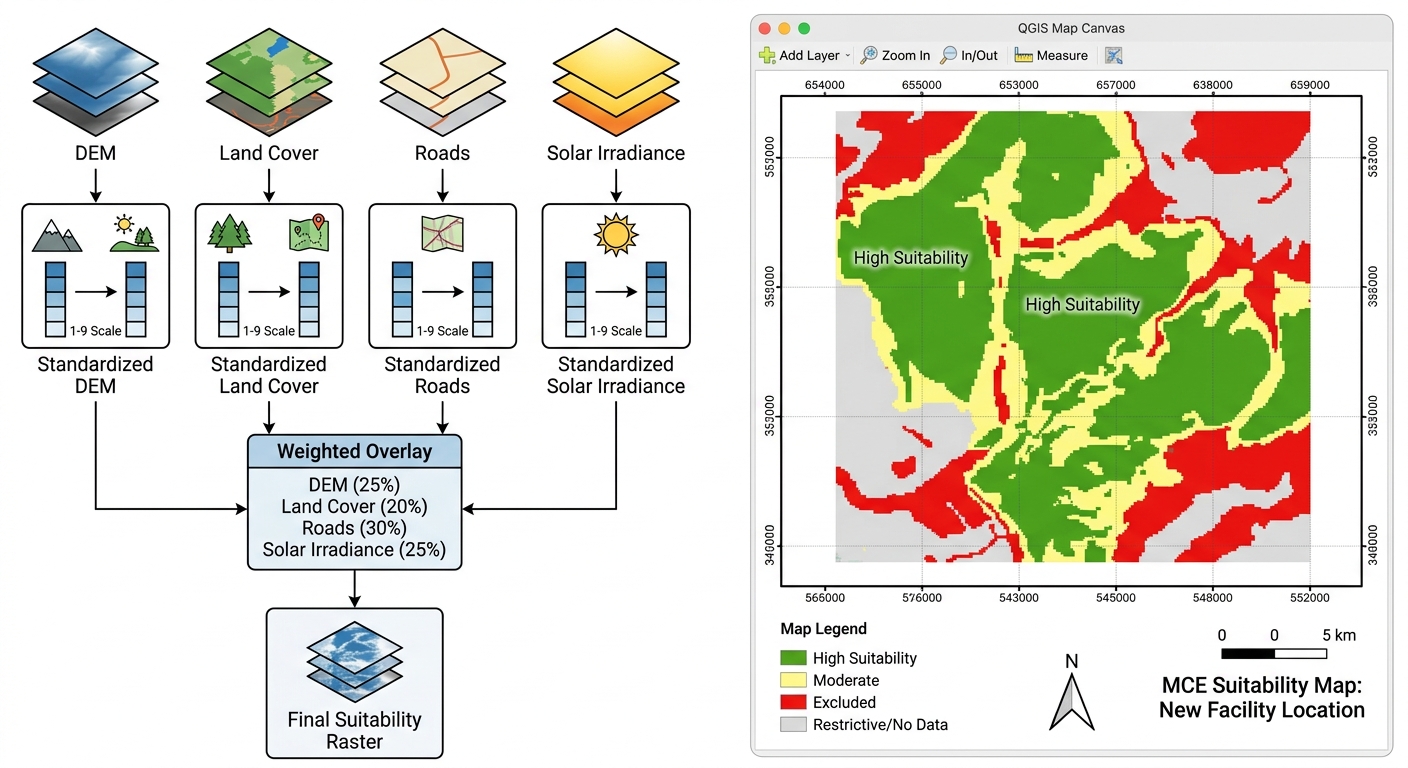
Site Suitability Analysis using Multi-Criteria Evaluation (MCE) in GIS
A practical workflow for university GIS projects using QGIS and ArcGIS Pro
Site suitability analysis is one of the most useful applications of GIS because it helps researchers identify locations that best meet a set of environmental, economic, technical, and social requirements.
This guide follows a hypothetical solar farm site-selection project to explain the complete workflow, from choosing criteria to producing and validating a suitability map.
The central idea is simple: prepare geographic data representing different site-selection criteria, standardize those criteria onto a common scale, assign relative importance to each factor, and combine them into a final suitability surface—while excluding locations where development is not permitted.
Introduction: What Is Multi-Criteria Evaluation in GIS?
Multi-Criteria Evaluation (MCE) is a structured method for evaluating locations against several criteria simultaneously. When combined with GIS, it allows spatial data to be compared and integrated to identify areas that are more or less suitable for a particular purpose.
For example, a proposed solar farm may require:
-
Relatively flat terrain to reduce construction complexity.
-
High solar irradiation to support electricity generation.
-
Reasonable access to roads and electrical infrastructure.
-
Suitable land cover that avoids sensitive ecosystems.
-
Separation from legally protected areas and other restricted locations.
No single dataset can answer all these questions. A solar-resource map may identify areas with excellent sunshine, but some of those locations may be too steep, difficult to access, or environmentally restricted.
MCE combines these different considerations into a spatial decision model.
The MCE workflow at a glance
1. Select criteria and constraints
Define what improves suitability and what rules a site out.
2. Prepare and standardize spatial data
Create aligned rasters and reclassify factor values to a common scale.
3. Assign weights and overlay factors
Combine standardized factors using a documented decision model.
4. Apply exclusions and classify results
Remove unsuitable locations and identify the most promising areas.
5. Validate and test sensitivity
Check assumptions, alternative weights, and real-world constraints.
The process follows a widely used GIS-based multi-criteria decision analysis approach: transform the criteria to a common scale, then weight and combine them. See Esri’s Multicriteria Overlay documentation.
The same principles apply to landfill placement, hospital location planning, wind farms, conservation prioritization, and other spatial decision problems. The criteria and exclusion rules must change to suit each application.
Phase 1: Criteria Selection and Constraint Identification
The first stage is deciding which geographic conditions make a location suitable and which conditions automatically disqualify it.
This distinction is fundamental to a reliable MCE model.
Step 1.1: Define the objective and study area
For this example, assume the objective is:
Identify potentially suitable locations for a utility-scale solar farm within a defined county or planning region.
Before processing data, document the basic requirements:
A rooftop solar installation and a utility-scale solar farm have different spatial requirements. A useful model must reflect the type of facility being evaluated.
Step 1.2: Identify factors
A factor is a condition that affects how suitable a location is. Its influence can vary across the study area rather than simply classifying every location as acceptable or unacceptable.
For a solar farm, possible factors include slope, solar irradiation, distance to roads, and land cover.
| Factor | Example dataset | Suitability relationship |
|---|---|---|
| Slope | Digital Elevation Model (DEM) | Flatter terrain is generally more suitable |
| Solar irradiation | Solar radiation or irradiance raster | Greater usable solar resource is generally more suitable |
| Distance to roads | Road network | Accessible locations may be more suitable |
| Land cover | Land-use or land-cover classification | Previously disturbed or appropriate open land may be preferred |
The relationships above are examples, not universal engineering rules. Some facilities require a minimum road setback, for example, even though access to roads is desirable. That setback should be treated as a separate constraint when appropriate.
Practical advice: Avoid including several highly correlated factors without justification. For instance, road distance and distance to electricity infrastructure may partly represent the same accessibility advantage. Giving both excessive weight can unintentionally count the same consideration twice.
Step 1.3: Identify constraints
A constraint is a condition that excludes a location from consideration, regardless of how well it scores on other factors.
Possible solar-farm constraints include:
-
Protected areas where the proposed development is prohibited.
-
Water bodies and wetlands, including applicable protection buffers.
-
Legally restricted zones.
-
Existing built-up areas where construction is not permitted.
-
Areas exceeding a clearly justified engineering limit.
-
Land subject to other binding planning restrictions.
For example, a protected wetland should not become an acceptable candidate simply because it has excellent solar irradiation and convenient road access.
This is why constraints should be separated from suitability factors.
Factors versus constraints
Factor
Ranks locations from relatively unsuitable to highly suitable.
Example: slope score of 1–9
Constraint
Marks locations as eligible or excluded under a defined rule.
Example: prohibited protected land
In raster analysis, constraints are often represented by a Boolean mask: one value identifies eligible cells, and another identifies excluded cells. Alternatively, excluded areas can be assigned NoData or an explicit restricted value supported by the analysis tool.
Important: Use applicable legislation, official protected-area boundaries, planning requirements, and documented technical standards to set exclusions. A student suitability model is a preliminary screening tool, not a substitute for environmental assessment, land-rights checks, engineering surveys, or regulatory approval.
Phase 2: Data Preparation and Standardization
Once the criteria are defined, prepare the input datasets so that they can be combined correctly.
The central task is to convert the different inputs into spatially aligned raster layers with comparable suitability scores.
Step 2.1: Collect and inspect the input data
For a solar-farm exercise, gather:
Inspect the source, date, scale or resolution, CRS, data quality, and intended use of each dataset.
Possible sources include government mapping agencies, official land-cover products, trusted elevation datasets, and documented solar-resource datasets.
Step 2.2: Standardize the coordinate system and raster grid
Raster overlay requires careful alignment. Two rasters can appear to overlap on the map while their pixel grids are offset from each other.
Before combining rasters:
The chosen cell size should reflect the coarsest meaningful source data and the intended decision scale. Resampling a 100 m source to 10 m does not create genuine 10 m detail.
For more on raster alignment, see the QGIS raster tools documentation.
Step 2.3: Convert vector data to raster where necessary
Weighted raster overlay requires criteria to be represented on a compatible raster grid. Not all inputs begin in raster format, so you may need to derive or convert some datasets.
Slope from a DEM
-
In QGIS, open the Processing Toolbox and locate the Slope algorithm under terrain analysis.
-
In ArcGIS Pro, use Slope in the Spatial Analyst or relevant raster-analysis tools.
-
Save the result in a suitable raster format and inspect its units, such as degrees or percent rise.
Land cover from polygons
-
In QGIS, use Rasterize (vector to raster) through the Processing Toolbox.
-
In ArcGIS Pro, use Polygon To Raster.
-
Use an appropriate categorical field to encode land-cover classes.
-
Ensure the raster cell size, extent, and alignment match the other analysis rasters.
Do not treat categorical class codes such as 1, 2, and 3 as suitability scores automatically. Those numbers may simply be identifiers for forest, grassland, and urban land. Reclassify them according to your documented criteria.
Distance to roads
A road network is usually converted into a distance raster rather than simply rasterizing road locations.
-
In QGIS, use a suitable proximity or distance algorithm.
-
In ArcGIS Pro, use Distance Accumulation or an appropriate Euclidean-distance tool.
-
Confirm the units and whether the distance is straight-line or network-based.
For local site screening, straight-line distance may be adequate for an initial model. Road-network travel distance may be more appropriate when accessibility depends on the actual transport network.
Step 2.4: Create exclusion buffers
Some constraints are based on proximity rather than just the location of a feature itself.
For example, the planning framework may require a buffer around particular water bodies or sensitive facilities.
Do not use arbitrary buffer distances simply because they produce a visually neat map. Every buffer should have a defensible source or be explicitly identified as a modelling assumption.
Step 2.5: Reclassify factors onto a common suitability scale
The input datasets contain different measurements:
-
Slope may be measured in degrees.
-
Distance to roads may be measured in metres.
-
Solar irradiation may be measured in energy per unit area over a defined period.
-
Land cover may contain categorical codes.
You cannot meaningfully add these raw values together without standardizing what they represent.
Reclassification converts original values into a common scale, such as 1–9, where:
-
1 represents very low suitability.
-
9 represents very high suitability.
The direction must be set separately for each factor. For slope, a smaller number of degrees may receive a higher suitability score. For solar irradiation, higher values may receive a higher score. Distance criteria may favour locations closer to roads, subject to any required exclusion buffer.
Here is an illustrative reclassification table for a hypothetical solar-farm model.
| Factor | Original value | Example suitability score |
|---|---|---|
| Slope | 0–3° | 9 |
| Slope | Greater than 3–5° | 8 |
| Slope | Greater than 5–10° | 6 |
| Slope | Greater than 10–15° | 3 |
| Slope | Greater than 15° | 1 |
| Road distance | 0–500 m | 9 |
| Road distance | Greater than 500–1,500 m | 8 |
| Road distance | Greater than 1,500–3,000 m | 6 |
| Road distance | Greater than 3,000–5,000 m | 3 |
| Road distance | Greater than 5,000 m | 1 |
These thresholds are illustrative only. Actual limits must be determined from technical requirements, site conditions, and the project’s purpose. The best road-distance range may not be the closest range if access buffers, safety, or other requirements apply.
Use similarly documented scoring tables for solar irradiation and land cover. For categorical land cover, explicitly state which categories are preferred, less preferred, or excluded.
In QGIS:
See the QGIS Reclassify by Table documentation.
In ArcGIS Pro:
At the end of this stage, every factor should have a clearly documented meaning, a common evaluation scale, and the same aligned raster grid.
Phase 3: Weight Assignment and Overlay Analysis
Now that the factor rasters use a common scale, the next question is how much importance each factor should contribute to the final result.
A slope requirement may be more important for one development than road accessibility. A conservation model may prioritize habitat integrity above access to roads. The weights encode these priorities.
Step 3.1: Choose a method for assigning weights
There are several ways to assign criteria weights.
Equal weighting: Give every factor the same weight. This is simple and useful as a baseline, but it assumes all criteria matter equally.
Expert judgment: Assign weights based on technical knowledge, stakeholder priorities, published standards, or a documented planning framework.
Analytic Hierarchy Process (AHP): Use pairwise comparisons to judge the relative importance of each criterion and derive weights systematically.
AHP is commonly applied to GIS suitability analysis because it provides a structured way to convert expert preferences into numerical weights. It also includes a consistency check to help identify contradictory comparisons. See this GIS–AHP site-suitability study.
Step 3.2: Assign example weights
For this hypothetical solar-farm project, suppose the criteria are weighted as follows:
| Factor | Example weight | Why it might matter |
|---|---|---|
| Solar irradiation | 35% | Influences the energy resource |
| Slope | 25% | Affects terrain suitability and construction |
| Distance to roads | 20% | Represents access to transport |
| Land cover | 20% | Represents land-use compatibility |
| Total | 100% |
These weights are demonstration values, not recommended weights for every solar-farm project. You should justify your own values using technical evidence, stakeholder requirements, or a documented decision process.
The weights must sum to 100% for the classic ArcGIS Pro Weighted Overlay tool. For formulas using decimal weights, the equivalent total is 1.0.
Step 3.3: Use pairwise comparison with AHP
In AHP, you compare the criteria in pairs. For example:
-
How much more important is solar irradiation than slope?
-
How much more important is slope than road access?
-
How important is land-cover compatibility relative to solar irradiation?
A common AHP judgment scale ranges from 1 to 9:
| Value | General meaning |
|---|---|
| 1 | Equal importance |
| 3 | Moderate preference |
| 5 | Strong preference |
| 7 | Very strong preference |
| 9 | Extreme preference |
Intermediate values can express judgments between these levels. The reverse comparison uses the reciprocal value.
Once the pairwise matrix is complete, calculate the priority weights and assess consistency. A commonly used guideline is a Consistency Ratio (CR) below about 0.10, although interpretation depends on the method and context. If the ratio exceeds that level, review the judgments for contradictions rather than accepting the weights automatically.
For a student project, you can use a documented AHP calculator or spreadsheet and include the comparison matrix, final weights, and consistency result in an appendix.
Step 3.4: Calculate the weighted suitability score
The weighted linear combination method calculates a score for every eligible raster cell by multiplying each standardized factor by its weight and adding the results.
Conceptually:
Where:
-
\(S\) is the final suitability score.
-
\(w_i\) is the weight of criterion \(i\).
-
\(x_i\) is the standardized suitability score for that criterion.
-
\(n\) is the number of criteria.
For the four-factor example:
Here, \(R\) is the solar-resource score, \(T\) is the terrain score, \(A\) is the road-access score, and \(L\) is the land-cover score.
Suppose a cell has these values:
| Factor | Score | Weight | Weighted contribution |
|---|---|---|---|
| Solar irradiation | 8 | 0.35 | 2.80 |
| Slope | 9 | 0.25 | 2.25 |
| Road accessibility | 7 | 0.20 | 1.40 |
| Land cover | 6 | 0.20 | 1.20 |
| Total suitability | 7.65 |
Because all four factor scores use the same 1–9 scale and the weights sum to 1.0, the combined score remains on that general scale. A score of 7.65 indicates relatively favourable conditions under these particular assumptions, not a universal probability of success.
Step 3.5: Run Weighted Overlay in ArcGIS Pro
ArcGIS Pro’s classic Weighted Overlay tool combines integer rasters that have been reclassified to a common suitability scale. Each raster receives a percentage influence, and the percentages must sum to 100. The tool also supports a restricted value for excluding locations. See the Weighted Overlay tool documentation.
Use the following procedure:
The classic Weighted Overlay tool requires the relevant Spatial Analyst capability. If your workflow needs floating-point output or decimal weights without integer rounding, consider an appropriate weighted-sum or raster-calculator approach instead.
Step 3.6: Calculate the weighted overlay in QGIS
QGIS provides reclassification and raster-calculator workflows for combining suitability rasters. For example, if the standardized raster layers are named solar_suit, slope_suit, road_suit, and landcover_suit, the weighted expression is:
0.35 * "solar_suit@1" +
0.25 * "slope_suit@1" +
0.20 * "road_suit@1" +
0.20 * "landcover_suit@1"
To run it:
The expression assumes all input rasters have already been reclassified to a common scale and aligned correctly.
Apply the constraint mask separately so restricted cells are excluded from the candidate areas. In QGIS, you can use a raster mask or an appropriate raster-calculator condition to preserve only eligible cells; do not let excluded cells silently contribute as if they were ordinary low-suitability values.
Why constraints should not simply receive a low score
Weighted overlay is an additive model. A location with a poor score on one factor can still receive a high overall score if the other factors are favourable.
That compensation is acceptable for some preferences, but it is inappropriate for a legal exclusion. A protected area must remain excluded even if all the other criteria score highly.
Therefore, apply the exclusions as a separate mask or supported restricted-value rule and verify that they remain excluded in the final output.
Phase 4: Output Sensitivity and Validation
A suitability map is the result of a model, not an unquestionable statement about the real world. The output depends on the selected data, classifications, weights, and exclusions.
This final phase tests whether the candidate areas remain reasonably consistent when assumptions change and checks whether the results are plausible.
Step 4.1: Classify the suitability raster
After producing the weighted score raster, classify the result into meaningful categories.
For example:
| Suitability score | Example class |
|---|---|
| 1–2 | Very low suitability |
| 3–4 | Low suitability |
| 5–6 | Moderate suitability |
| 7–8 | High suitability |
| 9 | Very high suitability |
These classes are illustrative and should be adapted to the output’s actual score distribution and the purpose of the project. If a weighted-sum calculation produces fractional values, choose break points that suit the resulting range.
In QGIS, style the output with Singleband pseudocolor or another appropriate raster renderer. In ArcGIS Pro, use Classify or Classified raster symbology, as appropriate to the output.
Use a restrained colour ramp that makes high and low suitability easy to distinguish. Make sure the excluded areas remain visibly distinct from areas that are merely low-scoring.
Step 4.2: Perform sensitivity analysis
Sensitivity analysis tests how much the model’s results change when its assumptions are adjusted.
For example, your initial model might assign a 20% weight to road access. You could run additional scenarios that assign it 10% and 30%, adjusting the other weights so that the total remains 100%.
If a candidate location remains highly suitable across several reasonable scenarios, that may suggest that the result is relatively robust to the tested assumptions. If it disappears whenever a single weight changes slightly, the conclusion is more sensitive and should be reported accordingly.
Do not choose the scenario simply because it produces the most attractive or extensive suitable area.
Step 4.3: Validate the result
Validation checks whether the resulting map is reasonable given independent evidence and actual site conditions.
For a solar-farm project:
A site may score highly in the raster model but still be unsuitable because of land ownership, grid-connection cost, local planning rules, biodiversity impacts, or geotechnical conditions that were not represented.
For a thesis: Record the input datasets, resolution, CRS, reclassification tables, weights, constraint criteria, overlay formula, validation methods, and sensitivity results. This makes the model reproducible and allows another researcher to understand why the candidate areas were selected.
Step 4.4: Extract and compare candidate sites
The suitability raster identifies locations, but a real development usually needs contiguous areas large enough for the proposed facility.
The final output should present the strongest candidate areas, but it should also show enough information for a reviewer to understand how they were identified.
Conclusion: Key Takeaways for Student Projects
Site suitability analysis using Multi-Criteria Evaluation combines different spatial datasets into a consistent, documented decision model.
The essential stages are:
-
Select criteria and constraints that reflect the actual decision problem.
-
Prepare the data with a suitable CRS, consistent raster grids, appropriate distances and buffers, and documented reclassification scores.
-
Assign weights and combine factors using a justified method such as expert weighting or AHP.
-
Apply hard exclusions so legally or environmentally restricted locations cannot become suitable through a high weighted score.
-
Test sensitivity and validate the results before interpreting the map or recommending candidate sites.
The most important lesson is that a suitability model is only as defensible as its assumptions. Clear criteria, justified weights, consistent data preparation, and careful validation matter more than producing a colourful final raster.
For a university assignment, aim to show not just where the model identifies suitable areas, but also why those areas score highly, which assumptions influence the outcome, and what further checks would be required before a real-world decision.
Further reading
-
Esri: How Weighted Overlay Works — common evaluation scales, weights, and raster combination.
-
Esri: Multicriteria Overlay — alternative overlay methods and criteria standardization.
-
QGIS: Reclassify by Table — converting raster ranges to standardized class values.
-
QGIS: Raster Tools — raster alignment and grid preparation.
-
GIS–AHP Site Suitability Study — an example of pairwise comparisons and consistency assessment in spatial suitability modelling.