
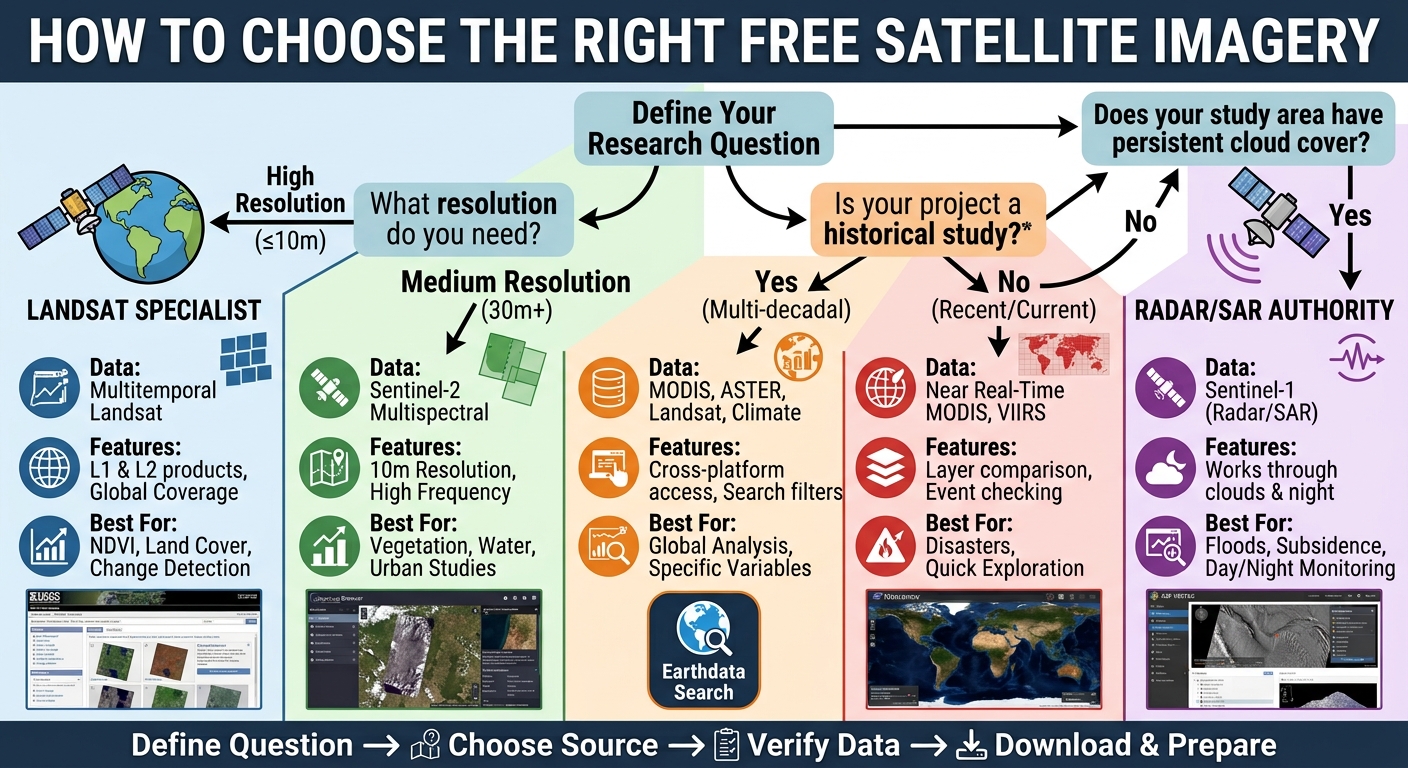
Free Satellite Imagery for GIS: Top 5 Free Sources
Introduction
Finding free satellite imagery for GIS assignments can be surprisingly frustrating. You may know that you need a Landsat or Sentinel image, but then run into confusing portals, dozens of datasets, cloud-cover problems, incompatible file formats, or imagery that does not cover your study area.
For a university GIS or remote sensing assignment, choosing the right source is just as important as knowing how to process the imagery. A poor-quality or unsuitable scene can affect NDVI calculations, land-cover classification, change detection, supervised classification, and other analysis results.
The good news is that several authoritative organizations provide satellite imagery at no cost for education and research.
This guide covers five reliable sources and shows you how to find imagery, select suitable scenes, download the data, and prepare it for GIS software such as QGIS or ArcGIS Pro.
What you will learn
| Source | Best for | Typical data |
|---|---|---|
| USGS EarthExplorer | Landsat assignments | Landsat multispectral imagery |
| Copernicus Browser | Sentinel-2 analysis | Optical multispectral imagery |
| NASA Earthdata Search | Large range of datasets | MODIS, ASTER, Landsat and more |
| NASA Worldview | Rapid visualization | MODIS, VIIRS and other products |
| ASF Vertex | Radar/SAR assignments | Sentinel-1 SAR imagery |
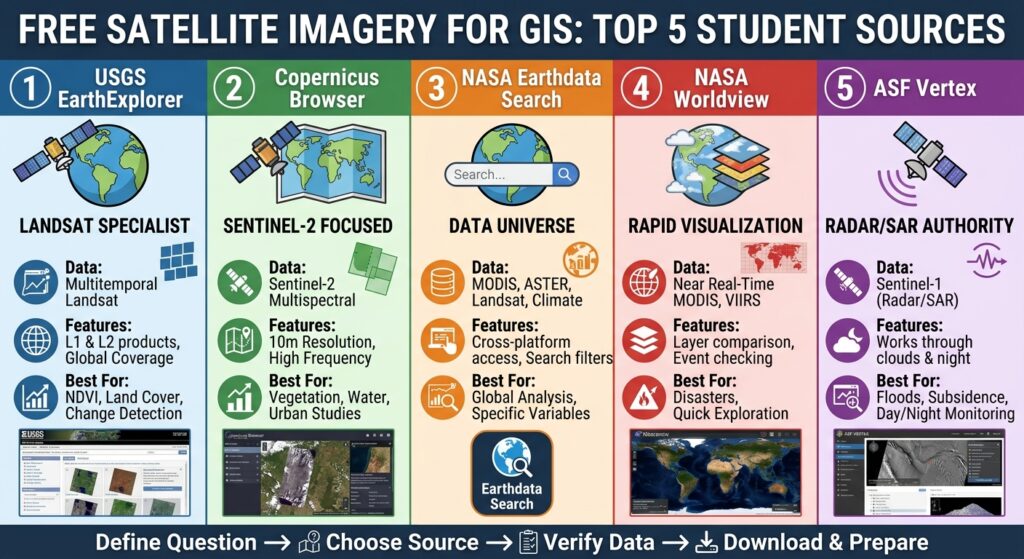
1. USGS EarthExplorer — Best for Landsat Assignments
The USGS EarthExplorer is one of the most useful starting points for students. The USGS provides Landsat products from its archive at no cost, and EarthExplorer allows you to search by geographic area, date and dataset.
Landsat is particularly useful for assignments involving NDVI, land-use/land-cover mapping, vegetation monitoring, urban expansion and change detection.
Step 1: Define your study area
Before opening EarthExplorer, determine:
- Your study-area location.
- The required acquisition date or time period.
- Your desired spatial resolution.
- Whether you need cloud-free imagery.
- Which spectral bands your analysis requires.
For example, an NDVI assignment using Landsat 8 or Landsat 9 generally requires the red and near-infrared bands.
Step 2: Search for your location
Open EarthExplorer and use the map to locate your study area.
You can define an area using:
- A place name.
- Coordinates.
- A point.
- A polygon.
- A predefined geographic area.
Then specify the date range relevant to your assignment.
Step 3: Select Landsat data
In the dataset selection section, choose the appropriate Landsat Collection 2 products.
For a typical student project, look for a suitable Landsat Collection 2 Level-2 product when surface reflectance is appropriate for the analysis.
Level-2 surface-reflectance products can be particularly useful for vegetation and land-cover studies because they have undergone additional atmospheric processing.
Step 4: Check cloud cover
Do not simply download the first result.
Compare candidate scenes and prioritize imagery with low cloud cover over your study area. A scene showing 5% total cloud cover may still have clouds directly over your study area, so inspect the thumbnail before downloading.
Step 5: Download the scene
After selecting a suitable scene:
- Open the scene’s download options.
- Choose the appropriate product.
- Download the files.
- Extract them into a clearly named project folder.
- Keep the metadata files with the raster bands.
A useful folder structure is:
GIS_Assignment/
├── raw_data/
│   └── Landsat_2026/
├── processed/
├── outputs/
└── project/
Pro Tip: Never rename individual Landsat files randomly. Their filenames contain useful information about the satellite, acquisition date, processing level and scene.
2. Copernicus Browser — Best for Sentinel-2 Imagery
For many university assignments, Copernicus Browser is arguably the easiest place to start with Sentinel imagery.
The Copernicus Data Space Ecosystem provides open and free access to Sentinel data, while Copernicus Browser allows users to search, visualize, analyze and download satellite imagery through a web interface.
Sentinel-2 is especially useful for:
- NDVI analysis.
- Vegetation mapping.
- Agriculture.
- Water-body analysis.
- Land-cover classification.
- Urban expansion.
- Environmental monitoring.
Step 1: Open Copernicus Browser
Open the Copernicus Browser and create an account if required. The current documentation states that a free account is required for using the Browser.
Step 2: Locate your study area
Use the search or map interface to navigate to your area.
For a university assignment, it is often helpful to create an approximate polygon around your study area rather than searching an entire country.
This reduces the number of candidate scenes and makes comparison easier.
Step 3: Select Sentinel-2
Choose Sentinel-2 as the data collection.
Then set:
- Date range
- Maximum cloud coverage
- Area of interest
For vegetation analysis, try to find an image with minimal cloud contamination.
Step 4: Preview the imagery
Copernicus Browser allows you to visualize imagery before downloading it. You can inspect true-color imagery and other visualizations, including vegetation-related products and spectral combinations.
This is extremely useful because you can reject unsuitable scenes before filling your computer with large files.
Step 5: Download the data
Once you find a suitable scene, select the download option.
For a simple GIS assignment, you may only need selected bands rather than the entire Sentinel-2 product.
For example, NDVI requires:
NDVI = (NIR − Red) / (NIR + Red)
For Sentinel-2, the commonly used bands are:
- B8 — Near Infrared
- B4 — Red
You can then bring those bands into QGIS or ArcGIS Pro for raster calculation.
Common Pitfall: Do not choose an image simply because its thumbnail looks attractive. Check acquisition date, cloud coverage, spatial resolution and processing level against your assignment requirements.
3. NASA Earthdata Search — Best for a Wide Range of Satellite Data
NASA Earthdata Search is useful when your assignment goes beyond the standard Landsat/Sentinel workflow.
The platform provides access to a very large collection of Earth observation datasets. Its search interface lets users filter data by keywords, time, spatial area, platform, instrument and other characteristics.
NASA Earthdata can therefore be useful for assignments involving:
- MODIS.
- Landsat.
- ASTER.
- Climate variables.
- Vegetation.
- Surface temperature.
- Atmospheric data.
- Ocean observations.
- Cryosphere research.
Step 1: Search by topic
Instead of immediately searching for a satellite name, start with the variable you need.
For example:
NDVIland surface temperatureMODISASTERvegetationsnow cover
Step 2: Define the geographic area
Use the spatial filtering tools to restrict results to your study area.
This is important because NASA’s archive contains thousands of datasets, and searching without spatial or temporal limits can produce overwhelming results.
Step 3: Apply temporal filters
Specify the date or date range required by your assignment.
For example, if your project investigates vegetation conditions during the dry season, choose imagery from the appropriate months rather than downloading an arbitrary scene.
Step 4: Examine the dataset
Before downloading, check:
- Spatial resolution.
- Temporal coverage.
- Processing level.
- File format.
- Geographic coverage.
- Available bands or variables.
Step 5: Download and document the dataset
Record the dataset name, acquisition date, processing level and source.
This information can later be included in your GIS lab report methodology.
Pro Tip: Keep a simple
data_sources.txtfile inside your project folder. Record the source, dataset name, date downloaded, acquisition date, projection and processing level. This makes writing your methodology section much easier.
4. NASA Worldview — Best for Quickly Exploring Satellite Imagery
NASA Worldview is particularly useful when your immediate goal is visual exploration rather than downloading a complete analysis-ready dataset.
NASA describes Worldview as a tool for visually exploring the planet from a satellite perspective. The platform provides multiple satellite imagery layers and allows users to investigate environmental events and changes.
It is useful for investigating:
- Wildfires.
- Floods.
- Dust storms.
- Vegetation conditions.
- Large-scale environmental changes.
- Recent satellite observations.
Step 1: Open Worldview
Launch NASA Worldview and search for your location.
Step 2: Add an imagery layer
Use the layer controls to select an appropriate satellite product.
Worldview includes imagery from instruments such as MODIS and VIIRS, among others.
Step 3: Change the date
Use the time controls to examine your study area on different dates.
This makes Worldview particularly useful for identifying a suitable period for further research.
Step 4: Compare dates
If your assignment involves environmental change, compare images before and after an event.
For example:
Before event → Event date → After event
You can use this exploration to decide which datasets deserve more detailed GIS processing.
Step 5: Use appropriate downloadable products
Remember that Worldview is primarily a visualization and exploration environment. If you need individual spectral bands for calculations such as NDVI, use a suitable downloadable dataset through a data portal such as Earthdata Search rather than treating a screenshot as analytical data.
5. ASF Vertex — Best for Radar and Sentinel-1 Assignments
Not every remote sensing assignment should use optical imagery.
If your project involves radar, flooding, surface deformation, landslides, wetlands or InSAR, look at the Alaska Satellite Facility’s Vertex platform.
ASF provides access to open Sentinel-1 data through Vertex. Sentinel-1 is Synthetic Aperture Radar (SAR), meaning it can provide useful observations independently of daylight and is much less affected by cloud cover than optical imagery.
Step 1: Define your SAR study area
Open Vertex and identify the location you want to study.
For a beginner assignment, start with a clearly defined area and a simple research question.
Step 2: Choose Sentinel-1
Select an appropriate Sentinel-1 dataset.
For many introductory GIS assignments, Ground Range Detected (GRD) products are easier to approach than more advanced SLC products.
Step 3: Filter the results
Use:
- Geographic area.
- Acquisition date.
- Dataset/product type.
- Orbit information where necessary.
Vertex provides search controls for narrowing down available scenes.
Step 4: Download the imagery
Select the scene and add the required files to the download queue.
For advanced workflows such as InSAR, SLC imagery and appropriate pairs of acquisitions are required. ASF also provides on-demand processing through HyP3 for supported Sentinel-1 workflows.
Step 5: Process the imagery
Depending on your assignment, Sentinel-1 data may be processed using:
- ESA SNAP
- QGIS
- GDAL
- Python
- ASF HyP3
Do not expect a Sentinel-1 SAR image to behave like a normal RGB photograph. Radar interpretation requires understanding concepts such as polarization, backscatter, orbit direction and incidence geometry.
Common Pitfall: Do not use Sentinel-1 simply because it is free. If your assignment specifically asks for spectral indices such as NDVI, Sentinel-2 or Landsat is normally the more appropriate starting point.
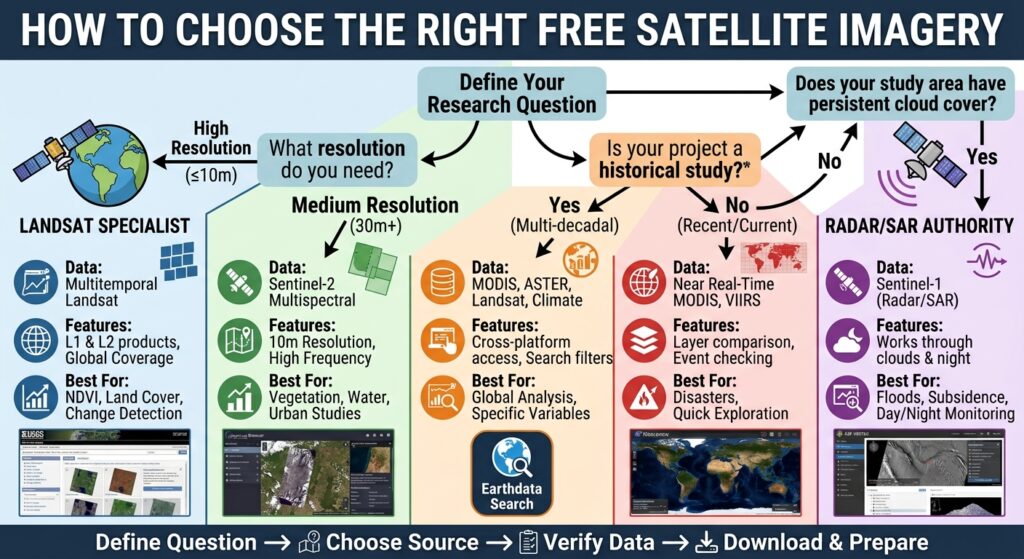
How to Choose the Right Free Satellite Imagery for GIS
The best source depends on the question you are trying to answer.
| Assignment objective | Recommended source | Why |
|---|---|---|
| NDVI | Sentinel-2 / Landsat | Red + NIR bands |
| Land-cover classification | Sentinel-2 / Landsat | Multispectral imagery |
| Historical change detection | Landsat | Long-term archive |
| Recent environmental monitoring | NASA Worldview | Rapid visualization |
| Surface temperature | NASA Earthdata | Multiple thermal datasets |
| Flood mapping | Sentinel-1 via ASF | SAR works through cloud |
| InSAR/deformation | ASF Vertex | Sentinel-1 SAR |
| General satellite-data research | NASA Earthdata | Large dataset catalogue |
The most important rule is to start with your research question, not the satellite.
If your assignment asks you to calculate NDVI, identify which dataset provides the required red and NIR bands. If the task is flood mapping during a cloudy period, SAR may be more appropriate.
How to Prepare Downloaded Imagery for QGIS or ArcGIS Pro
Downloading the data is only the first stage.
Once you have your imagery, use a consistent workflow.
Step 1: Organize the raw data
Never edit your original downloaded files.
Create separate folders for:
Raw/
Processed/
Analysis/
Maps/
Reports/
Step 2: Check the coordinate reference system
Open the raster properties in QGIS:
Layer Properties → Information
or in ArcGIS Pro:
Layer → Data → Properties
Check the coordinate reference system before beginning spatial analysis.
Step 3: Clip the imagery
If your assignment only covers a small study area, clip the raster.
In QGIS, a common route is:
Raster → Extraction → Clip Raster by Mask Layer
In ArcGIS Pro, use:
Geoprocessing → Clip Raster
Clipping reduces processing time and makes your project easier to manage.
Step 4: Check the bands
Confirm that the required spectral bands are present.
For an NDVI assignment, for example, you need the appropriate red and near-infrared bands.
Step 5: Perform the analysis
In QGIS, raster calculations can be performed using:
Raster → Raster Calculator
In ArcGIS Pro, use:
Spatial Analyst → Raster Calculator
For example:
NDVI = (NIR - Red) / (NIR + Red)Your exact band numbers will depend on the satellite and dataset you selected.
[Internal Link Context: Suggest linking to related article on Raster Calculator in QGIS and ArcGIS Pro]
Step 6: Save your outputs separately
Do not overwrite your original imagery.
Save calculated rasters in the Processed or Analysis folder and give them descriptive names such as:
sentinel2_ndvi_2026.tifCommon Mistakes Students Make When Downloading Satellite Imagery
Common Pitfall 1 — Ignoring the acquisition date: An image from the wrong season can produce misleading results, particularly for vegetation studies.
Common Pitfall 2 — Choosing imagery based only on overall cloud percentage: Always inspect whether clouds actually cover your study area.
Common Pitfall 3 — Mixing incompatible datasets: Do not compare imagery from different sensors without checking spatial resolution, acquisition dates, projections and processing levels.
Common Pitfall 4 — Using screenshots as analysis data: A visual preview is not necessarily the same thing as a scientifically appropriate raster dataset.
Which Satellite Imagery Source Should You Use?
If you are completely new to remote sensing, start with Copernicus Browser and Sentinel-2. The interface makes it relatively straightforward to find, preview and download imagery.
For a traditional Landsat assignment, use USGS EarthExplorer.
For more specialized NASA datasets, use Earthdata Search. For quick environmental visualization, use NASA Worldview. And if your assignment involves radar, flooding or InSAR, investigate ASF Vertex.
The official portals are preferable to random third-party download sites because they provide authoritative metadata and documented datasets.
Frequently Asked Questions (FAQ)
1. Where can I get free satellite imagery for GIS?
You can get free satellite imagery from USGS EarthExplorer, Copernicus Browser, NASA Earthdata Search, NASA Worldview and ASF Vertex. The best source depends on your required sensor, resolution, date and analysis.
2. Is Sentinel-2 satellite imagery free?
Yes. Copernicus provides open and free access to Sentinel data through the Copernicus Data Space Ecosystem. Sentinel-2 is widely used for vegetation, land-cover and environmental GIS assignments.
3. Which free satellite imagery is best for NDVI?
Sentinel-2 and Landsat are excellent choices for NDVI because they provide red and near-infrared spectral bands needed for the calculation. Choose imagery with an appropriate acquisition date and minimal cloud contamination.
Conclusion
Finding free satellite imagery for GIS assignments does not have to be difficult.
Start by defining your research question and study area. Then choose the appropriate source: USGS EarthExplorer for Landsat, Copernicus Browser for Sentinel-2, NASA Earthdata for diverse datasets, NASA Worldview for rapid visualization, or ASF Vertex for Sentinel-1 SAR.
After downloading your imagery, preserve the original files, verify the metadata and CRS, select the required bands, clip the study area and perform your analysis in QGIS or ArcGIS Pro.
Most importantly, document your data source, acquisition date, dataset name, processing level and workflow. Those details can make the difference between a basic map and a strong GIS lab report.
Working on a remote sensing assignment right now? Leave your satellite, study area or GIS problem in the comments, and check out our other GIS guides for practical workflows, analysis techniques and lab-report help.