
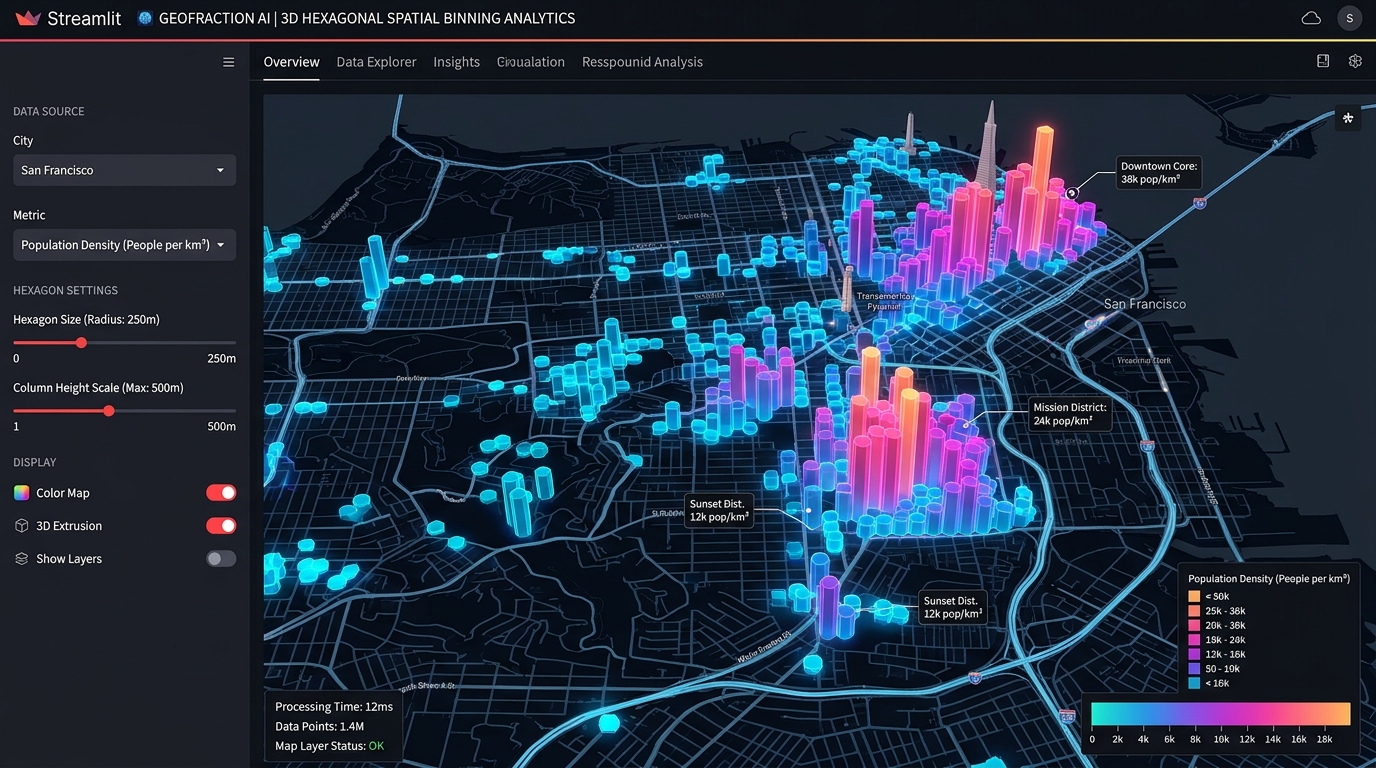
Building Interactive Spatial Analytics Dashboards in Python with Streamlit and PyDeck
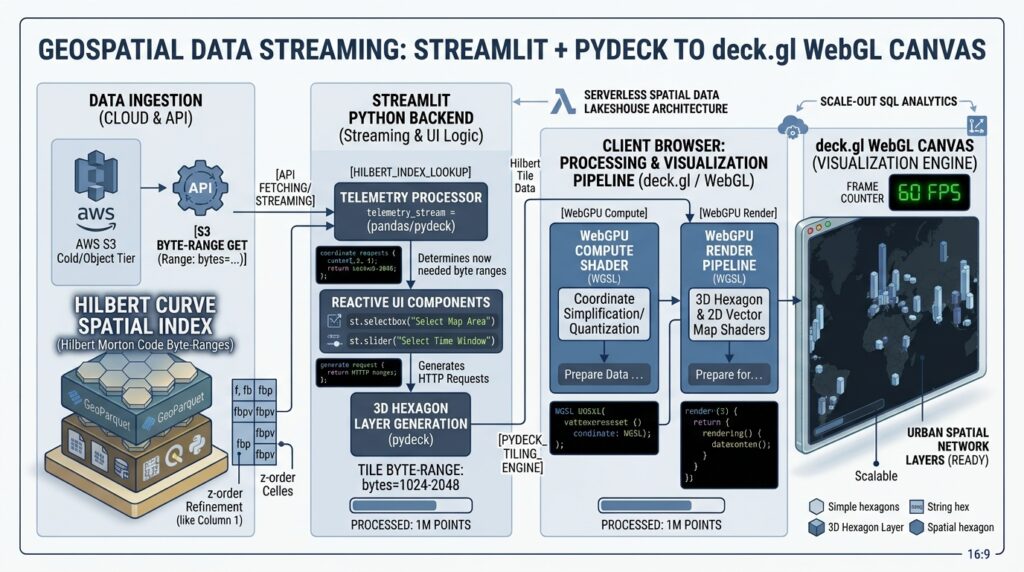
Streamlit PyDeck spatial analytics dashboards bridge the gap between heavy desktop GIS software and custom web application development, allowing data scientists to prototype and deploy high-performance 3D spatial visualizations entirely in Python. Data scientists and geospatial analysts frequently face a frustrating architectural bottleneck: transforming complex spatial analysis scripts into intuitive, client-facing web applications. Historically, building a production-ready Web GIS dashboard required mastering a fragmented technology stack—combining Leaflet.js or Mapbox GL JS for front-end rendering, HTML/CSS for responsive UI design, and Flask or Node.js for backend spatial APIs and database connection pooling.
Introduction: The Paradigm Shift in Web GIS Development
Environment & Library Setup
Bash
# Create and activate a virtual environment
python -m venv spatial_env
source spatial_env/bin/activate  # On Windows use: spatial_env\Scripts\activate

# Install core packages for Streamlit, PyDeck, and spatial manipulation
pip install streamlit pydeck pandas geopandas shapely requests matplotlib
streamlit --version and ensuring all core packages (pandas, geopandas, pydeck) import cleanly in your Python interpreter. When implementing Streamlit PyDeck spatial analytics dashboards, ensuring proper state management prevents unnecessary script reruns during user interactions.Step-by-Step Code Walkthrough
app.py) that loads geographic point datasets, filters them dynamically using sidebar widgets, and renders both 3D scatter plots and hexagonal aggregation layers.1. Setting up Streamlit PyDeck Spatial Analytics Dashboards Layout & Sidebar Widgets
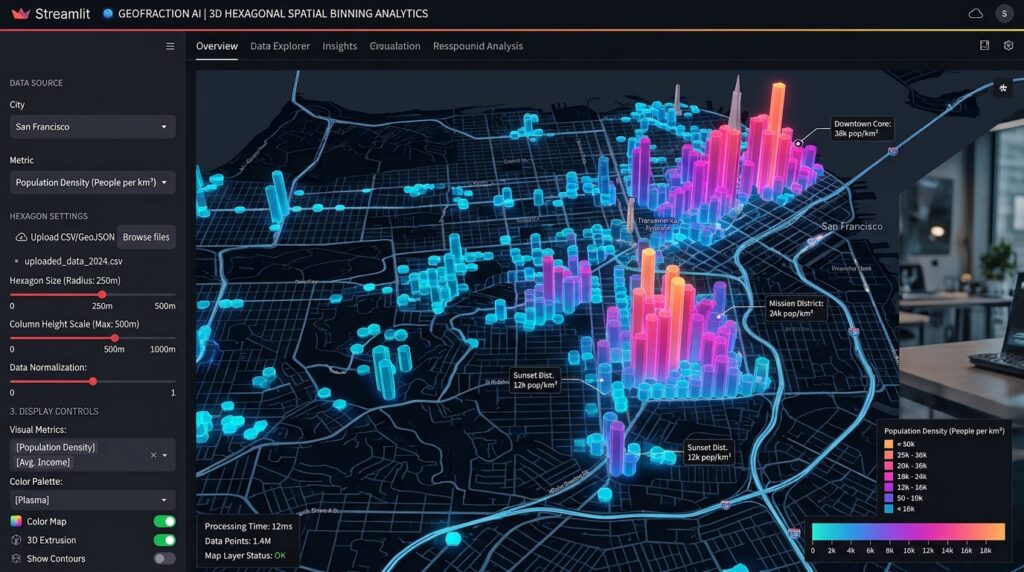
app.py. We begin by configuring the Streamlit page layout (layout="wide") and constructing sidebar widgets for user interaction, including layer selection, altitude scaling, and custom dataset uploading.Python
import streamlit as st
import pandas as pd
import pydeck as pdk
import geopandas as gpd

# Configure Streamlit page layout
st.set_page_config(
    page_title="Spatial Analytics Dashboard | Python Web GIS",
    page_icon="️",
    layout="wide",
    initial_sidebar_state="expanded"
)

st.title("Interactive Spatial Analytics Dashboard")
st.markdown("""
Explore multi-dimensional spatial distributions, 3D hexagonal bins, and point densities
using **Streamlit** and **PyDeck**.
""")

# --- SIDEBAR CONFIGURATION ---
st.sidebar.header("Dashboard Control Panel")

# Layer selection dropdown
layer_type = st.sidebar.selectbox(
    "Select Visualization Layer",
    ["3D Hexagon Aggregation", "Scatterplot Layer", "Column Extrusion Layer"]
)

# Numeric slider for elevation scaling
elevation_scale = st.sidebar.slider(
    "Elevation Multiplier",
    min_value=10,
    max_value=500,
    value=50,
    step=10
)

# File uploader for custom CSV datasets
uploaded_file = st.sidebar.file_uploader(
    "Upload Spatial CSV (must include 'lat' and 'lng')",
    type=["csv"]
)
2. Loading Spatial Datasets & Configuring PyDeck Map Layers
Python
@st.cache_data
def load_spatial_data(uploaded_file):
    if uploaded_file is not None:
        df = pd.read_csv(uploaded_file)
    else:
        # Fallback sample dataset: Recent point observations (lat, lng, value)
        url = "https://raw.githubusercontent.com/visgl/deck.gl-data/master/examples/3d-heatmap/heatmap-data.csv"
        df = pd.read_csv(url)
    return df

data = load_spatial_data(uploaded_file)

# Validate coordinate columns
if 'lng' in data.columns and 'lat' in data.columns:
    st.sidebar.success(f"Successfully loaded {len(data):,} spatial records.")
else:
    st.error("Dataset must contain 'lat' and 'lng' columns.")
Configuring PyDeck Map Layers (ScatterplotLayer, HexagonLayer, ColumnLayer)
pdk.ViewState) and a list of spatial layers (pdk.Layer).Python
# Define initial map center based on dataset averages
initial_lat = data['lat'].mean()
initial_lon = data['lng'].mean()

view_state = pdk.ViewState(
    latitude=initial_lat,
    longitude=initial_lon,
    zoom=4,
    pitch=45.0,
    bearing=0
)

# Dynamically construct the requested PyDeck Layer
layers = []

if layer_type == "3D Hexagon Aggregation":
    hexagon_layer = pdk.Layer(
        "HexagonLayer",
        data=data,
        get_position=["lng", "lat"],
        radius=15000,
        elevation_scale=elevation_scale,
        elevation_range=[0, 1000],
        pickable=True,
        extruded=True,
        coverage=0.9
    )
    layers.append(hexagon_layer)

elif layer_type == "ScatterplotLayer":
    scatter_layer = pdk.Layer(
        "ScatterplotLayer",
        data=data,
        get_position=["lng", "lat"],
        get_color='[200, 30, 0, 160]',
        get_radius=10000,
        pickable=True,
        auto_highlight=True
    )
    layers.append(scatter_layer)

elif layer_type == "ColumnLayer":
    column_layer = pdk.Layer(
        "ColumnLayer",
        data=data,
        get_position=["lng", "lat"],
        get_elevation="value",
        elevation_scale=elevation_scale,
        radius=8000,
        get_fill_color='[90, 100, 255, 180]',
        pickable=True,
        auto_highlight=True
    )
    layers.append(column_layer)
3. Linking Dashboard Filter Widgets to the Map Viewport State
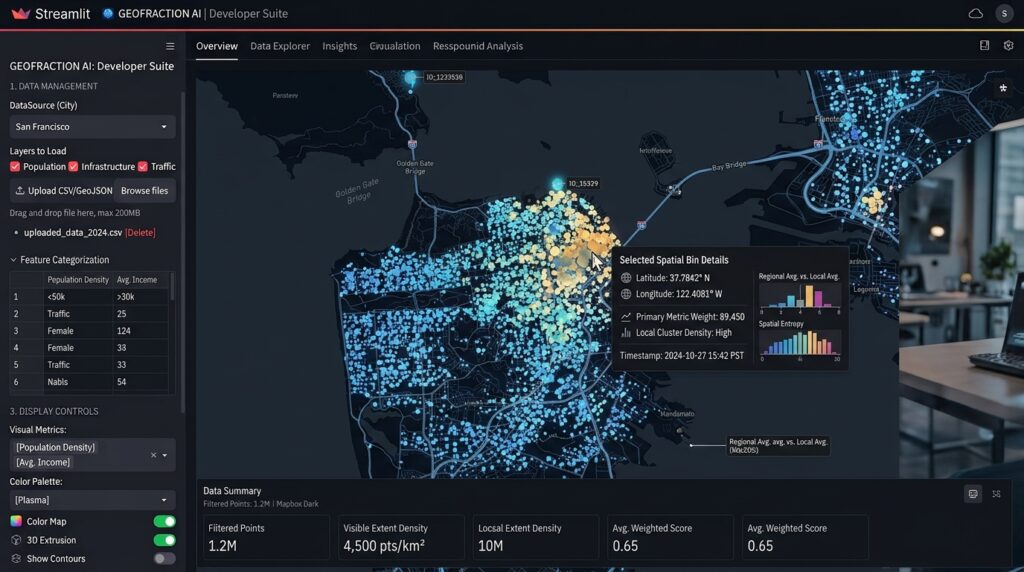
st.pydeck_chart.Python
# Render the deck.gl map inside Streamlit
r = pdk.Deck(
    layers=layers,
    initial_view_state=view_state,
    tooltip={
        "html": "<b>Latitude:</b> {lat} <br/><b>Longitude:</b> {lng} <br/><b>Weight:</b> {elevationValue}",
        "style": {"background": "#111111", "color": "#ffffff", "font-family": "sans-serif"}
    }
)

st.pydeck_chart(r, use_container_width=True)

# Display tabular data breakdown below the map
with st.expander("Inspect Raw Spatial Data Table"):
    st.dataframe(data.head(100), use_container_width=True)
4. Deploying the Spatial Analytics App to Cloud Hosting Platforms
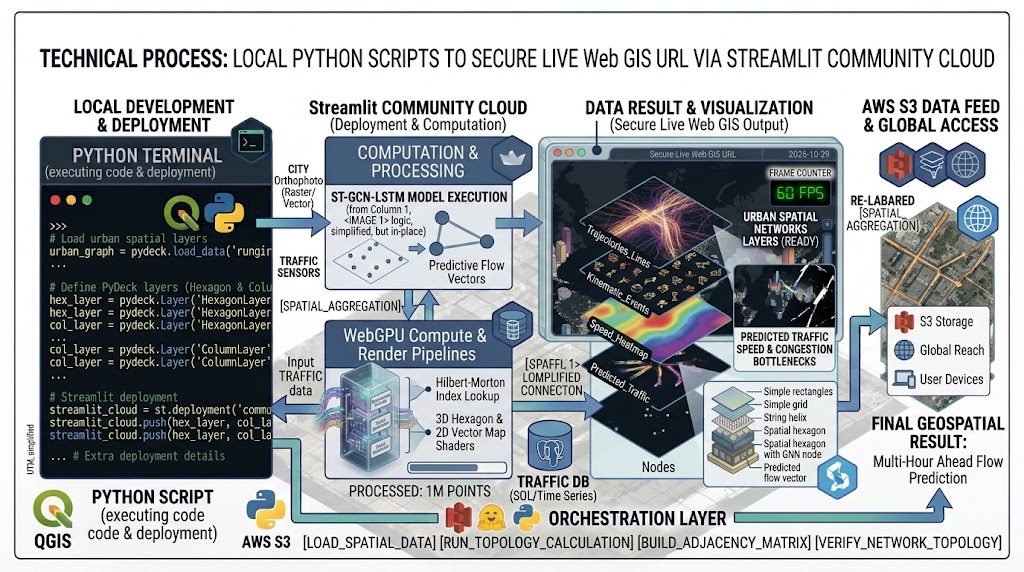
streamlit run app.py), deploying it to public cloud infrastructure takes minutes:-
Prepare Requirements File: Generate your exact dependencies list using pip:
Bash
pip freeze > requirements.txt -
Push to GitHub: Commit your
app.pyandrequirements.txtto a public GitHub repository. -
Streamlit Community Cloud Deployment:
-
Navigate to share.streamlit.io.
-
Connect your GitHub account and select your repository, branch, and main entry file (
app.py). -
Click Deploy. Streamlit Cloud automatically provisions a container, installs dependencies, and publishes your live Web GIS application with a secure HTTPS URL.
-