
Integrating Deck.gl Spatial Layers into Next.js Server-Side Rendered Applications
Introduction
Implementing deck.gl Next.js spatial layers enables developers to render millions of data points and complex movement flows with GPU acceleration inside modern server-side rendered applications. Modern web GIS applications increasingly need to visualize datasets containing millions of points, complex movement trajectories, and aggregated spatial patterns. Rendering these features efficiently requires more than conventional HTML elements or a large collection of client-side markers. GPU-accelerated visualization libraries can transfer much of the rendering workload to the graphics processor, making interactive exploration of dense spatial datasets practical.
deck.gl is an open-source visualization framework designed for large geospatial datasets. Its layer architecture supports points, arcs, polygons, grids, and other visual representations through WebGL2 and WebGPU-based rendering capabilities. It also provides interaction features such as picking, highlighting, and viewport control.
Next.js introduces a different architectural concern: server-side rendering (SSR). Its App Router can render page content on the server, stream responses, and fetch data before sending the page to the browser. However, deck.gl needs a browser rendering environment to create its graphics context and display interactive spatial layers.
The challenge is therefore to preserve Next.js’s server-rendered application architecture while isolating the visualization components that require browser APIs. The most effective design is to keep page structure, metadata, and suitable data preparation on the server, while loading deck.gl into a dedicated client-only React component.
This tutorial builds that architecture using Next.js App Router, TypeScript, React, and three deck.gl layers: ScatterplotLayer, ArcLayer, and HexagonLayer. It also demonstrates reactive viewport management and techniques for handling large datasets without unnecessarily transferring millions of JavaScript objects.
1. Create a Next.js project and install deck.gl
Start by creating a TypeScript project with the App Router.
npx create-next-app@latest spatial-dashboard \
  --typescript --app --src-dir

cd spatial-dashboard

npm install @deck.gl/core @deck.gl/react \
  @deck.gl/layers @deck.gl/aggregation-layers
These packages separate core visualization functionality, React integration, standard layers, and aggregation layers. Install compatible package versions together and retain the lockfile to reproduce builds consistently.
Use the following project structure:
spatial-dashboard/
├── src/
│   └── app/
│       ├── components/
│       │   ├── DeckMapLoader.tsx
│       │   └── DeckMap.tsx
│       ├── globals.css
│       ├── layout.tsx
│       └── page.tsx
├── package.json
└── tsconfig.json
The essential architectural rule is to distinguish server and client components.
A Next.js Server Component is appropriate for page metadata, data retrieval, and content that does not require browser interaction. A Client Component is necessary for React state, event handlers, and browser-dependent APIs. Client Components can still be prerendered by Next.js, so adding 'use client' alone does not guarantee that every imported dependency is excluded from server rendering.
For deck.gl integrations, a separate dynamic-import boundary provides additional protection against SSR errors associated with browser-only rendering dependencies.
2. Isolate WebGL modules from server rendering
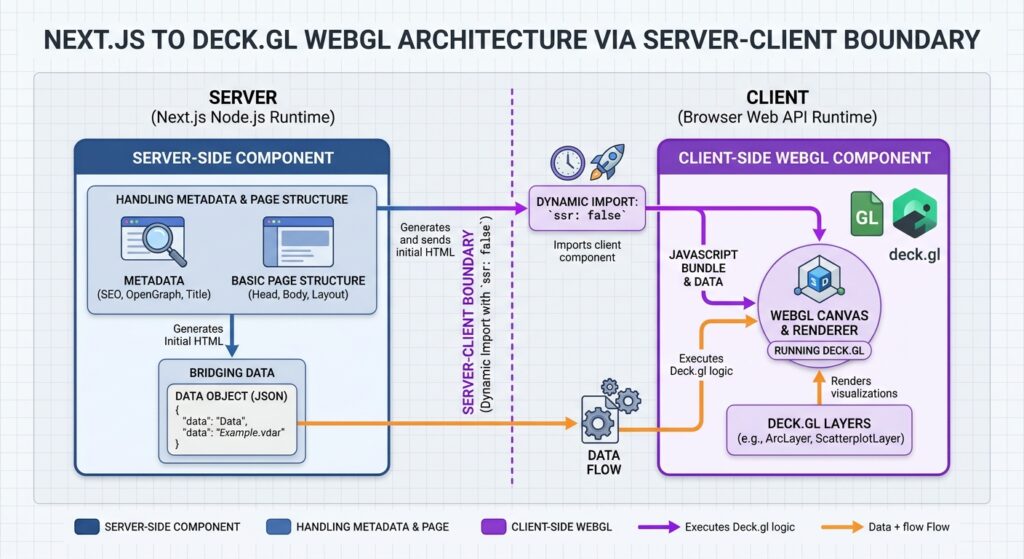
Common errors include window is not defined, document is not defined, and failures involving dependencies that expect browser APIs during module initialization.
The solution is to place the dynamic import in a Client Component and set ssr: false. Next.js does not permit using this option directly inside a Server Component.
Create src/app/components/DeckMapLoader.tsx:
'use client';

import dynamic from 'next/dynamic';

const DeckMap = dynamic(
  () => import('./DeckMap'),
  {
    ssr: false,
    loading: () => (
      <div className="map-loading" role="status">
        Loading spatial visualization...
      </div>
    ),
  }
);

export default function DeckMapLoader() {
  return <DeckMap />;
}
The wrapper is a Client Component, and deck.gl is loaded only on the browser side. The loading element reserves space and communicates progress to users while the visualization bundle loads.
Next, create src/app/page.tsx as a Server Component:
import DeckMapLoader from './components/DeckMapLoader';

export const metadata = {
  title: 'GPU-Accelerated Spatial Dashboard',
  description:
    'Explore spatial data using Next.js and deck.gl.',
};

export default function HomePage() {
  return (
    <main className="page">
      <header className="page-header">
        <h1>Spatial Flow Explorer</h1>
        <p>
          Explore geographic observations and regional
          movement patterns.
        </p>
      </header>

      <DeckMapLoader />
    </main>
  );
}
Notice that the page does not import deck.gl directly. This keeps the SSR boundary explicit, while page metadata and introductory content remain available independently of WebGL initialization.
Why not disable SSR for the entire page? Doing so would unnecessarily remove server-rendering benefits from ordinary text and page structure. Restricting the client-only boundary to the visualization preserves a more useful balance between server rendering and client-side GPU rendering.
3. Implement the deck.gl spatial visualization
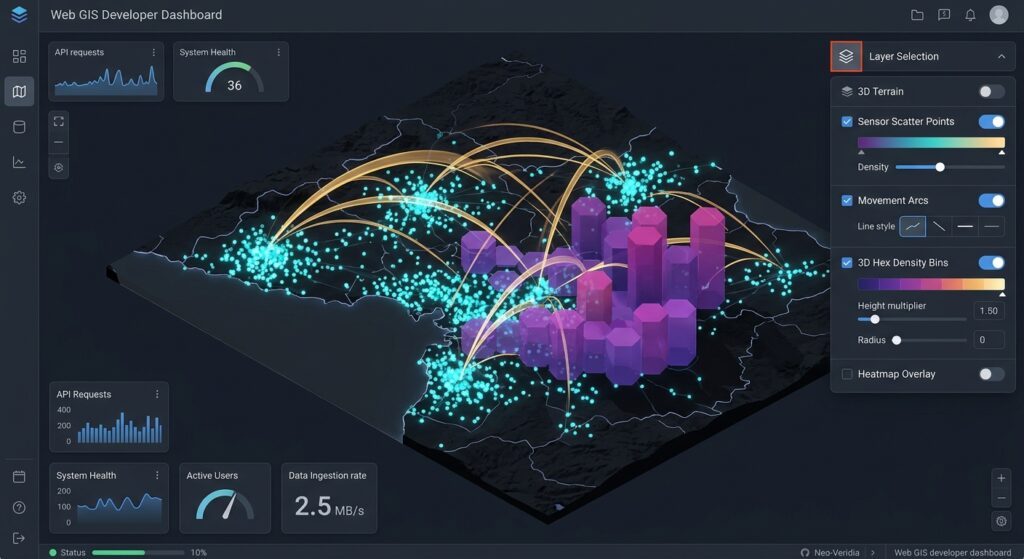
The next component renders three alternative spatial views. A small sample dataset makes the implementation easy to understand; in production, substitute a validated API response, vectorized data, or a server-generated dataset.
Create src/app/components/DeckMap.tsx:
'use client';

import { useMemo, useState } from 'react';
import DeckGL from '@deck.gl/react';
import type { MapViewState } from '@deck.gl/core';
import { ScatterplotLayer, ArcLayer } from '@deck.gl/layers';
import { HexagonLayer } from '@deck.gl/aggregation-layers';

type PointFeature = {
  name: string;
  position: [number, number];
  weight: number;
};

type FlowFeature = {
  sourcePosition: [number, number];
  targetPosition: [number, number];
  volume: number;
};

const points: PointFeature[] = [
  {
    name: 'Nairobi',
    position: [36.8219, -1.2921],
    weight: 80,
  },
  {
    name: 'Thika',
    position: [37.0693, -1.0333],
    weight: 25,
  },
  {
    name: 'Naivasha',
    position: [36.4359, -0.7172],
    weight: 35,
  },
  {
    name: 'Kisumu',
    position: [34.7617, -0.0917],
    weight: 50,
  },
  {
    name: 'Mombasa',
    position: [39.6682, -4.0435],
    weight: 65,
  },
];

const flows: FlowFeature[] = [
  {
    sourcePosition: [36.8219, -1.2921],
    targetPosition: [39.6682, -4.0435],
    volume: 900,
  },
  {
    sourcePosition: [36.8219, -1.2921],
    targetPosition: [34.7617, -0.0917],
    volume: 650,
  },
  {
    sourcePosition: [36.8219, -1.2921],
    targetPosition: [37.0693, -1.0333],
    volume: 400,
  },
];

type LayerMode = 'points' | 'flows' | 'hexagons';

export default function DeckMap() {
  const [mode, setMode] = useState<LayerMode>('points');
  const [selected, setSelected] = useState<string | null>(null);
  const [viewState, setViewState] = useState<MapViewState>({
    longitude: 36.8,
    latitude: -1.3,
    zoom: 5.5,
    pitch: 35,
    bearing: 0,
  });

  const layers = useMemo(() => {
    if (mode === 'points') {
      return [
        new ScatterplotLayer<PointFeature>({
          id: 'locations',
          data: points,
          pickable: true,
          radiusMinPixels: 5,
          radiusMaxPixels: 20,
          getPosition: (d) => d.position,
          getRadius: (d) => d.weight * 100,
          getFillColor: [20, 145, 190, 190],
          onClick: (info) => {
            setSelected(info.object?.name ?? null);
          },
        }),
      ];
    }

    if (mode === 'flows') {
      return [
        new ArcLayer<FlowFeature>({
          id: 'movement-flows',
          data: flows,
          pickable: true,
          getSourcePosition: (d) => d.sourcePosition,
          getTargetPosition: (d) => d.targetPosition,
          getSourceColor: [36, 155, 110],
          getTargetColor: [240, 125, 65],
          getWidth: (d) => Math.max(2, d.volume / 200),
          getHeight: 0.35,
          onClick: (info) => {
            setSelected(
              info.object
                ? `Flow volume: ${info.object.volume}`
                : null
            );
          },
        }),
      ];
    }

    return [
      new HexagonLayer<PointFeature>({
        id: 'density-hexagons',
        data: points,
        pickable: true,
        gpuAggregation: true,
        radius: 15000,
        extruded: true,
        elevationScale: 20,
        getPosition: (d) => d.position,
        getColorWeight: 1,
        colorAggregation: 'COUNT',
        getElevationWeight: 1,
        elevationAggregation: 'COUNT',
      }),
    ];
  }, [mode]);

  return (
    <section className="visualization">
      <div className="map-toolbar" aria-label="Map layer selection">
        <button onClick={() => setMode('points')}>
          Points
        </button>
        <button onClick={() => setMode('flows')}>
          Flows
        </button>
        <button onClick={() => setMode('hexagons')}>
          Hexagons
        </button>
      </div>

      {selected && (
        <p className="selection" aria-live="polite">
          Selected: {selected}
        </p>
      )}

      <div className="map-canvas">
        <DeckGL
          viewState={viewState}
          onViewStateChange={({ viewState }) =>
            setViewState(viewState as MapViewState)
          }
          controller
          layers={layers}
          useDevicePixels={1}
        />
      </div>
    </section>
  );
}
The coordinates use the [longitude, latitude] convention expected by these layers. The example deliberately uses three different representations of the same general geographic region.
Understanding the three layers
ScatterplotLayer converts geographic observations into circles whose positions, sizes, and colors can be driven by data properties. It is appropriate for facilities, sensors, incidents, and other point datasets.
ArcLayer draws connections between source and destination positions. It is useful for mobility analysis, transport flows, logistics, migration, and network movements. Width, color, and height can communicate attributes such as trip volume or flow direction.
HexagonLayer groups points into hexagonal bins. The example uses GPU aggregation and count-based color and elevation weights, making the result useful for a three-dimensional density overview. The aggregation layer supports both CPU and GPU aggregation, with GPU aggregation available in compatible environments.
The selected layer is switched through React state. useMemo avoids recreating the layer definitions on unrelated renders, while deck.gl itself compares new layer instances with previous instances to determine which GPU resources need updating.
For a larger application, move the datasets and layer-building functions into separate modules. This makes it easier to test data validation, implement additional layer types, and reuse styles across pages.
4. Synchronize React state and the map viewport
A spatial dashboard generally needs two kinds of state.
Interface state includes selected features, active layer types, filters, date ranges, and visible legends.
Viewport state includes longitude, latitude, zoom, pitch, and bearing.
The example uses a controlled viewState and updates it via onViewStateChange. This allows the application to synchronize map navigation with other components, such as a URL query string, an information panel, or a chart.
Deck.gl also supports the simpler initialViewState pattern, in which it maintains the camera state internally. Use that approach when the rest of the application does not need to control viewport changes.
For a production application, avoid forcing every transient viewport change into a server request. Panning and zooming can generate many events. Instead, use a debounced callback when a settled viewport must trigger an API query, and cancel outdated requests when the user moves again.
A data request should be based on a defined spatial extent, zoom range, filter set, and dataset version. If viewport state is serialized into the URL, throttle updates so browser history and React rendering do not become unnecessarily busy.
For external controls, change state through explicit user events. For example, changing a date filter should trigger the relevant dataset request, while adjusting the camera should not refetch the same data unless the data endpoint is intentionally viewport-dependent.
5. Optimize large spatial datasets with binary representations
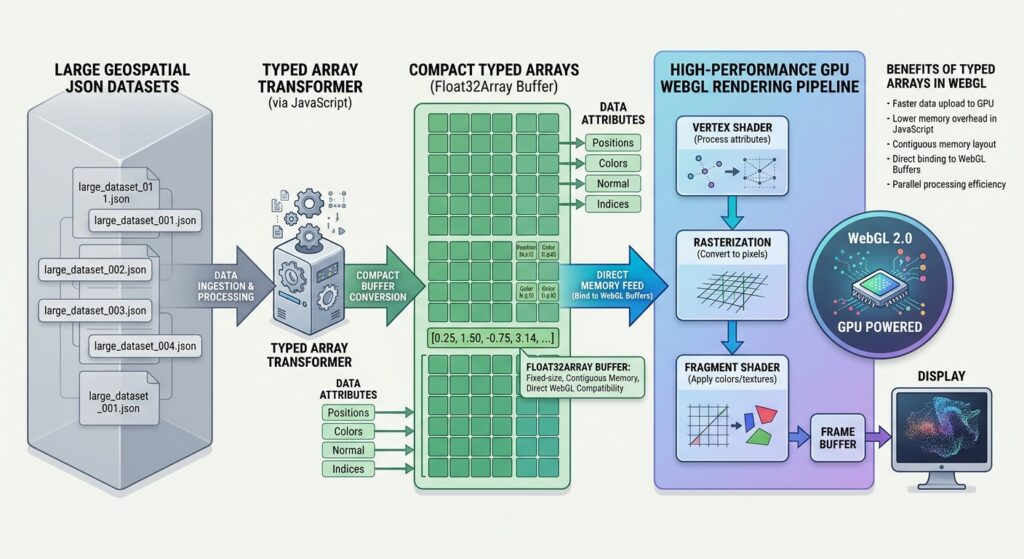
GPU rendering does not make every stage of a geospatial workflow instantaneous. Before features reach the GPU, conventional JavaScript objects may require network transfer, JSON parsing, memory allocation, accessor evaluation, and attribute generation.
These CPU-side operations can become bottlenecks even when the GPU has sufficient rendering capacity. Deck.gl’s performance documentation recommends minimizing unnecessary data changes, using binary data where appropriate, and supplying precomputed attributes for demanding workloads.
Avoid huge JSON payloads
A conventional response might contain millions of objects:
[
  {
    "longitude": 36.8219,
    "latitude": -1.2921,
    "weight": 80
  }
]
For large analytical datasets, repeated field names and individual object allocations add overhead. Alternatives include Apache Arrow, Protocol Buffers, or an application-specific binary format.
A useful server-to-client design is:
- Filter records on the server or in the spatial database.
- Return only the attributes needed for visualization.
- Encode coordinates and numerical attributes into compact columns or typed arrays.
- Decode the payload into typed arrays in the browser, or use an appropriate Arrow integration.
- pass the resulting data to deck.gl using an appropriate binary-data structure.
Binary transport and deck.gl’s binary layer interface are related but distinct: a compact HTTP payload does not automatically become a GPU-ready buffer. The application must decode and organize the attributes correctly.
Use typed arrays to reduce object overhead
For a ScatterplotLayer, a packed position array contains longitude–latitude pairs:
const positionBuffer = new Float32Array([
  36.8219, -1.2921,
  37.0693, -1.0333,
  34.7617, -0.0917,
]);

const binaryData = {
  src: positionBuffer,
  length: positionBuffer.length / 2,
};

const layer = new ScatterplotLayer({
  id: 'binary-points',
  data: binaryData,

  getPosition: (_object, { index, data }) =>
    data.src.subarray(index * 2, index * 2 + 2),

  getRadius: 100,
  radiusMinPixels: 2,
});
Here, each feature occupies two consecutive floating-point values. The custom data object supplies a feature count, while the accessor locates the correct coordinate pair by index. This pattern follows the binary-data approach described in deck.gl’s performance guide.
For larger workloads, measure the precision implications of using 32-bit floating-point coordinates, particularly with projected coordinates or calculations requiring high precision. Geographic coordinates may be appropriate for display, while authoritative calculations should usually remain in the server-side spatial workflow.
For frequently updated telemetry or animation, consider precomputing layer attributes or transferring typed arrays from a Web Worker. Moving decoding or transformation work off the main thread helps keep interface interactions responsive.
Reduce rendering costs as well as transfer costs
For millions of records, apply spatial filtering and aggregation before the browser receives the data. Consider zoom-dependent aggregation, tiling, sampling, and feature-level generalization. A national-scale map does not need to transfer every individual observation when a density surface can communicate the relevant pattern.
Disable picking on layers that do not require interaction. For high-density point layers, picking can add work because deck.gl performs a separate offscreen rendering pass to identify selected features.
The useDevicePixels={1} property in the example limits rendering to the device-pixel ratio specified, rather than automatically rendering at a potentially higher native device-pixel ratio. This can reduce fill-rate costs on high-density screens, though the visual effect should be checked on target devices.
Finally, benchmark the complete application rather than just frame rate. Track payload size, decode time, GPU initialization, memory usage, layer update time, picking latency, and user-perceived responsiveness.
6. Style and deploy the visualization
Create src/app/globals.css with the following styles:
* {
  box-sizing: border-box;
}

html,
body {
  margin: 0;
  min-height: 100%;
  font-family: system-ui, sans-serif;
}

.page {
  padding: 24px;
}

.page-header {
  margin-bottom: 18px;
}

.map-canvas {
  height: 70vh;
  min-height: 420px;
  position: relative;
  overflow: hidden;
  background: #e8eef2;
  border-radius: 10px;
}

.visualization {
  position: relative;
}

.map-toolbar {
  display: flex;
  gap: 8px;
  margin-bottom: 12px;
  flex-wrap: wrap;
}

.map-toolbar button {
  padding: 8px 14px;
  border: 1px solid #cbd5e1;
  border-radius: 6px;
  background: #fff;
  cursor: pointer;
}

.selection {
  margin: 10px 0;
}

.map-loading {
  display: grid;
  place-items: center;
  min-height: 420px;
  background: #e8eef2;
  border-radius: 10px;
}
Import the global stylesheet from the root layout, src/app/layout.tsx, as appropriate for your Next.js setup. The map container needs a defined height so the canvas can occupy a visible area.
Before deployment, run a production build:
npm run build
npm run start
Test the application in a browser and verify that the map initializes, the controls switch layers, the viewport remains interactive, and the browser console does not contain WebGL or hydration errors.
For production data, keep credentials and database access on the server. Expose an API that returns validated, bounded result sets rather than connecting the browser directly to a protected PostGIS database. If requests depend on a viewport or filter, validate the input, limit the requested extent, and implement appropriate caching and cancellation behavior.
Image placeholder
[Image 1: Next.js web application rendering millions of 3D arcs using Deck.gl WebGL layers]
Alt text: “Next.js web application interface rendering millions of high-performance GPU-accelerated 3D arcs and points via deck.gl.”
The illustration should show a dashboard layout with a dense regional or global flow visualization, clearly visible 3D arcs, point features, and layer-selection controls. The millions-of-features scale describes the intended production use case, not the small sample dataset in the implementation above.
SEO best practices and internal linking
Use the primary keyword naturally in the title, introduction, and one relevant subheading. Support it with variations such as “GPU-accelerated geospatial visualization,” “Next.js interactive spatial dashboard,” and “high-performance React web GIS.” Avoid repeating the exact keyword excessively.
Include relevant links to related technical tutorials:
Replace the sample paths with the actual published URLs. The first article can explore camera synchronization, basemap integration, and 3D scene composition, while the second can explain alternative techniques for building reusable interactive web mapping interfaces.
Summary
Integrating deck.gl into a Next.js App Router project requires a clear boundary between server-rendered page content and client-side GPU visualization. A dedicated dynamic-import wrapper keeps browser-dependent code out of the server-rendered component tree without sacrificing SSR benefits for the rest of the page.
ScatterplotLayer, ArcLayer, and HexagonLayer provide complementary ways to represent point observations, movement flows, and spatial density. React state connects those visualizations to dashboard controls, while viewport management coordinates navigation with external filters and analytical components.
For large datasets, the most important performance decisions happen before rendering: limit payloads, use compact binary representations where appropriate, avoid unnecessary data updates, control picking costs, and aggregate spatial data at suitable scales. With those principles in place, Next.js and deck.gl form a flexible foundation for interactive, GPU-accelerated web GIS applications.
Technical references: deck.gl documentation, Using deck.gl with React and SSR, Next.js Server and Client Components, deck.gl performance optimization, and HexagonLayer API.