
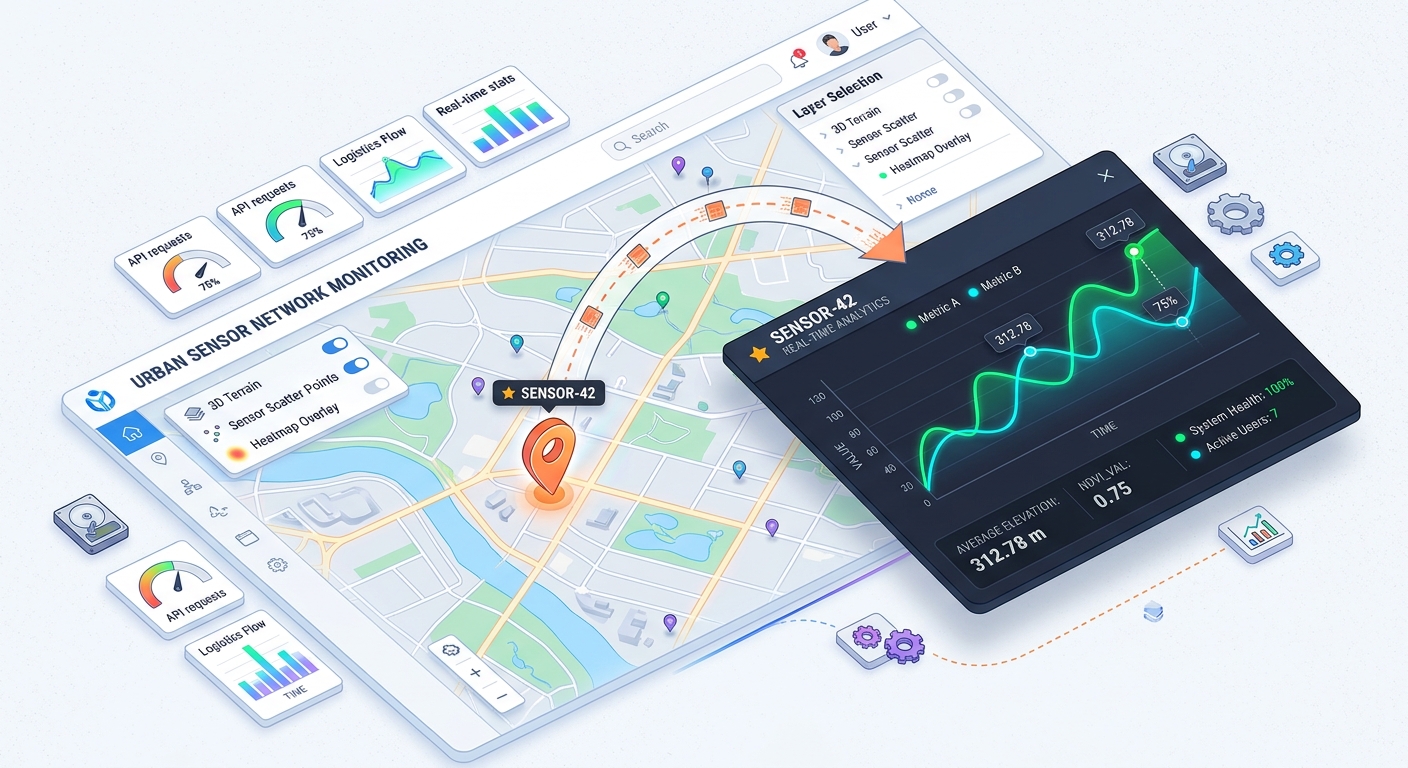
Building Web GIS Feature Popups with Chart.js Integration for Dynamic Attribute Visualization
Welcome to the world of interactive web mapping! If you have ever built a web map, you know how useful traditional feature popups are for displaying static attributes like text or numbers when a user clicks on a map marker. But what if you want to show historical trends, demographic breakdowns, or multi-year environmental data right inside that popup?
By building web GIS feature popups integrated with JavaScript charting libraries, you can transform a standard point-and-click map into an immersive, data-driven analytical tool. In this beginner-friendly tutorial, we will walk step-by-step through how to combine Leaflet.js map click events with Chart.js to render dynamic, interactive charts directly inside map popups.
Why Focus on Building Web GIS feature popups with Chart.js?
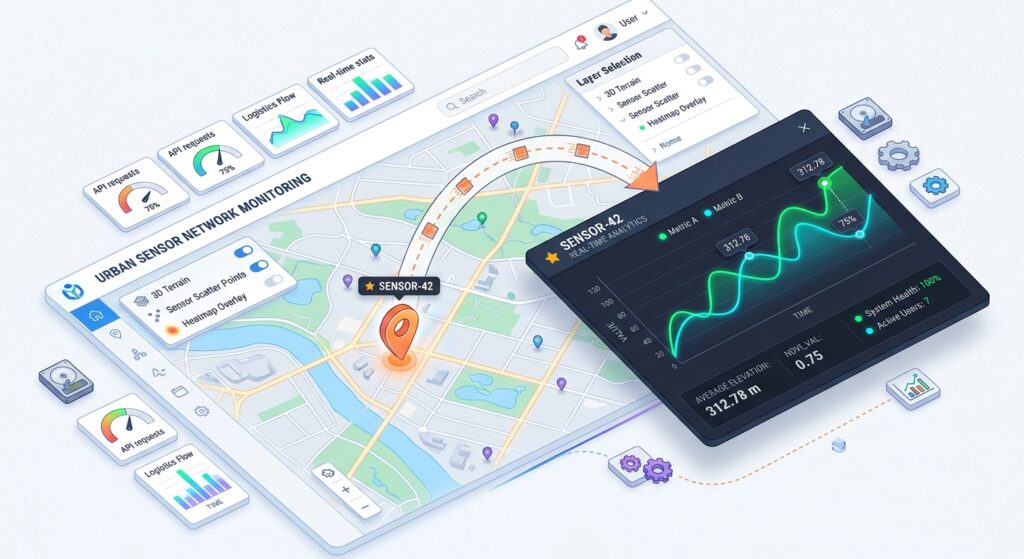
Traditional web maps often suffer from “data isolation”—users can see where something is located, but understanding what is happening there over time requires opening external reports or spreadsheets.
By embedding charts inside your popups:
-
Context is Immediate: Users can visualize trends (like monthly temperature changes or traffic counts) instantly for the specific geographic feature they select.
-
Interactivity Increases Engagement: Portfolio projects and university GIS labs stand out when users can interact with dynamic DOM elements instead of reading plain text tables.
-
Lightweight Architecture: You don’t need a heavy enterprise GIS server just to render simple client-side data visualizations.
Step 1: Setting Up Your HTML and Dependencies
To get started, create a standard HTML file. We need to load three core dependencies via CDN: Leaflet.js for our interactive map, Chart.js for rendering our dynamic graphs, and their respective stylesheets.
HTML
<!DOCTYPE html>
<html lang="en">
<head>
    <meta charset="UTF-8">
    <title>Web GIS Feature Popups with Chart.js</title>
    <!-- Leaflet CSS -->
    <link rel="stylesheet" href="https://unpkg.com/leaflet@1.9.4/dist/leaflet.css" />
    <!-- Chart.js CDN -->
    <script src="https://cdn.jsdelivr.net/npm/chart.js"></script>
    <style>#map { width: 100%; height: 500px; }
        .popup-chart-container { width: 280px; height: 180px; }
    </style>
</head>
<body>

    <h2>Interactive Feature Popups with Dynamic Charts</h2>
    <div id="map"></div>

    <!-- Leaflet JS -->
    <script src="https://unpkg.com/leaflet@1.9.4/dist/leaflet.js"></script>
    <script>// Our mapping code will go here!</script>
</body>
</html>
Resource Link: To learn more about setting up base maps and managing vector layers, check out the official Leaflet.js Documentation.
Step 2: Initializing the Map and Adding Sample Data
Next, let’s initialize our Leaflet map centered over a sample study area and add a point feature with historical attribute arrays stored inside its properties.
JavaScript
// 1. Initialize the map centered on a city
const map = L.map('map').setView([37.7749, -122.4194], 13);
// 2. Add a clean CartoDB Positron base tile layer
L.tileLayer('https://{s}.basemaps.cartocdn.com/light_all/{z}/{x}/{y}{z}.png', {
maxZoom: 19,
attribution: '© <a href="https://carto.com/">CARTO</a>'
}).addTo(map);
// 3. Create a sample GeoJSON feature with time-series attribute data
const sampleFeature = {
type: "Feature",
properties: {
stationName: "Air Quality Station #402",
months: ["Jan", "Feb", "Mar", "Apr", "May", "Jun"],
pm25Levels: [18, 24, 15, 30, 22, 12]
},
geometry: {
type: "Point",
coordinates: [-122.4194, 37.7749]
}
};
When you begin Building Web GIS feature popups with Chart.js, structuring your GeoJSON properties with clean attribute arrays ensures seamless data binding later.
Step 3: Injecting Dynamic Canvas Elements into Leaflet Popups
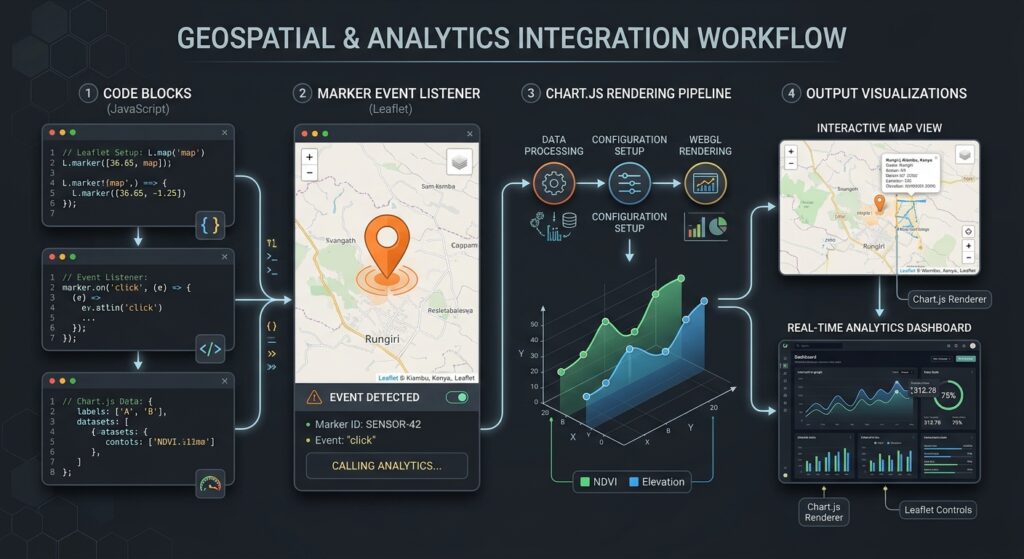
When a user clicks a marker, Leaflet opens a popup container in the DOM. Because Chart.js requires an HTML
<canvas> element to draw its graphics, we must dynamically inject that canvas into the popup content after the popup opens.We accomplish this using Leaflet’s built-in
popupopen event listener.JavaScript
// Add the GeoJSON point to the map
const markerLayer = L.geoJSON(sampleFeature, {
    onEachFeature: function (feature, layer) {
        // Construct the HTML structure with a unique canvas ID
        const popupContent = `
            <div>
                <h4>${feature.properties.stationName}</h4>
                <p>6-Month PM2.5 Concentration Trends</p>
                <div class="popup-chart-container">
                    <canvas id="popupChart"></canvas>
                </div>
            </div>
        `;
        layer.bindPopup(popupContent);
    }
}).addTo(map);
Step 4: Initializing Chart.js Inside the Popup DOM
Now, let’s listen for the popup open event, grab our canvas context, and render a Chart.js line graph using the feature’s property arrays.
JavaScript
markerLayer.on('click', function(e) {
    // Small timeout ensures the popup DOM node is fully rendered in the document
    setTimeout(() => {
        const canvasElement = document.getElementById('popupChart');
        if (!canvasElement) return;

        const props = e.layer.feature.properties;

        // Initialize the Chart.js instance
        new Chart(canvasElement, {
            type: 'line',
            data: {
                labels: props.months,
                datasets: [{
                    label: 'PM2.5 ($\mu g/m^3$)',
                    data: props.pm25Levels,
                    borderColor: '#2A9D8F',
                    backgroundColor: 'rgba(42, 157, 143, 0.2)',
                    borderWidth: 2,
                    fill: true,
                    tension: 0.3
                }]
            },
            options: {
                responsive: true,
                maintainAspectRatio: false,
                plugins: {
                    legend: { display: false }
                }
            }
        });
    }, 200);
});
Resource Link: For advanced chart customization options, animations, and dataset configurations, explore the official Chart.js Documentation.When mastering Building Web GIS feature popups with Chart.js, proper timing with the setTimeout function ensures the canvas element is fully available in the DOM before the chart renders.
Visualizing the Output
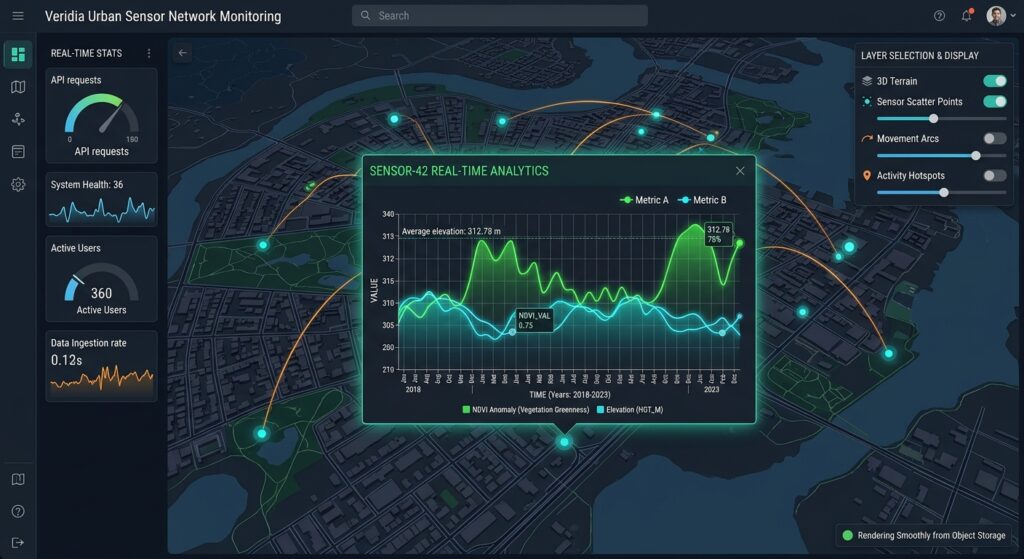
When you open your HTML file in a web browser and click the map marker, your popup will render cleanly with an embedded, interactive chart.
Conclusion & Next Steps
By building web GIS feature popups backed by Chart.js, you bridge the gap between static cartography and dynamic data exploration. You can easily scale this pattern by fetching remote GeoJSON APIs or connecting PostGIS database query endpoints to supply your attribute arrays!The workflows covered in Building Web GIS feature popups with Chart.js provide a robust foundation for building interactive spatial analytics dashboards.