
Web-Based Vector Editing with Mapbox GL Draw
1. Introduction
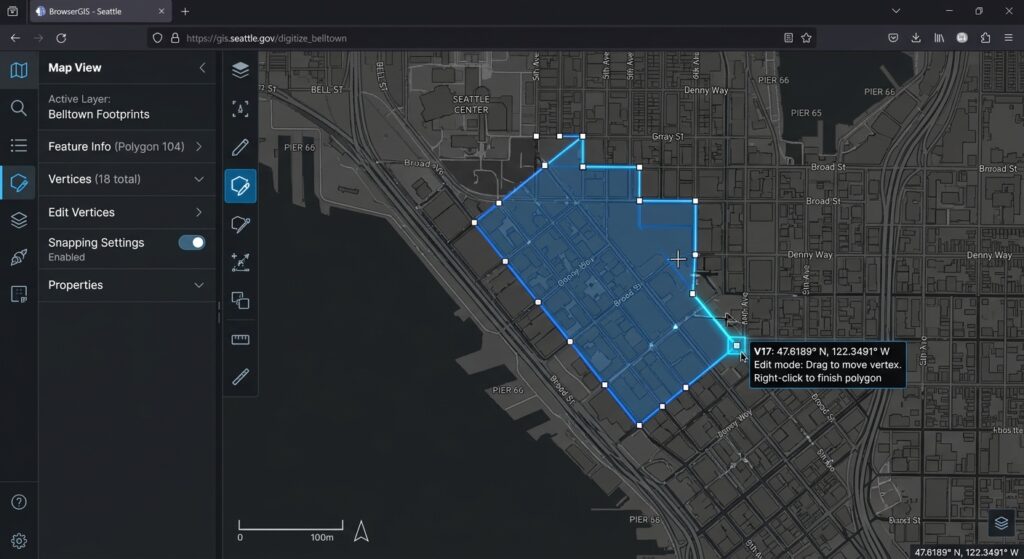
When building **Web Based Vector Editing Mapbox GL Draw** workflows, traditional desktop GIS software often creates friction for web users. Traditional vector digitizing workflows rely heavily on desktop GIS software such as QGIS and ArcGIS. These tools remain valuable for advanced editing and quality assurance, but they can create friction when spatial data needs to be collected, reviewed, or updated by users working through a web application.
A browser-based vector editing tool allows users to create points, draw lines, digitize polygon boundaries, and modify existing geometries without installing desktop GIS software. This approach is useful for community mapping, land parcel data collection, utility asset inventories, field surveys, and collaborative infrastructure management.
Mapbox GL JS provides the interactive web mapping engine, while Mapbox GL Draw adds client-side tools for creating and editing GeoJSON features. The Draw plugin supports common geometry types, selection, vertex manipulation, deletion, and events that notify an application when features change. Its API also supports custom styles and interaction modes. See the official Mapbox GL Draw repository and API documentation.
This tutorial builds an interactive map where users can digitize geographic features, inspect the resulting GeoJSON, validate geometries, and synchronize edits with a backend API connected to PostGIS.
The architecture separates four responsibilities:
- Mapbox GL JS: renders the basemap and manages map navigation.
- Mapbox GL Draw: manages feature creation, selection, and geometry editing.
- GeoJSON and Turf.js: represent features and perform client-side geometry validation.
- Backend API and PostGIS: authenticate users, validate incoming data, and persist spatial records.
2. Setting Up the Environment and Dependencies
We will use Vite and plain JavaScript to keep the implementation focused on the mapping workflow.
2.1 Create the application
Install a current Node.js LTS release, then run:
npm create vite@latest web-vector-editor -- --template vanilla
cd web-vector-editor

npm install
npm install mapbox-gl @mapbox/mapbox-gl-draw @turf/boolean-valid
npm run dev
Mapbox GL JS requires a public access token to request Mapbox services. Create one in your Mapbox account. The official npm setup guide describes the required JavaScript and stylesheet imports.
2.2 Configure the access token
Create a .env.local file in the project root:
VITE_MAPBOX_ACCESS_TOKEN=pk.your_public_token_hereVite exposes variables prefixed with VITE_ to browser code. Use a public token intended for web mapping, apply appropriate URL restrictions, and do not place private account credentials in the frontend.
2.3 Create the HTML interface
Replace the generated index.html with:
<!doctype html>
<html lang="en">
  <head>
    <meta charset="UTF-8" />
    <meta name="viewport" content="width=device-width, initial-scale=1.0" />
    <title>Web-Based Vector Editor</title>
  </head>

  <body>
    <main class="app">
      <header class="toolbar-header">
        <div>
          <h1>Spatial Feature Editor</h1>
          <p>Create and edit geographic features directly on the map.</p>
        </div>
      </header>

      <section class="editor-layout">
        <div id="map" aria-label="Interactive vector editing map"></div>

        <aside class="sidebar">
          <h2>Editing tools</h2>

          <div class="custom-tools">
            <button id="select-tool">Select</button>
            <button id="point-tool">Draw point</button>
            <button id="line-tool">Draw line</button>
            <button id="polygon-tool">Draw polygon</button>
            <button id="delete-tool">Delete selected</button>
            <button id="save-tool">Save changes</button>
            <button id="export-tool">Export GeoJSON</button>
          </div>

          <p id="status" role="status">Initializing map...</p>

          <h2>GeoJSON output</h2>
          <pre id="geojson-output">Waiting for map initialization...</pre>
        </aside>
      </section>

      <script type="module" src="/src/main.js"></script>
    </main>
  </body>
</html>
2.4 Add the application styles
Replace src/style.css with:
@import "mapbox-gl/dist/mapbox-gl.css";
@import "@mapbox/mapbox-gl-draw/dist/mapbox-gl-draw.css";

* {
  box-sizing: border-box;
}

body {
  margin: 0;
  font-family: Arial, sans-serif;
  color: #1f2937;
  background: #f3f6fa;
}

.app {
  padding: 20px;
}

.toolbar-header {
  margin-bottom: 16px;
}

.toolbar-header h1 {
  margin: 0;
}

.toolbar-header p {
  color: #64748b;
}

.editor-layout {
  display: grid;
  grid-template-columns: minmax(0, 1fr) 340px;
  gap: 16px;
}

#map {
  height: 76vh;
  min-height: 450px;
  border-radius: 10px;
  overflow: hidden;
}

.sidebar {
  min-width: 0;
  padding: 16px;
  background: white;
  border: 1px solid #dbe3ed;
  border-radius: 10px;
}

.custom-tools {
  display: grid;
  grid-template-columns: 1fr 1fr;
  gap: 8px;
}

.custom-tools button {
  padding: 10px;
  border: 1px solid #cbd5e1;
  border-radius: 6px;
  background: #f8fafc;
  cursor: pointer;
}

.custom-tools button:hover {
  background: #dbeafe;
}

#status {
  min-height: 24px;
  margin: 14px 0;
  font-size: 0.9rem;
}

#geojson-output {
  max-height: 40vh;
  overflow: auto;
  padding: 10px;
  background: #0f172a;
  color: #d1fae5;
  border-radius: 6px;
  font-size: 0.75rem;
  white-space: pre-wrap;
  overflow-wrap: anywhere;
}

@media (max-width: 900px) {
  .editor-layout {
    grid-template-columns: 1fr;
  }

  #map {
    height: 60vh;
    min-height: 350px;
  }
}
The Mapbox GL JS and Mapbox GL Draw stylesheets are both required. The first styles the map and its controls; the second styles the drawing toolbar and editing handles.
3. Step 1: Initialize the Map and Drawing Toolbar
Create src/main.js:
import mapboxgl from "mapbox-gl";
import MapboxDraw from "@mapbox/mapbox-gl-draw";
import booleanValid from "@turf/boolean-valid";

import "./style.css";

// Configure the public token used by Mapbox GL JS.
const token = import.meta.env.VITE_MAPBOX_ACCESS_TOKEN;

if (!token) {
  throw new Error("Missing VITE_MAPBOX_ACCESS_TOKEN.");
}

mapboxgl.accessToken = token;

// Cache references to the interface elements.
const statusElement = document.querySelector("#status");
const outputElement = document.querySelector("#geojson-output");

function setStatus(message) {
  statusElement.textContent = message;
}

// Initialize the interactive map.
// Mapbox coordinates use [longitude, latitude].
const map = new mapboxgl.Map({
  container: "map",
  style: "mapbox://styles/mapbox/streets-v12",
  center: [36.8219, -1.2921],
  zoom: 10,
});

// Navigation controls provide zoom and rotation.
map.addControl(new mapboxgl.NavigationControl(), "top-right");

// Configure the default point, line, polygon and delete tools.
const draw = new MapboxDraw({
  displayControlsDefault: false,

  controls: {
    point: true,
    line_string: true,
    polygon: true,
    trash: true,
  },

  defaultMode: "simple_select",
  userProperties: true,
});

map.addControl(draw, "top-left");
The map is centered on Nairobi for the example; substitute the initial extent of your project. The controls configuration exposes only the selected Draw toolbar actions, making the editor less cluttered than the default full toolbar.
[Image 1 placeholder: Browser map interface showing Mapbox GL Draw toolbar and active polygon editing state]
Alt text: “Web map interface screenshot displaying Mapbox GL Draw toolbar with an active polygon vector editing session and vertex nodes.”
Add external drawing buttons
The standard toolbar is convenient, but an application’s interface may need custom buttons outside the map. Draw exposes changeMode() for switching between interaction modes.
Append the following to src/main.js:
// Switch to selection mode.
document.querySelector("#select-tool").addEventListener("click", () => {
  draw.changeMode("simple_select");
});

// Create a point.
document.querySelector("#point-tool").addEventListener("click", () => {
  draw.changeMode("draw_point");
});

// Digitize a line.
document.querySelector("#line-tool").addEventListener("click", () => {
  draw.changeMode("draw_line_string");
});

// Digitize a polygon.
document.querySelector("#polygon-tool").addEventListener("click", () => {
  draw.changeMode("draw_polygon");
});

// Delete the currently selected features.
document.querySelector("#delete-tool").addEventListener("click", () => {
  draw.trash();
});
In polygon mode, the user clicks successive vertices and finishes the shape with the appropriate final-click interaction. In line mode, the user digitizes a series of coordinates. In point mode, a single map click creates the feature.
4. Step 2: Capture Draw Lifecycle Events
A web editor needs to distinguish geometry creation from later edits and deletion. Mapbox GL Draw emits events for these actions:
draw.create: one or more new features have been created.draw.update: existing features have been changed.draw.delete: selected features have been deleted.
These events let the application respond to changes without polling the map continuously. Mapbox’s official drawing tools example demonstrates registering these listeners and refreshing the application state after editing.
The main method for obtaining the current vector layer is draw.getAll(), which returns a GeoJSON FeatureCollection.
function updateGeoJSONPreview() {
  // Retrieve the current complete set of Draw features.
  const collection = draw.getAll();

  // Render the current collection as formatted JSON.
  outputElement.textContent = JSON.stringify(
    collection,
    null,
    2
  );

  setStatus(
    `${collection.features.length} feature(s) in the editor.`
  );
}

// Refresh whenever the user changes the drawing.
map.on("draw.create", updateGeoJSONPreview);
map.on("draw.update", updateGeoJSONPreview);
map.on("draw.delete", updateGeoJSONPreview);
[Image 2 placeholder: Code snippet output showing GeoJSON feature collection generated from browser canvas drawing]
Alt text: “Code block visualization showing a GeoJSON feature collection output generated dynamically from user browser interactions.”
The important distinction is that the browser canvas is not itself a database. Draw maintains an editable feature store, and getAll() retrieves its current features. The returned GeoJSON can be inspected, downloaded, sent to an API, or processed by client-side spatial libraries.
5. Step 3: Validate Geometry and Export GeoJSON
A geometry can look acceptable at a particular zoom level while still violating requirements for polygon topology or data completeness. Validate edited features before sending them to the server.
Install and import Turf’s boolean-valid function, already included in the project dependencies. It can check supported GeoJSON geometries against common validity requirements. The Turf boolean-valid implementation describes the supported geometry checks.
Add the following function:
function findInvalidFeatures(collection) {
  const invalid = [];

  for (const feature of collection.features) {
    try {
      if (!booleanValid(feature)) {
        invalid.push({
          id: feature.id,
          reason: "Geometry failed client-side validity checks.",
        });
      }
    } catch (error) {
      invalid.push({
        id: feature.id,
        reason: error.message || "Could not validate geometry.",
      });
    }
  }

  return invalid;
}
Update the GeoJSON preview function so invalid geometries are visible:
function updateGeoJSONPreview() {
  const collection = draw.getAll();
  const invalid = findInvalidFeatures(collection);

  outputElement.textContent = JSON.stringify(
    collection,
    null,
    2
  );

  if (invalid.length > 0) {
    setStatus(
      `${invalid.length} invalid feature(s). Correct them before saving.`
    );
  } else {
    setStatus(
      `${collection.features.length} feature(s) ready for review.`
    );
  }
}
This validation is a client-side aid, not a security boundary. The backend must independently validate all incoming geometry because clients can bypass browser checks or send HTTP requests directly.
Export the feature collection
Allow users to download their work as a standard GeoJSON file:
function exportGeoJSON() {
  const collection = draw.getAll();

  const blob = new Blob(
    [JSON.stringify(collection, null, 2)],
    { type: "application/geo+json" }
  );

  const url = URL.createObjectURL(blob);
  const link = document.createElement("a");

  link.href = url;
  link.download = "edited-features.geojson";
  link.click();

  URL.revokeObjectURL(url);
}

document.querySelector("#export-tool").addEventListener(
  "click",
  exportGeoJSON
);
For large datasets, avoid repeatedly rendering the entire feature collection into the preview panel on every edit. Display a compact summary and provide a separate export or inspection action instead.
6. Step 4: Synchronize GeoJSON with a Backend API
Client-side editing becomes more useful when changes can be persisted in a central database. A common architecture is:
- Mapbox GL Draw manages local edits.
- The frontend packages the current data as a GeoJSON
FeatureCollection. - An authenticated HTTP request sends the data to a backend API.
- The server validates the payload, checks permissions, and writes geometries to PostGIS.
For this example, use a snapshot endpoint such as PUT /api/projects/current/features. The endpoint shown here is an application-specific example; it must be implemented in your backend.
Add this function to src/main.js:
async function syncGeoJSONToServer() {
  const collection = draw.getAll();
  const invalid = findInvalidFeatures(collection);

  if (invalid.length > 0) {
    setStatus("Save blocked: correct invalid geometries first.");
    return;
  }

  try {
    setStatus("Saving features...");

    const response = await fetch(
      "/api/projects/current/features",
      {
        method: "PUT",
        credentials: "same-origin",
        headers: {
          "Content-Type": "application/json",
        },
        body: JSON.stringify(collection),
      }
    );

    if (!response.ok) {
      throw new Error(
        `Save failed with HTTP ${response.status}.`
      );
    }

    setStatus("Features saved successfully.");
  } catch (error) {
    console.error("Feature synchronization failed:", error);
    setStatus(`Save failed: ${error.message}`);
  }
}

document.querySelector("#save-tool").addEventListener(
  "click",
  syncGeoJSONToServer
);
This example saves the whole collection when the user clicks Save changes. A production implementation should decide whether to use explicit save, debounced autosave, or individual feature updates. Whole-collection replacement is reasonable for small projects with one active editor, but it is not a safe collaboration strategy by itself: simultaneous users can overwrite one another’s changes.
Saving GeoJSON to PostGIS
A PostGIS table could store each feature’s ID, project ID, attribute JSON, and geometry:
CREATE TABLE edited_features (
    project_id UUID NOT NULL,
    feature_id TEXT NOT NULL,
    properties JSONB NOT NULL DEFAULT '{}'::jsonb,
    geom geometry(Geometry, 4326) NOT NULL,
    updated_at TIMESTAMPTZ NOT NULL DEFAULT now(),

    PRIMARY KEY (project_id, feature_id),

    CHECK (ST_IsValid(geom))
);

CREATE INDEX edited_features_geom_gix
ON edited_features
USING GIST (geom);
GeoJSON coordinates use longitude and latitude in this workflow, so the example stores the geometries in SRID 4326. Select a suitable data model and CRS for the application; transform geometry when the analytical or database requirements differ.
The following simplified Express route illustrates the database write. It assumes PostgreSQL, the pg package, a requireAuth middleware that establishes the user’s identity, and project-level authorization. Those security components must be implemented for the actual application.
import express from "express";
import { Pool } from "pg";

const app = express();
const pool = new Pool({
  connectionString: process.env.DATABASE_URL,
});

app.use(express.json({ limit: "2mb" }));

const allowedGeometryTypes = new Set([
  "Point",
  "MultiPoint",
  "LineString",
  "MultiLineString",
  "Polygon",
  "MultiPolygon",
]);

app.put(
  "/api/projects/:projectId/features",
  requireAuth,
  async (req, res) => {
    const collection = req.body;
    const { projectId } = req.params;

    if (
      collection?.type !== "FeatureCollection" ||
      !Array.isArray(collection.features) ||
      collection.features.length > 5000
    ) {
      return res.status(400).json({
        error: "Invalid or oversized GeoJSON FeatureCollection.",
      });
    }

    // Authorize this user against the specified project here.
    // Do not trust a project ID supplied by the browser alone.

    for (const feature of collection.features) {
      if (
        feature?.type !== "Feature" ||
        !feature.geometry ||
        !allowedGeometryTypes.has(feature.geometry.type)
      ) {
        return res.status(400).json({
          error: "Unsupported or malformed feature.",
        });
      }
    }

    const client = await pool.connect();

    try {
      await client.query("BEGIN");

      // Snapshot-replacement strategy for a small, single-editor project.
      await client.query(
        "DELETE FROM edited_features WHERE project_id = $1::uuid",
        [projectId]
      );

      for (const feature of collection.features) {
        const featureId = String(feature.id);

        if (!featureId || featureId === "undefined") {
          throw new Error("A feature ID is required.");
        }

        await client.query(
          `INSERT INTO edited_features
             (project_id, feature_id, properties, geom, updated_at)
           VALUES
             ($1::uuid, $2, $3::jsonb,
              ST_SetSRID(ST_GeomFromGeoJSON($4), 4326), now())`,
          [
            projectId,
            featureId,
            JSON.stringify(feature.properties ?? {}),
            JSON.stringify(feature.geometry),
          ]
        );
      }

      await client.query("COMMIT");

      return res.json({
        saved: collection.features.length,
      });
    } catch (error) {
      await client.query("ROLLBACK");
      console.error("PostGIS write failed:", error);

      return res.status(500).json({
        error: "Could not save spatial features.",
      });
    } finally {
      client.release();
    }
  }
);
This route is an illustrative starting point, not a complete production API. Add rate limits, CSRF protection where applicable, request-size limits, per-project authorization, coordinate bounds checks, and error handling suited to your deployment. Also check validity server-side and handle empty or duplicate feature IDs.
For collaborative editing, prefer per-feature inserts and updates, explicit delete operations, and revision checks instead of deleting and recreating every row on each save. Use database transactions to prevent partial writes.
7. Step 5: Customize the Draw Theme and Vertex Colors
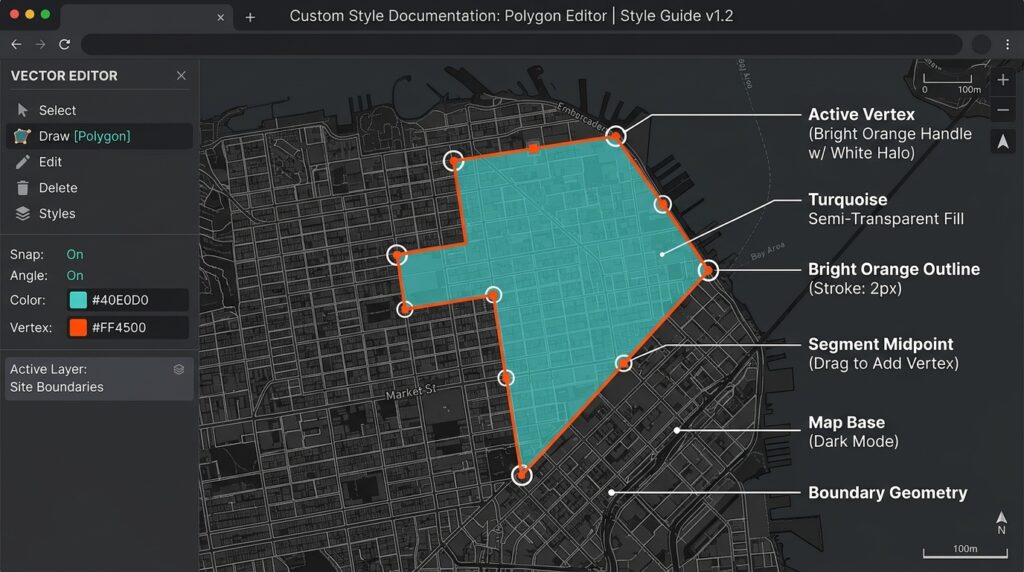
Mapbox GL Draw supports custom style layers through its styles option. The style rules use Draw-specific feature metadata, including meta values such as feature, vertex, and midpoint, along with the active state. When providing custom styles, the supplied array replaces Draw’s default styling, so include rules for every geometry and editing handle the application needs. See the Draw API styling guide.
For example, add a custom theme before constructing the Draw control:
const customDrawStyles = [
  {
    id: "editor-polygon-fill",
    type: "fill",
    filter: [
      "all",
      ["==", "$type", "Polygon"],
      ["==", "meta", "feature"],
    ],
    paint: {
      "fill-color": "#14b8a6",
      "fill-opacity": 0.22,
    },
  },
  {
    id: "editor-polygon-outline",
    type: "line",
    filter: [
      "all",
      ["==", "$type", "Polygon"],
      ["==", "meta", "feature"],
    ],
    paint: {
      "line-color": "#0f766e",
      "line-width": 2,
    },
  },
  {
    id: "editor-line",
    type: "line",
    filter: [
      "all",
      ["==", "$type", "LineString"],
      ["==", "meta", "feature"],
    ],
    paint: {
      "line-color": "#2563eb",
      "line-width": 3,
    },
  },
  {
    id: "editor-vertex-halo",
    type: "circle",
    filter: ["==", "meta", "vertex"],
    paint: {
      "circle-radius": 7,
      "circle-color": "#ffffff",
    },
  },
  {
    id: "editor-vertex",
    type: "circle",
    filter: ["==", "meta", "vertex"],
    paint: {
      "circle-radius": 4,
      "circle-color": "#f97316",
    },
  },
];
Use the theme when creating the Draw instance:
const draw = new MapboxDraw({
  displayControlsDefault: false,
  controls: {
    point: true,
    line_string: true,
    polygon: true,
    trash: true,
  },
  styles: customDrawStyles,
});
This is a concise illustration of color customization. Since a custom array replaces the default style set, a complete editor should also include separate styling rules for point features, active and inactive lines and polygons, and midpoint handles. Test the result with drawing, selecting, and direct vertex editing.
8. Handling Edge Cases and Snapping
Geometry validity
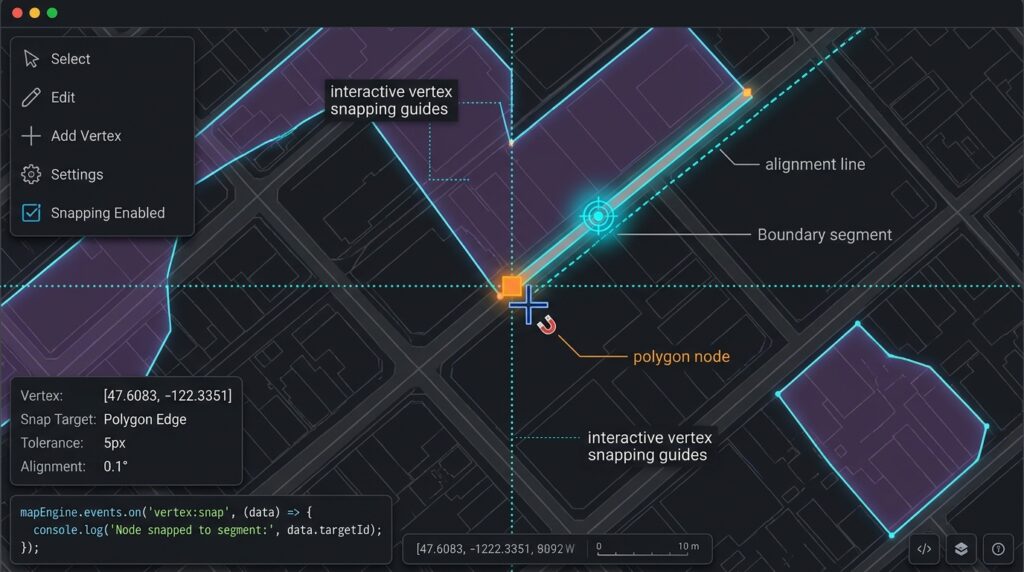
A browser editor should detect self-intersecting polygons, incomplete features, unsupported geometry types, and missing required attributes. Client-side validity checks improve usability, but a backend must still enforce its own validation rules. For authoritative topology checks, PostGIS provides functions such as ST_IsValid and ST_IsValidReason.
Vertex snapping
The standard Draw control does not provide a complete topology-snapping workflow out of the box. A custom mode or snapping plugin can allow users to snap vertices to existing features, segment midpoints, or reference layers.
One third-party option is mapbox-gl-draw-snap-mode. Its documented configuration provides custom point, line, polygon, and direct-selection modes, along with pixel-based snapping tolerance and optional midpoint snapping. Review and test third-party compatibility before adopting it.
For a simple integration, the plugin provides these exports:
import {
  SnapPolygonMode,
  SnapPointMode,
  SnapLineMode,
  SnapModeDrawStyles,
  SnapDirectSelect,
} from "mapbox-gl-draw-snap-mode";

const draw = new MapboxDraw({
  modes: {
    ...MapboxDraw.modes,
    draw_point: SnapPointMode,
    draw_polygon: SnapPolygonMode,
    draw_line_string: SnapLineMode,
    direct_select: SnapDirectSelect,
  },

  styles: SnapModeDrawStyles,
  userProperties: true,

  snap: true,
  snapOptions: {
    snapPx: 15,
    snapToMidPoints: true,
  },

  guides: false,
});
This configuration uses the plugin’s style collection for its snapping guides. If you also want your own drawing theme, combine and test the compatible style layers rather than blindly replacing the plugin’s required styles.
Snapping tolerance is measured in screen pixels, so the geographic distance represented by a given tolerance changes with zoom. Where precise parcel or utility boundaries matter, supplement snapping with backend topology rules and, where necessary, authoritative survey data.
Preventing lost edits
If an API request fails, keep the local Draw features intact and show an actionable message rather than clearing the drawing store. For concurrent editing, track a server revision or version number and reject writes based on outdated revisions.
Also remember that geometry validity does not establish geographic correctness. A polygon can be topologically valid but assigned to the wrong administrative area or overlap a neighboring parcel unintentionally.
9. SEO Best Practices and Internal Linking
For a GIS development site, connect this tutorial to related implementation guides using descriptive anchor text. Suggested internal links include:
- Building custom control widgets with Leaflet
- Client-side spatial analysis with Turf.js
- Publishing PostGIS layers to the web
Replace these example paths with the actual canonical URLs on your website. Use the exact phrase “Mapbox GL Draw” in a relevant heading or explanatory paragraph, and place the main target keyword naturally in the title, introduction, and metadata.
Official references for readers include the Mapbox GL Draw GitHub repository, the Draw API documentation, and the Mapbox GL JS drawing example.
10. Conclusion
Mapbox GL Draw turns Mapbox GL JS into a practical interactive web map editing tool. Users can digitize points, lines, and polygons, edit vertices, delete features, and export their work as GeoJSON without leaving the browser.
A reliable application combines the drawing interface with event-driven state updates, client-side validation, safe API synchronization, and server-side PostGIS constraints. Custom styles and snapping modes can improve digitizing precision, while revision checks and per-feature updates make the architecture more suitable for collaboration.
GitHub code repository: Start with the official Mapbox GL Draw repository for the maintained plugin source and examples. The files in this tutorial can be committed to your own project repository alongside its dependency lockfile and backend implementation.
The key engineering principle is to treat the browser as an editing interface and the backend as the authority for validation, permissions, and persistent spatial data.