
Network Analysis GIS Shortest Path: Routing Algorithms and Service Areas Explained
Whether you are optimizing emergency response routes, modeling public transit accessibility, or planning supply chain logistics, spatial connectivity plays a central role in real-world geography. In computer mapping, analyzing how entities move through interconnected lines is known as network analysis If you are looking to master spatial routing, learning how to perform a network analysis gis shortest path is the most essential skill for mapping complex networks. If you are looking to master spatial routing, learning how to perform a network analysis gis shortest path is the most essential skill for mapping complex networks.
For university students navigating upper-level urban planning, logistics, or transportation geography modules, network analysis is a staple topic. Tackling a complex GIS assignment involving a network analysis gis shortest path query requires moving beyond basic straight-line measurements to understand topological connectivity, impedance cost matrices, and algorithmic routing.
This technical guide provides a complete walkthrough of network analysis GIS shortest path determination, network dataset construction, Dijkstra’s algorithm, service area generation, and step-by-step software execution.
If you are looking to master spatial routing, learning how to perform a network analysis gis shortest path is the most essential skill for mapping complex networks.
Network Distance vs. Euclidean Distance
To understand network analysis, you must first distinguish between Euclidean distance and Network distance:
-
Euclidean Distance (“As the Crow Flies”): Measures the straight-line distance between two points across a continuous two-dimensional surface using the Pythagorean theorem:$$d = \sqrt{(x_2 – x_1)^2 + (y_2 – y_1)^2}$$
-
Network Distance: Measures movement constrained to a discrete, interconnected linear network (such as roads, railways, or utility pipelines). Movement can only occur along valid network edges, obeying directionality, connectivity rules, and travel costs.
EUCLIDEAN (Straight Line)           NETWORK (Constrained to Road Grid)
       (A)                                 (A)=======[Edge 1]=======┐
        \                                                           ║ [Edge 2]
         \  <-- Ignored Obstacles                                   ║
          \                                                         ▼
          (B)                                (B)<======[Edge 3]=====╝
In urban environments, Euclidean distance routinely underestimates actual travel effort. A hospital might be 1.5 kilometers away in straight-line distance, but due to one-way streets, river barriers, and traffic signals, the shortest driving route could be 4.2 kilometers. Relying on straight-line buffers for transportation planning leads to inaccurate conclusions—a mistake that frequently costs students marks in lab write-ups.
1. Building a Network Dataset: Topologies and Impedance
Before executing a network analysis GIS shortest path calculation or generating travel catchments, you must construct or configure a Network Dataset (in ArcGIS Pro) or a Line Network Topology (in QGIS). A raw polyline shapefile of road centerlines is not natively network-aware; it is simply a collection of visual lines until topological rules and attributes are established.
A functional network dataset relies on five core structural components:
A. Edges (Links)
Edges represent linear elements through which entities travel (e.g., street segments, railway tracks, pedestrian walkways). Edges store lengths, speed limits, and traversal costs. They connect to other edges exclusively at nodes.
B. Nodes (Junctions)
Nodes represent endpoints, intersections, or connection points where edges meet. Topological integrity requires that intersecting lines share an explicit junction node; lines that simply cross visually without a shared vertex (like an overpass crossing a highway) will not allow routing transitions.
C. Turn Features and Rules
Turns model the cost and permissibility of moving from one edge to another through a junction node. Networks incorporate turn tables to model delay costs (e.g., a 45-second delay for a left turn across traffic versus 10 seconds for a right turn) or restricted maneuvers (e.g., prohibited U-turns or illegal left turns at busy intersections).
D. One-Way Restrictions and Directionality
Directional rules dictate allowable travel orientations along edges. Network attributes usually define direction using binary flags or text attributes such as
FT (From-Node to To-Node permitted) and TF (To-Node to From-Node permitted). Dividers, dual carriageways, and digitized single-direction urban streets require explicit directional constraints to prevent invalid routing.E. Impedance Attributes
Impedance is the single most important concept in network analysis. It defines the “cost” required to traverse an edge. Common impedance metrics include:
-
Distance Impedance: Measured in meters or miles (calculates the shortest physical path).
-
Time Impedance: Measured in seconds or minutes (calculates the fastest temporal path). Travel time for an edge is calculated as:$$\text{Time} = \frac{\text{Length}}{\text{Speed}}$$
-
Financial/Energy Cost: Measured in fuel consumption, toll fees, or slope effort.
[From-Node] ─── Edge 101 (Length: 500m, Speed: 50km/h -> Time: 36s) ─── [To-Node]
e
2. Network Analysis GIS Shortest Path: Dijkstra’s Algorithm
Once a network dataset possesses valid nodes, edges, and impedance values, routing algorithms evaluate paths between origin and destination points.
The foundational algorithm powering most network analysis GIS shortest path calculations is Dijkstra’s Algorithm, developed by Computer Scientist Edsger Dijkstra in 1956.
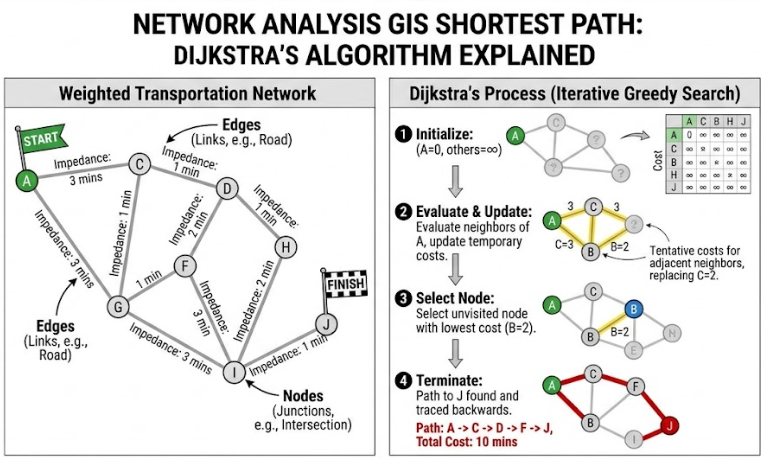
How Dijkstra’s Algorithm Works
Dijkstra’s algorithm is a greedy, iterative search algorithm that calculates the path of minimum cumulative impedance from a starting node $S$ to all other nodes in a weighted network.
   (B) ── [3 mins] ── (D)
  /  \               /
[2 mins] [1 min]  [4 mins]
/      \           /
(S) ── [5 mins] ── (C)
-
Initialization: Assign a tentative distance cost of infinity ($\infty$) to all nodes, and a cost of $0$ to the origin node $S$. Mark all nodes as unvisited. Set $S$ as the current node.
-
Neighbor Evaluation: For the current node, examine all unvisited neighboring nodes. Calculate their tentative cumulative costs through the current node:$$\text{Tentative Cost} = \text{Current Node Cost} + \text{Edge Impedance}$$
-
Cost Update: If the calculated tentative cost is less than the neighbor’s currently recorded cost, update the neighbor’s cost to this lower value and record the current node as its predecessor.
-
Node Selection: Once all neighbors of the current node are evaluated, mark the current node as visited. A visited node is never re-evaluated.
-
Iteration: Select the unvisited node with the lowest tentative cost as the new “current node” and repeat steps 2–4.
-
Termination: The algorithm terminates when the destination node is marked as visited or when all reachable nodes have been processed. The final route is reconstructed by tracing backwards through the predecessor nodes.
When solving routing problems in software, extensions like ArcGIS Network Analyst or QGIS Network Analysis Library refine basic Dijkstra algorithms using heuristic variants (such as A Search*) or Hierarchical Routing (e.g., prioritizing highways over local streets for long-distance routes) to process large street networks in milliseconds.
3. Generating Service Areas and Catchment Zones
Beyond standard network analysis GIS shortest path routing, spatial accessibility is modeled through service areas across continuous urban space by generating Service Areas by generating Service Areas (also referred to as travel time catchments or isochrones).When evaluating spatial accessibility beyond a simple point-to-point network analysis gis shortest path, urban planners rely heavily on service area polygons.
Service Areas vs. Standard Proximity Buffers
-
Standard Euclidean Buffers: Draw perfect circular zones around a point based on straight-line distance. They completely ignore road layouts, physical barriers (rivers, railways), and directional restrictions.
-
Network Service Areas (Isochrones): Measure distance or travel time outwards from a facility along valid network edges up to a specified maximum impedance limit (e.g., 5-minute, 10-minute, or 15-minute cutoffs). The extremities of these edge travel limits are then joined to form realistic catchment polygons.
CIRCULAR EUCLIDEAN BUFFER           NETWORK SERVICE AREA (ISOCHRONE)
       ┌─────────┐                                 ▲
    ┌──│─── 10m ──│──┐                             ║ 10-min drive
    │  │   (C)   │  │                       ◄═════(C)═════►
    └──│─────────│──┘                              ║
       └─────────┘                                 ▼
 (Overestimates real access)             (Accurate street access)
Key Applications of Service Areas
-
Emergency Service Coverage: Mapping areas accessible within 8 minutes from fire stations to evaluate compliance with public safety standards.
-
Retail Catchment Analysis: Determining the population live-work density within a 15-minute walk of a prospective supermarket site.
-
Urban Equity & Planning: Identifying “transit deserts” or areas lacking 10-minute walking access to primary healthcare clinics.
4. Practical Application: Hospital Access & Ambulance Routing
To contextualize these principles, consider a typical scenario encountered in university coursework ,Completing this specific network analysis gis shortest path workflow demonstrates practical competency in handling real-world transportation barriers.
Scenario Brief
An urban healthcare facility needs to assess emergency service coverage across a city. You are given a city road network layer, a location layer for emergency response stations, and a layer of emergency calls.Task 1: Calculate the fastest route for an ambulance from Station A to Emergency Call #104.Task 2: Generate 5-minute and 10-minute response catchment zones around all station locations to highlight underserved neighborhoods.
                 [ City Road Network ]
                           │
             ┌─────────────┴─────────────┐
             ▼                           ▼
[ Task 1: Route Solver ]    [ Task 2: Service Area Solver ]
             │                           │
  • Impedance: Travel Time    • Cutoffs: 5 & 10 Minutes
  • Impedance Attribute:      • Output: Overlapping
    Minutes (Length/Speed)      Isochrone Polygons
  • Obstacle: Closed Bridge              │
             │                           ▼
             ▼                [ Underserved Zone Map ]
 [ Optimized Route Layer ]
Analytical Steps for Your GIS Assignment
-
Data Pre-processing & Topological Verification: Inspect the road layer to confirm clean node-edge connections. Ensure fields for
Length_m,Speed_kmh, andDriveTime_minare calculated properly. -
Defining Impedance Attributes: Configure the network solver to use
DriveTime_minas the primary cost attribute instead of physical length. -
Setting Restrictions: Apply one-way attributes (
OneWay = 'FT'or'TF') and add temporary point line barriers (e.g., a closed bridge undergoing maintenance). -
Executing Route Optimization: Run the shortest path solver to route the ambulance. The solver applies Dijkstra’s algorithm, navigating around the bridge barrier and utilizing high-speed arterial roads to minimize travel time rather than total meters driven.
-
Executing Service Area Analysis: Run the service area solver using 5-minute and 10-minute cutoffs. The resulting isochrone maps reveal neighborhoods situated beyond a 10-minute response envelope, providing empirical evidence for your lab report recommendations.
5. Software Workflow Summary: ArcGIS Pro vs. QGIS
Here is a quick navigation reference for running network operations in both industry-standard software packages:
ArcGIS Pro (Network Analyst Extension)
1. Creating the Network Dataset
-
Navigate to the Catalog Pane $\rightarrow$ Right-click your Geodatabase Feature Dataset $\rightarrow$ Select New $\rightarrow$ Network Dataset.
-
Follow the wizard to set up connectivity rules, elevation fields, turn rules, and cost attributes (
Minutes,Meters). -
Click Build Network Dataset in the Geoprocessing pane to index nodes and edges.
2. Performing a network analysis gis shortest path Calculation in ArcGIS
-
Go to the Analysis tab on the top ribbon $\rightarrow$ Click Network Analysis $\rightarrow$ Select Route.
-
In the Network Analyst contextual ribbon, click Import Stops to load your origin and destination points.
-
Set Travel Mode to Driving Time or Driving Distance.
-
Click Run to generate the optimal polyline route and turn-by-turn directions.
3. Generating Service Areas
-
Go to Analysis $\rightarrow$ Network Analysis $\rightarrow$ Select Service Area.
-
Click Import Facilities to load point locations (e.g., fire stations).
-
In the Service Area tab, enter your Cutoffs (e.g.,
5 10 15). -
Select Output Type (Polygons) and Geometry Type (Overlapping or Dissolved), then click Run.
Before running any network analysis gis shortest path calculation in ArcGIS Pro, ensure your network dataset topological layers are fully built and indexed.
QGIS (Native & Plugin Workflows)
1. Shortest Path via Native Network Analysis
-
Open the Processing Toolbox panel (
Ctrl + Alt + T). -
Expand Network Analysis $\rightarrow$ Double-click Shortest Path (Point to Point) or Shortest Path (Layer to Point).
-
Select your vector road layer under Vector Layer Representing Network.
-
Set Path Type to Calculate to Shortest (Distance) or Fastest (Time).
-
Specify start and end points directly on the map canvas and click Run.
2. Advanced Routing & Isochrones via ORStools / QNEAT3
-
Install the ORStools plugin (uses OpenRouteService API) or QNEAT3 plugin (QGIS Network Analysis Toolbox 3) via the Plugins Manager.
-
For Isochrones (QNEAT3): Go to Processing Toolbox $\rightarrow$ QNEAT3 $\rightarrow$ Isochrones $\rightarrow$ Select Isochrone Area (from Layer).
-
Set your input points layer, select the road network layer, define your maximum speed field, set time cost limits (in seconds), and click Run to output vector catchment polygons.
Conclusion: Network Modeling in Real-World Spatial Planning
Mastering network analysis transforms how you analyze movement and connectivity across spatial environments. By moving beyond simple Euclidean approximations, you can accurately model real-world movement constrained by infrastructure, travel costs, speed limits, and topological rules.
Whether you are completing a transportation GIS assignment, designing transit networks, or optimizing supply chains, understanding network dataset mechanics, Dijkstra’s algorithm, and service area modeling equips you to deliver realistic, data-driven spatial insights.Mastering every component of a network analysis gis shortest path task ensures your lab reports and technical deliverables stand out with precise, data-driven conclusions.