
How GIS is Used in Environmental Risk & Flood Modeling: A Student Guide
Introduction
Flooding is one of the most significant natural hazards affecting communities, infrastructure, agriculture, and ecosystems. Changes in precipitation patterns, rapid urbanization, vegetation loss, and development in flood-prone areas can increase the consequences of extreme rainfall events.
GIS in Flood Modeling provides environmental scientists, hydrologists, geographers, and civil engineers with a framework for understanding where water is likely to move, accumulate, and potentially affect people and infrastructure.
Unlike a conventional map, a GIS-based flood model can combine elevation, rainfall, drainage networks, soils, land cover, and other environmental variables to represent spatial relationships. This makes GIS particularly useful for environmental risk assessment GIS, watershed analysis, flood susceptibility mapping, and disaster-management planning.
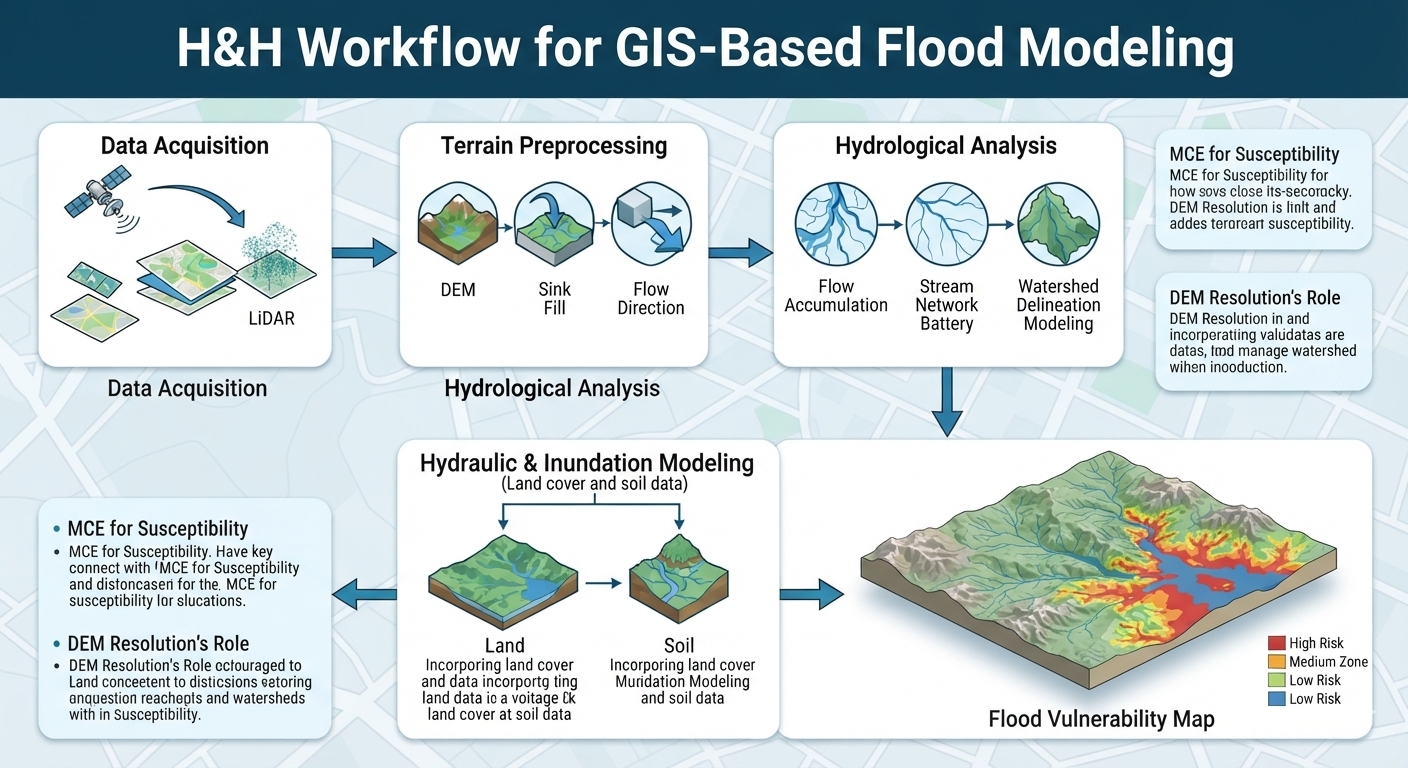
A typical flood study might begin with a Digital Elevation Model (DEM) and progress through terrain preprocessing, flow analysis, watershed delineation, and flood inundation mapping.
The important principle is that GIS does not simply “predict floods.” The reliability of a GIS flood model depends on the quality and resolution of its data, the hydrological assumptions used, the modeling method, and the validation of results.
1. The Role of Elevation Data in Flood Risk Assessment
Elevation is fundamental to hydrological modeling because terrain strongly influences how water moves across a landscape.
A GIS represents terrain numerically using elevation datasets. The most common types encountered by students are Digital Elevation Models (DEMs), Digital Terrain Models (DTMs), and LiDAR-derived elevation products.
What is a Digital Elevation Model?
A Digital Elevation Model (DEM) is a digital representation of elevation across a geographic area. In raster-based GIS, the landscape is represented as a grid of cells, with each cell containing an elevation value.
A DEM can be used to derive:
- Slope
- Aspect
- Flow direction
- Flow accumulation
- Drainage networks
- Watersheds
- Topographic depressions
- Terrain profiles
These derivatives form the foundation of many hydrology tools GIS workflows.
DEM versus DTM
The terminology can vary between datasets and organizations, but an important conceptual distinction is useful for students.
A Digital Terrain Model (DTM) generally attempts to represent the bare-earth terrain surface, excluding objects such as buildings and vegetation.
A DEM may refer more broadly to an elevation surface and can sometimes include above-ground features depending on how the dataset was produced.
Therefore, when selecting elevation data for hydrological analysis, students should investigate exactly what the dataset represents rather than assuming that every “DEM” is equivalent.
2. LiDAR and the Importance of Spatial Resolution
One of the most important considerations in GIS in Flood Modeling is spatial resolution.
Consider two hypothetical elevation datasets:
- 30 m SRTM: each raster cell represents approximately 30 × 30 metres.
- 1 m LiDAR: each cell represents approximately 1 × 1 metre.
The second dataset can represent much finer terrain detail.
This distinction matters because small features can strongly influence water movement.
A coarse DEM may fail to adequately represent:
- Small drainage channels
- Road embankments
- Small levees
- Narrow depressions
- Localized gullies
- Minor changes in terrain
A high-resolution dataset may capture these features much more effectively.
However, higher resolution does not automatically mean a more accurate flood model.
Model accuracy also depends on:
- Vertical accuracy
- Data acquisition date
- Terrain characteristics
- Hydrological assumptions
- Rainfall inputs
- Land-cover information
- Channel geometry
- Flood observations
- Model calibration and validation
For example, a highly detailed DEM with poor vertical accuracy may still produce misleading results.
A useful academic principle
Spatial resolution determines the level of terrain detail that can be represented, but resolution alone does not determine model accuracy.
This distinction is important when writing a university report about DEM flood analysis.
3. Key GIS Hydrological Workflows Explained
A basic raster hydrology workflow converts elevation data into information about how water may move across a landscape.
A simplified workflow is:
DEM → Sink correction → Flow direction → Flow accumulation → Stream extraction → Watershed delineation → Flood/inundation analysis
Let’s examine each stage.
3.1 Fill Sinks and Sink Removal
Natural landscapes contain depressions, but DEMs can also contain artificial depressions caused by measurement errors, interpolation, or differences between adjacent elevation cells.
In a raster hydrological model, these artificial depressions can interrupt the modeled flow path.
The Fill Sinks operation modifies the DEM so that water can flow continuously through the modeled terrain.
Basic workflow
- Load the DEM.
- Inspect the elevation surface.
- Identify potential sinks or depressions.
- Apply a sink-filling algorithm.
- Compare the corrected surface with the original.
- Use the processed DEM for subsequent hydrological calculations.
This step is particularly important in watershed delineation QGIS workflows.
However, students should not blindly fill every depression. Some depressions are genuine landscape features, wetlands, ponds, or closed basins.
The purpose of sink correction is therefore to prepare the terrain for a specific hydrological modeling assumption—not to erase real-world geography.
4. Flow Direction
After preparing the elevation surface, GIS can calculate flow direction.
Flow-direction algorithms estimate the direction water would travel from each raster cell based on surrounding elevation.
A commonly used approach is the D8 algorithm, which assigns flow toward one of the eight neighboring cells.
Conceptually:
Higher elevation → Lower elevation → Downstream flow path
The resulting raster provides the foundation for subsequent flow-accumulation calculations.
Why flow direction matters
Flow direction can help identify:
- Drainage pathways
- Valley directions
- Potential runoff routes
- Contributing areas
- Stream networks
It transforms a static elevation raster into a simplified representation of surface-water movement.
5. Flow Accumulation
Flow accumulation estimates how much upstream area contributes flow to each raster cell.
Imagine rainfall falling over a hillside.
Water from multiple upstream cells eventually converges into lower areas. A cell receiving flow from many upstream cells therefore has a higher accumulation value.
This creates a powerful method for identifying potential drainage channels.
Conceptual relationship
Low accumulation → hillslopes and local drainage
High accumulation → concentrated drainage pathways
Students can visualize the resulting raster to identify likely stream channels.
A threshold can then be selected to extract a preliminary stream network.
For example:
Cells receiving flow from more than a specified contributing area are classified as potential drainage channels.
The threshold should be justified rather than chosen arbitrarily.
6. Stream Network Extraction and Watershed Delineation
When using GIS in Flood Modeling, once flow accumulation has been calculated, students can derive a potential stream network.
Stream extraction workflow
- Calculate flow direction.
- Calculate flow accumulation.
- Select an accumulation threshold.
- Classify high-accumulation cells.
- Convert the resulting stream raster into vector features if necessary.
- Compare the modeled drainage network with available reference data.
This can provide a useful representation of drainage structure.
Watershed Delineation
A watershed is an area of land that drains toward a common outlet.
Watershed delineation is one of the most important applications of GIS hydrology.
A typical watershed delineation QGIS workflow involves:
DEM → Fill sinks → Flow direction → Flow accumulation → Outlet/pour point → Watershed boundary
The outlet, sometimes called a pour point, represents the location where water leaves the watershed being analyzed.
The resulting polygon defines the upstream area contributing runoff to that outlet.
Why watershed boundaries matter
They can be used to investigate:
- Flood risk
- Catchment characteristics
- Drainage planning
- Soil erosion
- Water-resource management
- Pollution pathways
- Agricultural runoff
- Stormwater management
A watershed-based approach is often more meaningful than analyzing arbitrary administrative boundaries because water does not follow political borders.
7. Inundation Mapping
Another important application of GIS in Flood Modeling is inundation mapping.
In simple terms, inundation mapping attempts to identify areas that could become submerged under a specified water level or flood scenario.
A basic terrain-based approach can compare a water-surface elevation with terrain elevation.
Conceptually:
Flooded where terrain elevation ≤ modeled water-surface elevation
For example, if a hypothetical flood scenario assumes a water level of 100 metres above a defined vertical datum, GIS can compare that elevation against the terrain surface.
Areas below the modeled water level can then be identified.
Important limitation
A simple elevation-threshold approach is not equivalent to a complete hydraulic flood model.
Real flooding is influenced by:
- River-channel geometry
- Flow velocity
- Roughness
- Hydraulic structures
- Bridges
- Culverts
- Flood defenses
- Inflow discharge
- Boundary conditions
- Time-dependent rainfall and runoff
Consequently, students should clearly state the assumptions behind their inundation method.
8. Multi-Criteria Evaluation for Environmental Risk
In GIS in Flood Modeling, risk is rarely controlled by a single environmental variable.
A low-lying area with permeable soil may behave differently from a low-lying area covered by impermeable urban surfaces.
This is where Multi-Criteria Evaluation (MCE) becomes useful.
MCE combines several spatial criteria to produce an overall suitability, susceptibility, or vulnerability index.
For flood vulnerability, possible variables include:
- Elevation
- Slope
- Soil permeability
- Land cover
- Rainfall intensity
- Distance from rivers
- Drainage density
- Historical flood occurrence
8.1 Slope
Steeper slopes can promote faster surface runoff, while flatter terrain can encourage water accumulation depending on local drainage conditions.
GIS can calculate slope directly from a DEM.
The resulting slope raster can then be classified into categories relevant to the research question.
8.2 Soil Permeability
Soil characteristics influence infiltration.
Highly permeable soils can allow greater infiltration under appropriate conditions, while less permeable soils may produce greater surface runoff.
A student can incorporate soil permeability into a flood susceptibility model by assigning standardized scores.
8.3 Land Cover
Urban surfaces such as roads, rooftops, and paved areas can substantially alter runoff characteristics. Understanding surface imperviousness is absolutely crucial when conducting high-quality GIS in Flood Modeling in mixed-use environments.
Land-cover datasets can therefore distinguish between:
- Built-up areas
- Forest
- Grassland
- Cropland
- Wetlands
- Bare land
- Water
The influence of each category should be justified using hydrological literature.
8.4 Rainfall Intensity
Rainfall is a critical driver of flooding.
A GIS model can incorporate:
- Total rainfall
- Maximum rainfall
- Rainfall intensity
- Event duration
- Return-period rainfall, where appropriate
Temporal consistency is crucial. Rainfall data from one period should not automatically be combined with land-cover or elevation information from an incompatible period without explaining the implications.
9. Building a Flood Vulnerability Map
A simplified MCE workflow might look like this:
Collect data
↓
Project datasets into a consistent coordinate system
↓
Prepare and clean raster layers
↓
Resample to a common spatial resolution
↓
Standardize each criterion
↓
Assign justified weights
↓
Calculate weighted overlay
↓
Generate flood vulnerability index
↓
Validate against historical flood observations
For example:
Flood Vulnerability Index = Σ (Criterion Score × Criterion Weight)
The resulting values can then be classified into categories such as low, moderate, and high susceptibility.
However, these categories are model outputs rather than absolute truths.
A scientifically credible study should explain:
- Why each variable was included
- How variables were standardized
- Why specific weights were selected
- What data limitations exist
- How the model was validated
10. Raster Surface Analysis in Environmental Studies
Raster surface analysis is particularly important because many environmental variables vary continuously across geographic space.
A raster can represent:
- Elevation
- Temperature
- Rainfall
- Soil moisture
- Vegetation indices
- Slope
- Distance
- Flood depth
GIS can then perform mathematical operations on these surfaces.
For example:
Raster A + Raster B → Combined environmental index
or:
Elevation − Water Surface → Relative flood depth
This ability to perform cell-by-cell calculations makes raster GIS particularly valuable for environmental modeling.
Students should remember that raster operations require compatible:
- Coordinate reference systems
- Extents
- Cell sizes
- Alignments
Otherwise, calculations can produce technically valid-looking but spatially inconsistent results.
11. Recommended Free Datasets for Environmental Students
Good analysis begins with appropriate data.
USGS EarthExplorer
United States Geological Survey EarthExplorer provides access to numerous Earth-observation and geographic datasets, including elevation and satellite products.
Students can investigate available:
- SRTM elevation data
- Landsat imagery
- LiDAR-related datasets where available
- Other remote-sensing products
Dataset availability varies by geographic region and product.
NASA Earthdata
NASA Earthdata provides access to a large collection of Earth-observation datasets.
Potentially useful environmental variables include:
- Rainfall
- Elevation
- Land cover
- Vegetation
- Surface temperature
- Satellite imagery
This makes it particularly useful for environmental science and hydrology coursework.
Copernicus DEM
The European Copernicus programme provides global elevation products that can be used for terrain and environmental analysis.
Students should examine the metadata for:
- Spatial resolution
- Vertical characteristics
- Geographic coverage
- Processing method
- Licensing conditions
The “best” DEM is therefore dependent on the specific study rather than simply being the dataset with the smallest pixel size.
12. Practical Student Workflow for a GIS Flood Project
If you are completing a university assignment, a defensible workflow could follow this structure:
Phase 1 — Define the research question
Example:
How can GIS in Flood Modeling identify areas with the greatest potential flood susceptibility?
Phase 2 — Assemble datasets
Collect:
- DEM
- Rainfall
- Soil
- Land cover
- Drainage
- Administrative boundaries
- Historical flood observations
Phase 3 — Prepare the data
Check:
- Coordinate reference systems
- Spatial resolution
- Data dates
- Missing values
- Raster alignment
- Data quality
Phase 4 — Perform hydrological analysis
Run:
- Sink correction
- Flow direction
- Flow accumulation
- Stream extraction
- Watershed delineation
Phase 5 — Develop the risk model
Standardize and combine the selected environmental variables using a transparent MCE methodology.
Phase 6 — Validate
Compare model outputs against available:
- Historical flood locations
- Observed flood extents
- River gauges
- Government hazard maps
- Field observations
Phase 7 — Communicate results
Your final report should include:
- Study-area map
- DEM
- Slope map
- Flow accumulation map
- Drainage network
- Watershed boundary
- Flood susceptibility/inundation map
- Methodology diagram
- Limitations
- Planning or environmental recommendations
Conclusion: GIS as a Foundation for Environmental Risk Management
GIS in Flood Modeling provides a powerful framework for transforming elevation, rainfall, soil, land-cover, and hydrological information into spatial evidence for environmental risk management.
For university students, the most important lesson is that flood modeling is not simply a sequence of GIS buttons. It is a process of translating physical environmental processes into spatial models while understanding the assumptions and uncertainties behind those models.
DEM quality affects terrain representation. Spatial resolution affects the features that can be captured. Flow-direction algorithms simplify real hydrological processes. MCE models depend on the selection and weighting of variables. Inundation models depend on their hydraulic or topographic assumptions. Validation is therefore essential.
Learning these principles gives students a foundation for more advanced work in hydrological modeling, environmental assessment, disaster-risk reduction, watershed management, and civil engineering.
If you are preparing a GIS hydrology assignment, flood susceptibility study, watershed delineation exercise, or raster-analysis project, expert guidance can help you structure the methodology, select appropriate datasets, troubleshoot GIS workflows, and present the analysis in a scientifically defensible academic format.