
Choropleth vs. Proportional Symbol Maps: When to Use Which
1. Introduction: Choosing the Right Thematic Map
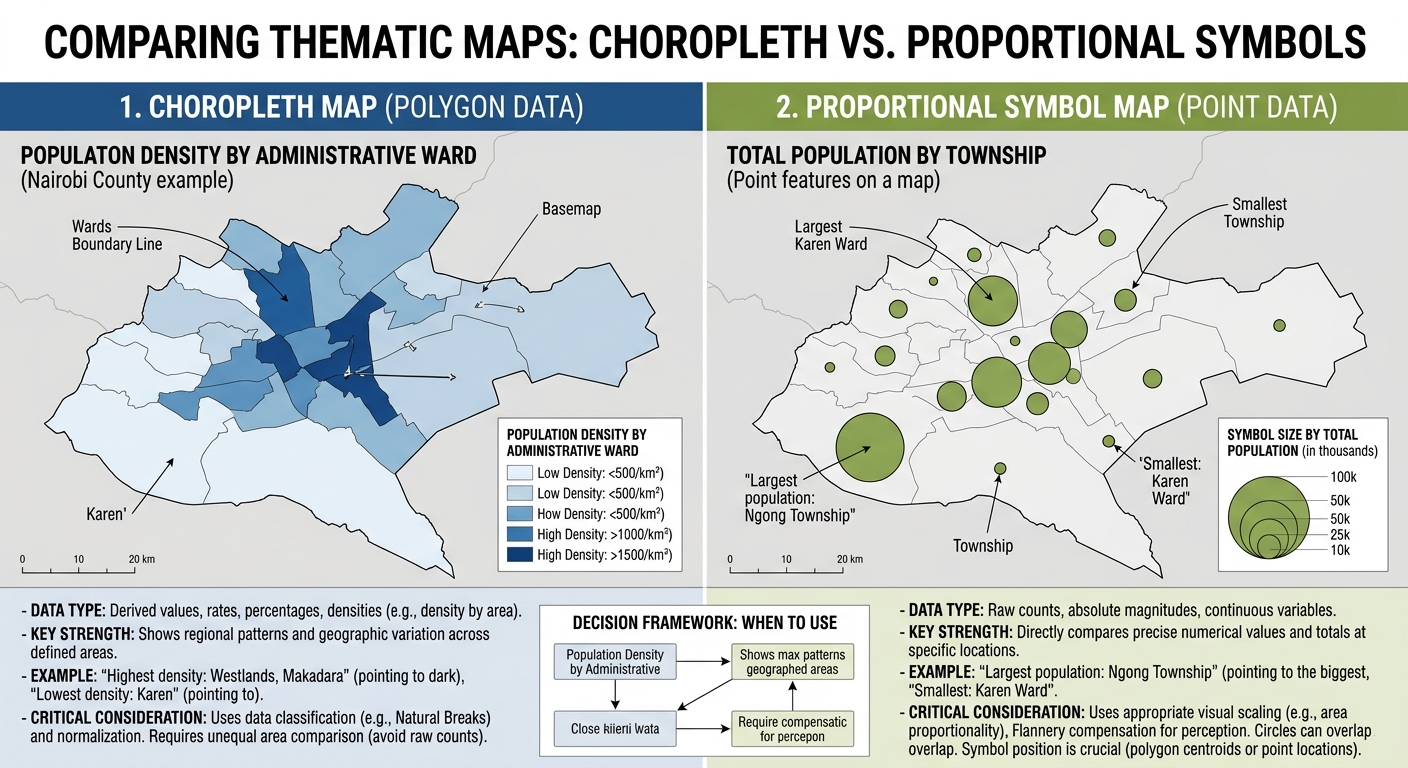
When designing thematic maps for your project, mastering Choropleth vs Proportional Symbol Maps GIS ensures you choose the correct method for your data. A thematic map communicates the geographic distribution of a particular variable, such as population density, income, disease incidence, rainfall, or the number of healthcare facilities.
However, the way you represent that variable determines what readers see and how they interpret the results.
Imagine you are mapping population across 20 administrative wards. Should you fill each ward with a different shade of colour, or draw circles that become larger as population increases?
Both approaches are useful, but they answer slightly different visual questions.
- A choropleth map uses different colours or shades to represent numerical values associated with geographic areas.
- A proportional symbol map uses symbols whose sizes represent the magnitude of a numerical value.
- A graduated symbol map groups numerical values into classes and assigns a symbol size to each class.
Choosing the wrong method can introduce misleading visual patterns. For example, colouring large administrative areas according to their total population may exaggerate their apparent importance, while mapping population density with circles may make the result unnecessarily difficult to interpret.
The fundamental principle is to match the mapping technique to the data and the question you want to answer. Esri’s thematic mapping guidance summarizes a useful rule: derived values, such as rates and percentages, are generally suited to choropleth maps, while raw magnitudes are often better represented with proportional or graduated symbols.
This guide explains how the two methods work, how to choose appropriate data classification methods, and how to avoid common normalization mistakes in QGIS and ArcGIS Pro.
2. Understanding Choropleth Maps
2.1 What is a choropleth map?
A choropleth map displays numerical data by assigning different colours or shades to geographic areas, usually polygons such as counties, districts, wards, or census zones.
Each polygon receives a colour based on the value of a selected attribute. Areas with lower values may appear in lighter shades, while areas with higher values appear in darker shades.
<AsyncImage query=”professional GIS choropleth map population density administrative districts graduated light to dark blue color legend cartography” aspectRatio=”16:9″ width=”100%”/>
Common examples include:
- Population density by administrative district.
- Unemployment rate by county.
- Percentage of households with access to clean water.
- Average household income by census tract.
- Forest cover percentage by administrative region.
Choropleth maps are especially effective when the research question concerns how a normalized measurement varies geographically across defined areas.
2.2 Which data should you map with a choropleth?
Choropleth maps work particularly well with rates, ratios, percentages, densities, and other comparable measures.
For example, consider the difference between population totals and population density.
| Ward | Population | Area (km²) | Population density (people/km²) |
|---|---|---|---|
| Ward A | 20,000 | 10 | 2,000 |
| Ward B | 40,000 | 80 | 500 |
| Ward C | 30,000 | 15 | 2,000 |
Ward B has the largest population, but Ward A and Ward C have higher population densities.
If your objective is to understand where people are most concentrated, mapping population density is more informative than colouring the wards by total population.
The density calculation is:
[
\text{Population density}=
\frac{\text{Total population}}{\text{Land area}}
]
The units must be clear. For this example, population is divided by area measured in square kilometres.
Other possible normalized indicators include:
- Clinic access rate: Residents with access divided by the relevant population.
- Unemployment rate: Unemployed people divided by the relevant labour force.
- Forest cover percentage: Forest area divided by the chosen reference area, multiplied by 100.
- Disease incidence rate: New cases divided by the relevant population at risk, often expressed per 1,000 or 100,000 people.
Normalization is not simply dividing every value by area. It means selecting a denominator appropriate to the scientific or policy question.
2.3 Common choropleth mistake: Mapping raw counts
One of the most frequent beginner errors in thematic cartography is symbolizing raw counts across geographic areas of unequal size or population without considering what those totals mean.
Suppose you map the total number of hospitals in each county. A densely populated county may have more hospitals simply because it serves more people.
A choropleth of raw hospital counts can therefore conflate total service capacity with geographic concentration or access.
A proportional symbol map may be more appropriate if your question is simply, “Where are the most hospitals located by county?” If your question concerns healthcare provision relative to population, a rate such as hospitals per 100,000 residents may be more informative as a choropleth.
The right choice depends on the research question:
| Research question | Recommended starting point |
|---|---|
| Which counties have the largest population totals? | Proportional symbols or graduated symbols |
| Which counties have the highest population density? | Choropleth |
| Which counties have the highest percentage of households with electricity? | Choropleth |
| Where are the largest concentrations of reported cases? | Proportional symbols for counts; choropleth of rates for population-adjusted comparisons |
| Which administrative areas have the highest unemployment rates? | Choropleth |
Important: Small-area rates can be unstable when their denominators are small. For example, one additional disease case may greatly change an incidence rate in a small population. Depending on the research purpose, confidence intervals, age adjustment, or statistical smoothing may be necessary.
2.4 Data classification methods for choropleth maps
Once you have selected the correct variable, you need to choose a data classification method.
Classification divides numerical values into ranges, assigning each range a colour. The choice affects the visual story that the map communicates.
Three widely used methods are Natural Breaks (Jenks), Equal Interval, and Quantile.
Natural Breaks (Jenks)
Natural Breaks identifies class boundaries based on groupings within the data distribution. It seeks to group similar values while separating values that differ substantially.
Best used when:
- The data contain natural groupings.
- Values are unevenly distributed.
- You want to communicate the structure of one dataset.
For example, a map of income levels may contain clusters of relatively low, medium, and high values. Natural Breaks can identify groupings that reflect those patterns.
Limitation: Class boundaries depend on the dataset. If you make two maps for different years, the same colours may represent different numerical ranges. This can make direct comparison misleading.
Equal Interval
Equal Interval divides the range between the minimum and maximum values into classes of equal numerical width.
If the data range from 0 to 100 and you choose five classes, the class width is 20.
Best used when:
- The data have a meaningful, interpretable numerical range.
- Equal-sized numeric intervals are important.
- Readers need to compare values against fixed numerical ranges.
Limitation: When the data are highly skewed, most observations may fall into one or two classes while other classes contain very few observations.
Quantile
Quantile classification places approximately the same number of features in each class.
For instance, five quantile classes would each contain about 20% of the observations, subject to ties and implementation details.
Best used when:
- You want to compare relative rankings.
- You need to distribute features across classes.
- Identifying the highest-ranking areas is a priority.
Limitation: Values within a class may differ considerably, and very similar values can fall on opposite sides of a class boundary.
Natural Breaks vs. Equal Interval vs. Quantile
| Feature | Natural Breaks (Jenks) | Equal Interval | Quantile |
|---|---|---|---|
| How classes are created | Based on data groupings | Equal numerical widths | Approximately equal feature counts |
| Main advantage | Reflects clustering in the data distribution | Easy to interpret numerically | Highlights relative ranking |
| Potential drawback | Boundaries vary across datasets | Can leave some classes sparse | Can group dissimilar values together |
| Suitable use | Exploring one unevenly distributed dataset | Values with meaningful fixed ranges | Ranking areas within one dataset |
| Best for comparing multiple dates? | Only if consistent breaks are applied | Yes, when common breaks are appropriate | Yes, if the same thresholds are retained |
No classification method is automatically best. Your choice should reflect the distribution of the data and the purpose of the map.
For a time-series comparison, consider applying the same class boundaries across all maps rather than recalculating Natural Breaks independently for each year. Otherwise, a colour may represent a different value in each year, creating a false impression of change.
3. Understanding Proportional and Graduated Symbol Maps
3.1 What is a proportional symbol map?
A proportional symbol map represents numerical magnitudes using symbols whose sizes vary according to individual data values.
For example, a map of hospitals could use circles, with larger circles representing hospitals with more beds.
A map of total population by county could place a circle at each county’s representative location. The circles would scale with the total population rather than filling the entire polygon with a colour.
<AsyncImage query=”professional GIS proportional circle symbol map total population by city different sized graduated proportional circles on neutral geographic basemap” aspectRatio=”16:9″ width=”100%”/>
Proportional symbols are useful when the main purpose is to compare totals or magnitudes.
Common applications include:
- Total population by city.
- Number of hospital beds by facility.
- Annual cargo volume by port.
- Crop production by agricultural region.
- Number of accidents at road intersections.
Proportional symbols can represent point features directly. They can also be used with polygon datasets by placing symbols at representative locations, such as polygon centroids. When mapping polygons this way, ensure the symbol positions and overlaps do not make geographic relationships difficult to understand.
3.2 What is a graduated symbol map?
Graduated symbols also use size to represent numerical values, but they first divide those values into discrete classes.
For example, cities may be grouped into population classes of:
- 1,000–10,000 residents.
- 10,001–50,000 residents.
- 50,001–100,000 residents.
- More than 100,000 residents.
Each class receives a different symbol size.
The important distinction is that symbols represent class ranges, not necessarily each feature’s exact magnitude. Two cities in the same class may receive the same symbol size even if one has twice the population of the other.
Proportional symbols, by comparison, vary more continuously according to the individual values. ArcGIS Pro documents this distinction in its graduated symbols guide and proportional symbology guide.
3.3 Proportional symbols vs. graduated symbols
| Feature | Proportional symbols | Graduated symbols |
|---|---|---|
| Symbol sizes | Vary according to individual values | One size per class |
| Numerical representation | More continuous | Discrete classes |
| Best for | Comparing individual magnitudes | Simplifying comparisons into groups |
| Legend | Usually needs representative size values | Shows size categories and class ranges |
| Example | Exact passenger counts by airport | Airports grouped into passenger-volume classes |
| Main risk | Large symbols overlap smaller ones | Class boundaries hide variation within a class |
Both methods can use point layers or point symbols placed over polygons. Neither requires the underlying data to be a true point dataset, although point-based features are common.
3.4 A critical design issue: Linear versus area scaling
A major beginner mistake is making the diameter of a circle directly proportional to the numerical value and assuming this produces a mathematically proportional symbol map.
For circles, area is generally the visual quantity intended to represent magnitude.
The area of a circle is:
[
A=\pi r^2
]
If a circle should represent four times the quantity of another circle, its area should be four times as large. Its radius, however, should only double.
For standard area-proportional circles:
[
r\propto\sqrt{v}
]
Here, (r) is the symbol radius and (v) is the data value.
Consider two cities:
| City | Population | Relative area | Relative radius |
|---|---|---|---|
| City A | 25,000 | 1 | 1 |
| City B | 100,000 | 4 | 2 |
City B has four times the population of City A, so its circle should have four times the area but only twice the radius.
If you make City B’s radius four times larger, its circle will have 16 times the area. This greatly exaggerates the difference.
3.5 Flannery perceptual scaling
Even when areas are mathematically proportional, map readers can underestimate differences between large and small circles.
Flannery compensation is a perceptual scaling technique developed to account for this effect. It increases the relative sizes of larger symbols so that readers may perceive differences in magnitude more accurately.
However, it is not a universal correction. The appropriate scaling depends on the data, symbol design, and intended audience.
Use Flannery compensation thoughtfully:
- Begin with standard area-proportional scaling.
- Inspect whether large and small symbols are distinguishable.
- Apply perceptual compensation only if it improves readability and interpretation.
- Make sure the legend accurately explains the resulting symbol sizes.
- Avoid mixing multiple size-scaling methods in the same map without a clear reason.
QGIS provides scaling options, including Flannery, through the data-defined size assistant. ArcGIS Pro provides appearance compensation for eligible proportional symbols. See the QGIS symbology documentation and ArcGIS Pro proportional symbols documentation.
4. Comparison Matrix: Which Map Type Should You Use?
| Feature | Choropleth map | Proportional symbol map | Graduated symbol map |
|---|---|---|---|
| Main visual variable | Colour or shade | Symbol size | Symbol size by class |
| Typical geometry | Polygons | Points or symbols located at representative positions | Points, lines, or symbols over polygons |
| Preferred data | Rates, percentages, densities, normalized measures | Raw counts and magnitudes | Counts and magnitudes when grouped comparisons are useful |
| Normalization | Usually necessary when comparing unequal populations or areas | Not required when showing raw totals | Not required when showing raw totals |
| Data classification | Generally required for discrete classes, though unclassed colour ramps are possible | Often unclassed, but legend sizes are selected for interpretation | Required |
| Main strength | Reveals geographic variation across areas | Shows relative magnitude directly | Simplifies comparisons into understandable groups |
| Common mistake | Mapping raw totals where a rate or density is needed | Scaling symbol diameter directly with values when area should be proportional | Using arbitrary classes that hide important differences |
| Common visual risk | Similar colours can be hard to distinguish | Large symbols obscure other features | Features within the same class appear identical |
Remember: The geometry column describes the usual mapping approach, not an absolute restriction. Choropleths normally colour polygons. Symbol maps can use point locations or representative point symbols over polygons.
5. Decision Framework: Choosing the Correct Map in QGIS or ArcGIS Pro
Use this text flowchart before opening the symbology panel.
START
  |
  v
What does the variable represent?
  |
  +-- A rate, percentage, ratio, or density
  |        |
  |        v
  |   Are the values associated with
  |   geographic areas (polygons)?
  |        |
  |        +-- YES --> CHOROPLETH MAP
  |        |            Choose a meaningful colour scheme
  |        |            and suitable classification method.
  |        |
  |        +-- NO --> Consider mapping the point or line
  |                    values with appropriate symbols.
  |
  +-- A total count or magnitude
           |
           v
      Do you need to compare individual values
      continuously or group them into classes?
           |
           +-- Continuous comparison
           |        |
           |        v
           |   PROPORTIONAL SYMBOL MAP
           |   Use appropriate area scaling.
           |
           +-- Grouped comparison
                    |
                    v
               GRADUATED SYMBOL MAP
               Choose defensible class breaks
               and a clear size legend.
This is a practical guide rather than a universal rule. A map may show total population with proportional symbols, but a choropleth may be suitable if the research question concerns normalized population measures.
Example 1: Population density by ward
Recommended map: Choropleth.
Why: The objective is to compare population concentration between wards. Calculate population per square kilometre using an appropriate area measure, then choose a sequential colour scheme.
In QGIS:
- Open the polygon layer’s Properties → Symbology.
- Select Graduated.
- Choose the population-density field.
- Select an appropriate classification method and number of classes.
- Apply a sequential colour ramp and inspect the legend.
In ArcGIS Pro:
- Select the polygon layer.
- Open Feature Layer → Symbology.
- Choose Graduated Colors.
- Select population density, choose the classification method, and set the number of classes.
- Review class boundaries and legend labels.
Example 2: Total population by town
Recommended map: Proportional symbols.
Why: The objective is to show how total population varies between towns. Larger circles represent larger totals.
In QGIS:
- Use a point layer representing towns, or create representative point locations from town polygons.
- Apply a point symbol and configure the data-defined Size property.
- Use the size assistant to establish a suitable scaling range.
- Add a size legend with clearly labeled reference values.
In ArcGIS Pro:
- Select the town point layer, or a polygon layer if you intend to place symbols over its areas.
- Open Feature Layer → Symbology.
- Choose Proportional Symbols.
- Select the population field and configure symbol sizes and the legend.
If a simplified grouped presentation is more important than showing differences between individual values, use Graduated Symbols instead.
Example 3: Number of hospital beds by county
Recommended map: Proportional or graduated symbols for raw totals; a choropleth for an appropriate rate.
If the research question is total hospital capacity, symbol sizes can represent the number of beds in each county. If the question concerns capacity relative to population, calculate beds per 100,000 residents and map that rate using a choropleth.
This distinction is essential because the same underlying dataset can support different maps depending on the research question.
6. Common Beginner Mistakes to Avoid
Before exporting your map, check the following:
- Mapping raw population counts with a choropleth: Consider whether density or another normalized measure better answers the research question.
- Normalizing without a reason: Dividing by area or population is not automatically correct. Choose a denominator that matches the analytical objective.
- Using linear radius scaling for proportional circles: Circle area, not diameter, is generally intended to represent magnitude. Use appropriate area-proportional scaling.
- Choosing classes without reviewing the data distribution: Inspect histograms and class boundaries instead of accepting defaults blindly.
- Using different class breaks on comparison maps: For temporal or regional comparisons, use consistent thresholds when direct comparison is important.
- Creating a cluttered symbol map: Large circles can obscure smaller features. Adjust symbol ranges, transparency, outlines, or map scale without distorting the underlying magnitude.
- Ignoring the legend: A reader should understand both colour classes and symbol sizes without needing to inspect the attribute table.
7. Conclusion
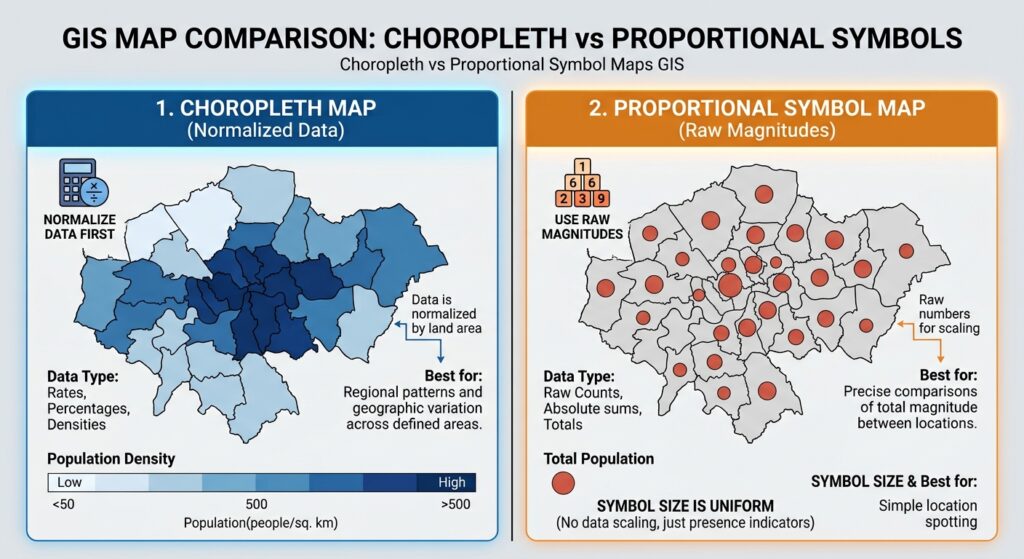
Choropleth and proportional symbol maps are both valuable thematic mapping techniques, but they communicate different aspects of spatial data.
A choropleth is generally best for displaying normalized measures across areas, such as rates, percentages, and densities. Proportional symbols are useful for displaying the magnitude of individual values, such as population totals or cargo volumes. Graduated symbols simplify those magnitudes into classes when a grouped comparison is more appropriate.
The most important decision is not which map looks more attractive. It is which visual method represents the data accurately and answers the research question clearly.
For university GIS assignments, begin by identifying whether the variable is a total, a rate, a percentage, a density, or a category. Select the mapping method accordingly, choose classification and scaling methods carefully, and inspect the legend before exporting.
A well-designed thematic map does not simply display numbers geographically. It helps readers understand what those numbers mean.