
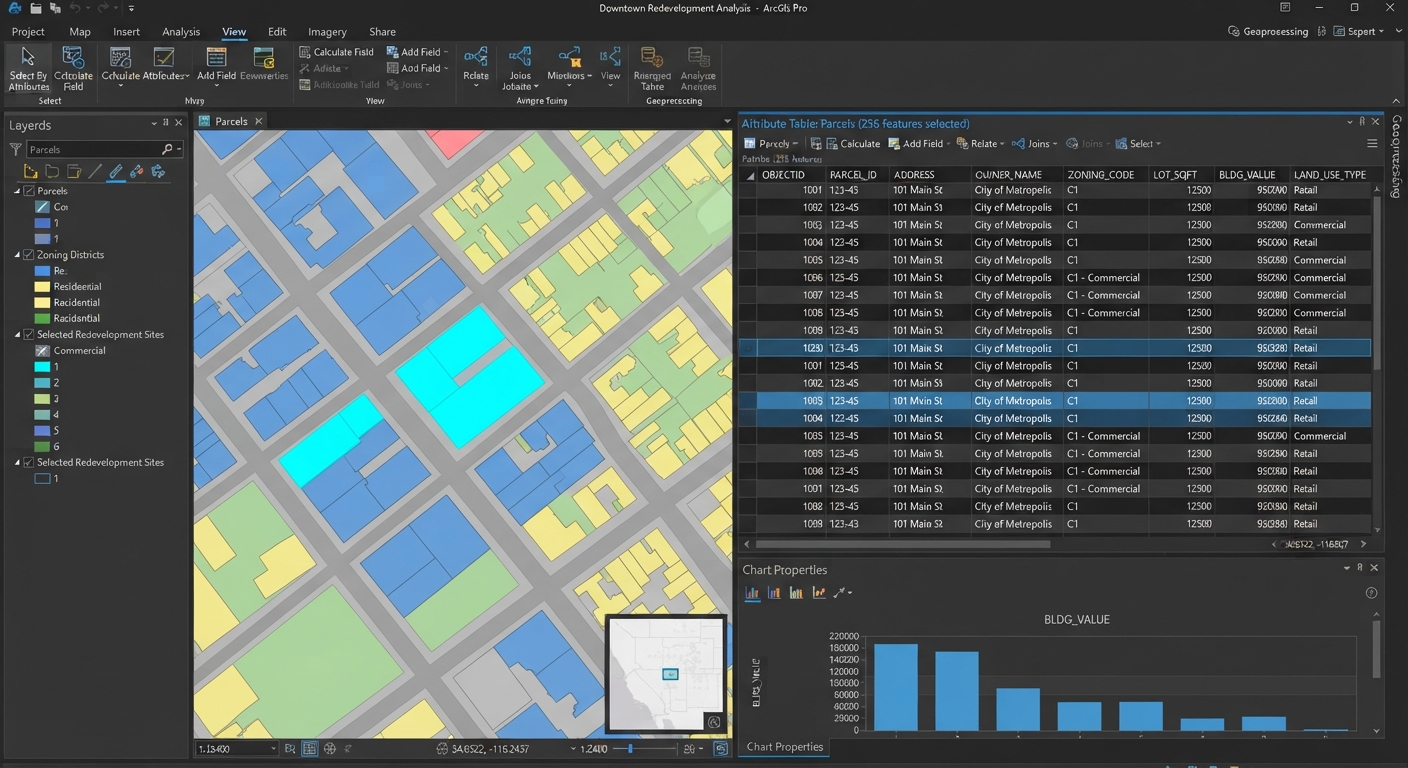
Attribute Table in GIS: 7 Essential Skills for Beginners
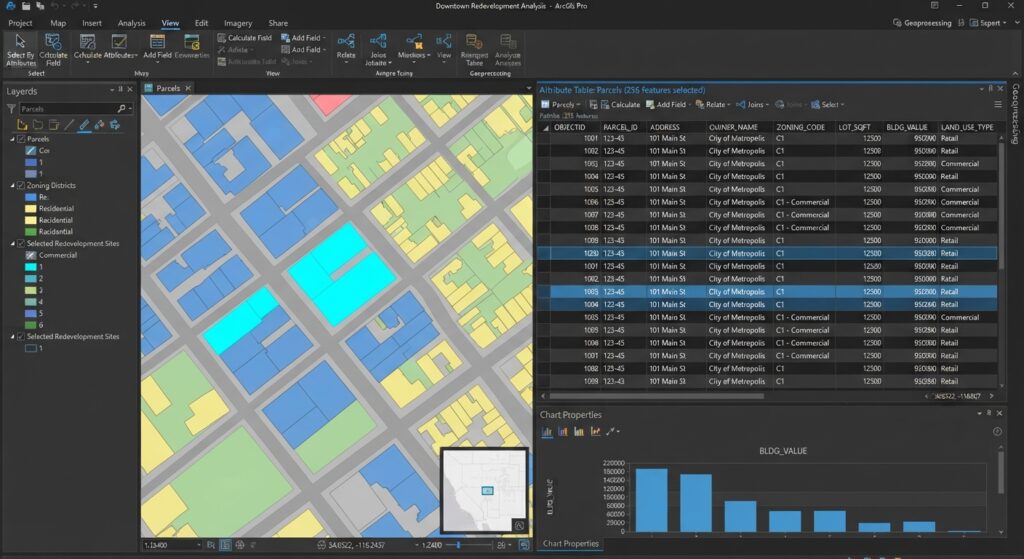
An attribute table in GIS is the tabular database attached to a spatial layer that stores descriptive information about geographic features. Each row represents a feature, while each column stores an attribute describing that feature, such as population, name, area, or land-use type.
For GIS students, understanding tabular data is just as important as understanding maps. Whether you are completing a university GIS assignment, performing spatial analysis, or preparing a professional dataset, knowing how to query, calculate, edit, and interpret attribute data can save significant time.
This GIS attribute table tutorial explains the anatomy of an attribute table, how to select records using queries, how to use the Field Calculator in QGIS and ArcGIS Pro, and how to avoid common mistakes.
1. Understanding the Core Anatomy of an Attribute Table in GIS
Think of an attribute table as a spreadsheet connected directly to a map.
For example, imagine a GIS layer containing counties in Kenya:
| FID | County | Population | Area_km2 | LandUse |
|---|---|---|---|---|
| 1 | Nairobi | 4,397,073 | 696 | Urban |
| 2 | Kiambu | 2,417,735 | 2,449 | Mixed |
| 3 | Nakuru | 2,162,202 | 7,495 | Agricultural |
| 4 | Mombasa | 1,208,333 | 219 | Urban |
The map displays the geographic boundaries, while the attribute table provides information about those boundaries.
Rows represent features
A row, also called a record, normally represents one geographic feature.
For example:
- One row = one county
- One row = one road
- One row = one school
- One row = one river
- One row = one parcel
If a layer contains 500 buildings, its attribute table will normally contain 500 feature records, assuming every building is represented by one feature.
Columns represent attributes
A column, also called a field, contains a particular characteristic of the features.
For example:
Name→ name of the featurePopulation→ number of peopleArea→ geographic areaLandUse→ classificationDate→ observation or construction date
The combination of rows and columns creates tabular spatial data: information that describes geographic features and is linked to their spatial locations.
Understanding GIS Field Types
Before calculating or querying a field, you need to understand its data type.
1. Text/String
Text fields contain words or combinations of letters and numbers.
Examples:
Nairobi
Residential
Primary School
KE-001
A text field should generally be placed inside quotation marks when used in an expression.
Example:
"LandUse" = 'Residential'2. Integer
An integer is a whole number without a decimal component.
Examples:
10
500
125000
Population counts are commonly stored as integers.
3. Float/Decimal
A floating-point or decimal field stores numbers containing decimal values.
Examples:
12.5
45.72
103.456
Measurements such as rainfall, elevation, or average household income may require decimal fields.
4. Date/Date-Time
Date fields store dates and sometimes times.
Examples:
2026-09-28
2026-09-28 14:30
Date fields are useful when analyzing changes over time.
What Is FID or ObjectID?
You will often encounter a field such as FID, OBJECTID, or another automatically generated identification field.
This is generally used to uniquely identify individual records within a GIS dataset.
For example:
FID 1 → Nairobi
FID 2 → Kiambu
FID 3 → Nakuru
The important point is that an FID or ObjectID is usually not a meaningful attribute like population or land use. It is primarily an identifier maintained by the GIS software.
Do not assume that FID 10 means the feature has a population of 10 or any other real-world meaning.
2. Selecting Data Using Attribute Queries
One of the most useful skills when working with an attribute table is selecting only the records that meet a particular condition. Querying data within an attribute table in GIS allows you to filter specific records
This is where SQL query GIS concepts become useful.
Suppose you have a layer containing cities and a Population field.
You might want to find all cities with populations greater than 50,000.
Conceptually, the condition is:
Population > 50000The GIS software evaluates every record and selects the features satisfying that condition.
Basic Operators
Common operators include:
| Operator | Meaning |
|---|---|
= |
Equal to |
<> |
Not equal to |
> |
Greater than |
< |
Less than |
>= |
Greater than or equal to |
<= |
Less than or equal to |
AND |
Both conditions must be true |
OR |
At least one condition must be true |
For example:
Population > 50000selects records with populations above 50,000.
You can combine conditions:
Population > 50000 AND LandUse = 'Urban'This asks the GIS to find features satisfying both conditions.
Another example:
Population > 100000 OR Area_km2 > 5000selects features satisfying either condition.
Running a Query in QGIS
In QGIS, you can use the Select by Expression tool.
Step 1: Open the attribute table
Right-click your layer in the Layers panel and choose:
Open Attribute Table
Step 2: Open Select by Expression
Choose the selection-by-expression option from the attribute table toolbar.
Step 3: Enter your expression
For example:
"Population" > 50000QGIS uses double quotation marks around field names in expressions.
For text:
"LandUse" = 'Urban'Step 4: Run the expression
QGIS will select all records satisfying the condition.
The corresponding geographic features will also become selected on the map.
This demonstrates one of the most powerful characteristics of GIS: the table and map are connected.
Running a Query in ArcGIS Pro
ArcGIS Pro commonly uses Select By Attributes for this type of operation.
Step 1: Open the attribute table
Open the table associated with your layer.
Step 2: Choose Select By Attributes
Use the Select By Attributes tool.
Step 3: Build the expression
For example:
Population > 50000For text values:
LandUse = 'Urban'Step 4: Apply the selection
ArcGIS Pro will select the records matching your expression and highlight the corresponding features.
The exact SQL syntax can vary somewhat depending on the underlying data source, so when working with a specific dataset, use the expression builder provided by the software.
3. Using the Field Calculator
Mastering the Field Calculator is a vital skill when working with an attribute table in GIS. The Field Calculator is another essential GIS skill.
Instead of simply selecting records, the Field Calculator allows you to create or update attribute values using expressions.
Common tasks include:
- Calculating area
- Calculating distances
- Updating values
- Converting units
- Combining text fields
- Creating classifications
- Performing mathematical calculations
Calculating Area in QGIS
Suppose you have a polygon layer and want to calculate its area.
Create a new decimal field called:
area_km2Then use:
$area / 1000000if the layer’s coordinate system uses metres and you want the result in square kilometres.
A more explicit approach is to use appropriate geometry functions and ensure that your coordinate reference system is suitable for the calculation.
Important
Do not blindly calculate area from geographic coordinates such as latitude and longitude.
For accurate area calculations, use an appropriate projected coordinate reference system or an appropriate geodesic/ellipsoidal calculation method.
This is a common source of errors in student GIS assignments.
Calculating Area in ArcGIS Pro
In ArcGIS Pro, you can use the Calculate Geometry Attributes tool or the Field Calculator.
For example, you can calculate:
- Area
- Perimeter
- X coordinate
- Y coordinate
- Length
The exact expression depends on the field and calculation you need.
For a straightforward area workflow, Calculate Geometry Attributes is often easier for beginners because it allows you to specify the geometry property and output unit directly.
Concatenating Text Fields
Suppose your table contains:
| FirstName | LastName |
|---|---|
| Jane | Wanjiku |
| Peter | Otieno |
You want to create a FullName field.
QGIS
You can use:
"FirstName" || ' ' || "LastName"The result becomes:
Jane Wanjiku
Peter Otieno
You can also use functions such as:
concat("FirstName", ' ', "LastName")This can be particularly useful when creating labels.
ArcGIS Pro
In ArcGIS Pro, a Python expression can be used in the Field Calculator:
!FirstName! + " " + !LastName!The !FieldName! syntax identifies fields when using Python expressions in ArcGIS Pro.
For example:
!County! + " County"could produce:
Nairobi County
Kiambu County
Nakuru County
Updating Values with the Field Calculator
Suppose a field contains population values and you want to classify them into categories.
For example:
Population < 50000 → Small
Population 50000–200000 → Medium
Population > 200000 → Large
In QGIS, a conditional expression could look like:
CASE
WHEN "Population" < 50000 THEN 'Small'
WHEN "Population" <= 200000 THEN 'Medium'
ELSE 'Large'
END
This is useful for creating thematic maps.
Instead of symbolizing every individual population value, you can symbolize the resulting categories.
The same basic concept can be implemented in ArcGIS Pro using a conditional Python expression or other Field Calculator expressions.
4. Common Mistakes in GIS Assignments
A common mistake when managing an attribute table in GIS is mixing up data types. Attribute tables are relatively simple once you understand their structure, but several mistakes appear repeatedly in university GIS work.
Mistake 1: Mixing Data Types
One of the most common problems is trying to perform a mathematical calculation on a text field.
For example, suppose population has accidentally been stored as text:
"50000"rather than as a numeric value:
50000A calculation such as:
Population * 2may fail or behave unexpectedly.
How to avoid it
Check the field type before performing calculations.
Use:
- Text for names and categories
- Integer for whole-number measurements
- Float/Decimal for values requiring decimals
- Date for dates
Mistake 2: Editing the Original Dataset Without a Backup
Students sometimes make multiple Field Calculator changes directly to the original layer.
If a calculation goes wrong, recovering the original values may be difficult.
Better approach
Before major edits:
- Save a copy of the dataset.
- Give the copy a clear name.
- Perform calculations on the working copy.
- Check the results.
- Save your final dataset separately.
For important coursework, maintaining a simple versioning system can save considerable time.
Mistake 3: Ignoring Field Name Restrictions
Different GIS formats have different limitations concerning field names.
Older formats, particularly shapefiles, have historically imposed restrictions on field names, including limitations on name length.
For example, instead of creating a very long field name such as:
Average_Annual_Rainfall_Millimetersyou might use:
AvgRain_mmwhen working with a format that has restrictive field-name rules.
How to avoid it
Use short, descriptive field names:
Pop_2026
Area_km2
LandUse
RoadType
AvgRain
Also avoid spaces and unnecessary special characters when working across different GIS platforms.
Mistake 4: Calculating Geometry in the Wrong Coordinate System
A student may calculate area or distance without checking the layer’s coordinate reference system.
If your data uses geographic coordinates measured in degrees, simply treating those coordinates as metres can produce meaningless measurements.
How to avoid it
Before calculating geometry, ask:
- What CRS is my dataset using?
- Are the coordinates geographic or projected?
- What units does the CRS use?
- Is the projection appropriate for the study area?
- Does the assignment specify a particular CRS?
This small check can prevent major errors in your final analysis.
Attribute Table in GIS: A Practical Student Workflow
When working on a GIS assignment, a simple workflow can keep your analysis organized:
1. Inspect the data
Open the attribute table and understand what every field represents.
↓
2. Check field types
Identify text, integer, decimal, date, and identifier fields.
↓
3. Select relevant records
Use attribute queries to isolate the features needed for your analysis.
↓
4. Create calculated fields
Use the Field Calculator for area, distance, classifications, text combinations, and other derived values.
↓
5. Verify your results
Check several records manually to make sure the calculation produced sensible values.
↓
6. Save your work
Keep an original copy and a clearly named working/final version.
↓
7. Use the results in your map
Your attribute calculations can drive labels, classifications, symbology, and further spatial analysis.
Conclusion
The attribute table in GIS is where much of the descriptive information behind a map is stored. Once you understand that rows represent features and columns represent attributes, you can begin performing powerful operations such as filtering records, querying data, calculating geometry, combining text, and creating new analytical fields.
For beginners, focus on four core skills:
- Understand field types and table structure
- Use attribute queries to select relevant features
- Use the Field Calculator to create and update information
- Check your CRS and data before performing calculations
These skills form a foundation for more advanced GIS work, including spatial joins, geoprocessing, thematic mapping, and spatial analysis.
If you are struggling with a GIS assignment, don’t just copy an expression and hope it works. Download a small sample dataset, open its attribute table, experiment with queries and calculations, and verify your results step by step. The more comfortable you become with tabular data, the easier your larger GIS projects will become.