
GIS in Urban Planning & Smart Cities: Coursework, Applications & Project Ideas
Introduction
When applying GIS in Urban Planning, modern cities must be analyzed as complex spatial systems where housing, roads, public transport, and utilities compete for limited land. For urban planners and civil engineers, understanding where something happens is just as important as understanding what is happening
This is where GIS in urban planning becomes essential.
Geographic Information Systems (GIS) allow planners to collect, organize, analyze, visualize, and communicate geographically referenced information. Instead of examining infrastructure, demographics, land use, or environmental conditions as isolated datasets, GIS makes it possible to examine their spatial relationships.
For example, a planner evaluating a proposed housing development could combine:
- Population density
- Existing land use
- Road accessibility
- Public transportation
- Elevation and slope
- Flood-prone areas
- Schools and healthcare facilities
- Utility infrastructure
- Environmental restrictions
The result is a more evidence-based approach to planning.
For university students, learning GIS in urban planning is therefore more than learning how to produce maps. It involves developing spatial reasoning, data analysis, problem-solving, and decision-support skills that are increasingly relevant to urban development and municipal governance.
1. Core Applications of GIS in Urban Planning
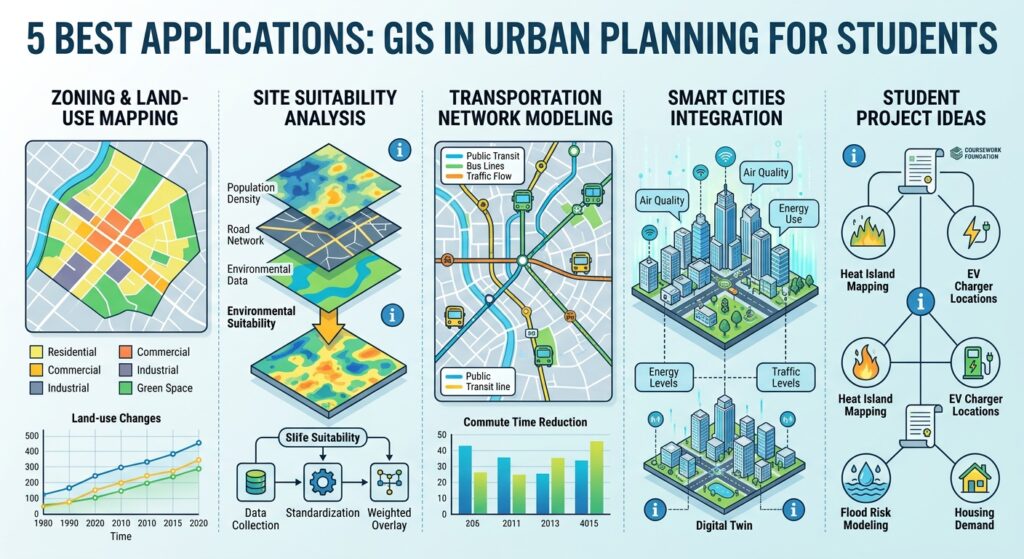
1.1 Zoning and Land-Use Mapping
One of the most established applications of GIS is mapping and analyzing land use and zoning.
Urban planners need to understand how land is currently being used and whether development is consistent with approved planning frameworks. GIS provides a structured way to visualize these relationships.
A typical land-use map may classify areas as:
- Residential
- Commercial
- Industrial
- Institutional
- Agricultural
- Recreational
- Transportation
- Open space
- Mixed-use development
Land-use change tracking
GIS can also be used to investigate how cities change over time.
A student could compare satellite imagery or historical land-use datasets from different years to determine whether agricultural land is being converted into residential development.
A basic workflow might be:
Historical imagery → Land-use classification → Current imagery → Change detection → Spatial interpretation
This can reveal patterns of urban expansion, densification, informal development, or loss of green space.
Zoning compliance
GIS can also support zoning GIS analysis by comparing actual development with designated zoning categories.
For example, a project could identify buildings located inside a commercial zone and compare them with building footprints and land-use records.
Students can then calculate:
- Number of parcels by zoning category
- Percentage of land in each zone
- Development density
- Areas of potential zoning conflict
- Changes in zoning over time
The important academic point is that GIS does not automatically determine whether development is legally compliant. Rather, it provides spatial evidence that planners can interpret alongside planning regulations and official records.
2. Site Selection and Suitability Analysis
Site selection is another major application of GIS.
Suppose a municipality wants to identify suitable locations for a new school, hospital, affordable housing development, fire station, or public park.
There is rarely a single variable that determines the ideal location.
Instead, planners must consider multiple criteria simultaneously.
Example: Selecting a location for a new public school
Potential criteria might include:
- Distance from existing schools
- Population density
- Distance to major roads
- Public transportation accessibility
- Land availability
- Slope
- Flood risk
- Environmental restrictions
- Distance from hazardous facilities
GIS allows these variables to be transformed into spatial layers and combined through multi-criteria suitability analysis.
A simplified model could be:
Suitability = Accessibility + Population Need + Land Availability − Environmental Constraints
In an actual GIS project, each criterion can be standardized, weighted, and combined to produce a suitability surface.
Example workflow
Collect datasets → Clean data → Create spatial layers → Standardize criteria → Assign weights → Overlay layers → Generate suitability map → Validate results
This makes suitability analysis an excellent university coursework topic because it combines technical GIS skills with planning theory.
3. Traffic and Transportation Network Analysis
Transportation is fundamentally spatial.
People travel between homes, workplaces, schools, shopping areas, and public services. Roads and transit networks determine how efficiently these locations are connected.
GIS can therefore support traffic flow modeling GIS applications and transportation planning.
Common applications include:
- Route optimization
- Network analysis
- Transit accessibility
- Pedestrian analysis
- Cycling infrastructure planning
- Road-network evaluation
- Emergency response routing
- Parking analysis
- Public transportation catchment analysis
Walkability analysis
A student could investigate whether residents in a particular neighborhood can easily access essential services on foot.
For example, the study could calculate walking distances from residential buildings to:
- Bus stops
- Schools
- Hospitals
- Markets
- Parks
- Community facilities
A 400–800 metre walking catchment can then be generated around selected destinations, depending on the planning standard being used.
However, straight-line distance can be misleading.
A destination may be only 500 metres away geographically but much farther by road because of:
- Rivers
- Highways
- Fences
- Railways
- Missing pedestrian connections
Network-based GIS analysis addresses this problem by measuring movement through the actual transportation network.
4. GIS in Smart Cities Integration
The concept of a smart city expands GIS beyond static maps.
Traditional GIS might answer:
Where are the roads?
Smart-city GIS can move toward questions such as:
How are those roads being used right now?
This shift is enabled by technologies such as Internet of Things (IoT) sensors, cloud platforms, real-time data streams, digital twins, and 3D spatial models.
IoT and real-time urban data
Cities can collect data from sensors monitoring:
- Traffic volumes
- Air quality
- Weather
- Parking availability
- Energy consumption
- Water infrastructure
- Noise
- Waste collection
- Pedestrian movement
When this information has a geographic component, it can be integrated into a GIS environment.
For example, traffic sensors distributed across a city could provide continuously updated information about vehicle volumes. A planner could visualize congestion patterns spatially and investigate relationships between congestion, road design, land use, and travel demand.
Digital Twins
A digital twin is a digital representation of a physical environment or system that can be connected to current or historical data.
In urban development, a digital twin may represent:
- Buildings
- Roads
- Bridges
- Utilities
- Public spaces
- Terrain
- Transportation networks
The combination of GIS, 3D modeling, sensors, and other information systems can allow planners and engineers to examine proposed changes before implementing them physically.
For students, digital twins provide an excellent example of how conventional GIS is evolving toward integrated urban information systems.
3D GIS and BIM-GIS Integration
Traditional GIS frequently represents buildings as two-dimensional footprints. Modern planning increasingly uses 3D representations.
Tools such as CityEngine can support procedural 3D urban modeling, while Building Information Modeling (BIM) contains detailed information about individual buildings and infrastructure.
The integration of BIM and GIS creates opportunities for analyzing both:
Building-level information + City-scale spatial context
For example, a proposed building can potentially be evaluated in relation to:
- Surrounding buildings
- Road access
- Terrain
- Sun exposure
- Utility networks
- Emergency access
- Public spaces
This convergence is particularly relevant to civil engineering, architecture, infrastructure management, and smart-city development.
5. Five Impressive GIS Project Ideas for Students
The strongest university GIS projects generally do more than produce attractive maps. They define a planning problem, identify relevant datasets, apply an analytical method, and interpret the results.
Here are five practical urban planning project ideas.
Project 1: Mapping Urban Heat Islands Using Landsat Thermal Data
Research question
Which parts of the city experience higher land-surface temperatures, and how are these patterns related to land cover?
Suggested datasets
- Landsat satellite imagery
- Land-use/land-cover data
- Building footprints
- Roads
- Vegetation data
- Population data
Method
Calculate land-surface temperature from suitable thermal satellite data and compare temperature patterns with vegetation, impervious surfaces, and built-up areas.
Final outputs
- Urban heat map
- Land-cover classification
- Temperature statistics
- Hotspot analysis
- Planning recommendations
This project connects remote sensing, environmental planning, and urban climate analysis.
Project 2: Optimal EV Charging Station Location Allocation
Research question
Where should electric vehicle charging stations be located to maximize accessibility while minimizing planning constraints?
Suggested datasets
- Road network
- Existing charging stations
- Population distribution
- Commercial centers
- Parking facilities
- Electricity infrastructure, where available
- Land-use data
GIS methods
Use:
- Proximity analysis
- Network analysis
- Buffering
- Suitability analysis
- Weighted overlay
The final map can identify candidate locations and explain the criteria used to select them.
Project 3: Public Transport Accessibility and Spatial Inequality
Research question
Which neighborhoods have the poorest access to public transportation?
Suggested datasets
- Bus stops
- Road network
- Population distribution
- Residential areas
- Employment centers
- Public facilities
Method
Generate network-based service areas around public transport stops and calculate the proportion of the population within selected walking distances.
Possible outputs
Create an accessibility index showing areas with:
- High accessibility
- Moderate accessibility
- Low accessibility
This project connects GIS with transport planning and public policy.
Project 4: Urban Expansion and Land-Use Change Detection
Research question
How has urban development changed the spatial structure of the city over the past 10–20 years?
Suggested datasets
- Historical satellite imagery
- Current satellite imagery
- Administrative boundaries
- Roads
- Land-use classifications
- Population data
Method
Classify land cover for different years and compare the resulting maps.
Calculate:
- Built-up area expansion
- Agricultural land converted
- Vegetation loss
- Direction of urban growth
- Expansion rate
Final output
A strong project could combine maps with graphs showing the quantitative changes over time.
Project 5: GIS-Based Flood Risk and Urban Development Suitability
Research question
Which urban areas face the greatest flood-related development constraints?
Suggested datasets
- Digital Elevation Model (DEM)
- Drainage network
- Rainfall data
- Land cover
- Soil data
- Building footprints
- Roads
- Historical flood locations
Method
Analyze factors such as:
- Elevation
- Slope
- Distance from drainage
- Land cover
- Drainage density
- Historical flood occurrence
These variables can be combined through a suitability or risk model.
Final outputs
Produce:
- Flood-risk map
- Vulnerable infrastructure map
- High-risk settlement map
- Planning constraint map
- Mitigation recommendations
For academic work, clearly distinguish between a GIS-derived risk index and an officially designated flood-risk classification.
6. Essential GIS Tools and Data Sources
A planning student does not need to master every GIS platform. Building strong fundamentals with one major desktop GIS package and complementary open datasets is usually more useful.
QGIS
QGIS is a widely used open-source GIS platform.
It can support:
- Spatial analysis
- Cartography
- Raster processing
- Vector analysis
- Geoprocessing
- Remote-sensing workflows
- Database connections
- Map production
Its open-source nature also makes it particularly useful for students working with limited budgets.
ArcGIS Pro
ArcGIS Pro provides an extensive professional GIS environment with tools for spatial analysis, cartography, geoprocessing, 3D analysis, and data management.
Students whose universities provide educational licenses can use it to develop skills relevant to professional planning and engineering workflows.
OpenStreetMap
OpenStreetMap provides openly accessible geographic data created and maintained by contributors.
Depending on location and data availability, students may obtain information about:
- Roads
- Buildings
- Railways
- Schools
- Hospitals
- Shops
- Parks
- Other mapped features
Always check the relevant licensing and attribution requirements before using or redistributing data.
Census and Government Data
In the United States, students can use resources such as Census TIGER/Line geographic files alongside demographic datasets.
For projects elsewhere, students should investigate their national statistical agencies, municipal GIS portals, planning authorities, and open-data platforms.
For a student working in Kenya, potentially useful sources can include:
- National government datasets
- County government open-data resources
- National census information
- OpenStreetMap
- Satellite imagery
- Transport datasets
- Local planning documents
The exact availability of municipal data varies considerably by city.
7. A Practical GIS Coursework Framework
If you are preparing a university GIS assignment, avoid beginning with the map.
Begin with the planning problem.
A useful project structure is:
Step 1 — Define the problem
Example:
Which areas are underserved by public transportation?
Step 2 — Develop research objectives
For example:
- Map existing public transport infrastructure.
- Measure accessibility.
- Identify underserved neighborhoods.
- Examine population characteristics.
- Recommend potential intervention areas.
Step 3 — Identify datasets
Create a simple data inventory:
| Dataset | Type | Purpose |
|---|---|---|
| Road network | Vector | Network analysis |
| Bus stops | Point | Transit accessibility |
| Population | Polygon/table | Demand estimation |
| Land use | Polygon/raster | Spatial context |
| Administrative boundary | Polygon | Study area |
Step 4 — Clean and prepare the data
Check:
- Coordinate reference systems
- Missing values
- Geometry errors
- Attribute consistency
- Dataset dates
- Spatial resolution
Step 5 — Perform the analysis
Choose methods appropriate to the research question rather than using GIS tools simply because they are available.
Step 6 — Visualize the results
Use:
- Clear legends
- Appropriate classifications
- Scale bars
- North arrows where appropriate
- Data sources
- Coordinate information
- Informative titles
Step 7 — Interpret the results
A map is not the conclusion.
Explain what the spatial pattern means for urban planning.
Conclusion: Why GIS Skills Matter for Future Planners
GIS in urban planning has evolved from a specialized mapping technology into an important analytical framework for understanding cities.
For urban planning students, GIS can support land-use planning, zoning analysis, transportation studies, environmental assessment, infrastructure planning, and site selection. For civil engineering students, it can provide spatial context for infrastructure and network decisions. For smart-city students, GIS provides an important foundation for integrating IoT, 3D models, digital twins, and real-time urban information.
The most valuable GIS projects are not necessarily the ones with the most complicated maps. They are the projects that connect spatial evidence to a clearly defined urban problem.
If you are working on a GIS assignment, term paper, suitability analysis, urban planning project, or smart-city research project, start with three questions:
- What urban problem am I investigating?
- What spatial evidence can help explain it?
- What planning decision could the analysis support?
Answering those questions first will make the technical GIS work much more purposeful—and can turn a routine coursework map into a credible planning analysis.