

Spatial Accessibility Modeling: Calculating the Two-Step Floating Catchment Area (2SFCA) for Healthcare Deserts

By leveraging spatial accessibility Python tools, urban planners and health researchers can effectively model healthcare deserts and evaluate spatial equity in public health infrastructure. Spatial equity in public health infrastructure remains one of the most pressing challenges in modern urban planning and epidemiological research. Quantifying where communities lack adequate medical services requires moving beyond rudimentary geographic metrics. Relying solely on distance-to-nearest-facility measurements often produces a dangerously skewed picture of public health access because it ignores two critical realities: provider capacity constraints and population demand competition.
To overcome these structural flaws, spatial health analysts and urban planners deploy the 2SFCA Two Step Floating Catchment Area Healthcare Deserts framework. This analytical methodology guide explores the mathematical principles of the Two-Step Floating Catchment Area (2SFCA) method, provides a complete, production-ready Python implementation to calculate spatial accessibility Python GeoPandas, and outlines how to model healthcare access in GIS to identify underserved regional “healthcare deserts.”
Introduction: The Failure of Simple Distance Metrics
Traditional GIS workflows often measure accessibility via straight-line Euclidean distance or simple road-network buffers from a population centroid to the closest hospital or clinic. While computationally simple, these approaches suffer from severe conceptual limitations:
-
Neglect of Congestion and Capacity: A clinic located two kilometers away from a residential tract is functionally useless if it consists of a single practitioner serving a massive, high-density neighborhood. Capacity matters: a 500-bed regional medical center offers vastly different throughput than a small community clinic.
-
Ignoring Competition: Simple distance metrics assume a facility serves only the nearest population, ignoring the reality that residents from multiple surrounding tracts compete for the exact same medical appointments and emergency beds.
The 2SFCA method solves these issues by simulating a floating service window that accounts simultaneously for supply capacities, population demands, and travel-time friction. By mastering spatial accessibility Python workflows, spatial researchers gain a robust, reproducible toolkit for addressing complex public health disparities.
The 2SFCA Methodological Framework
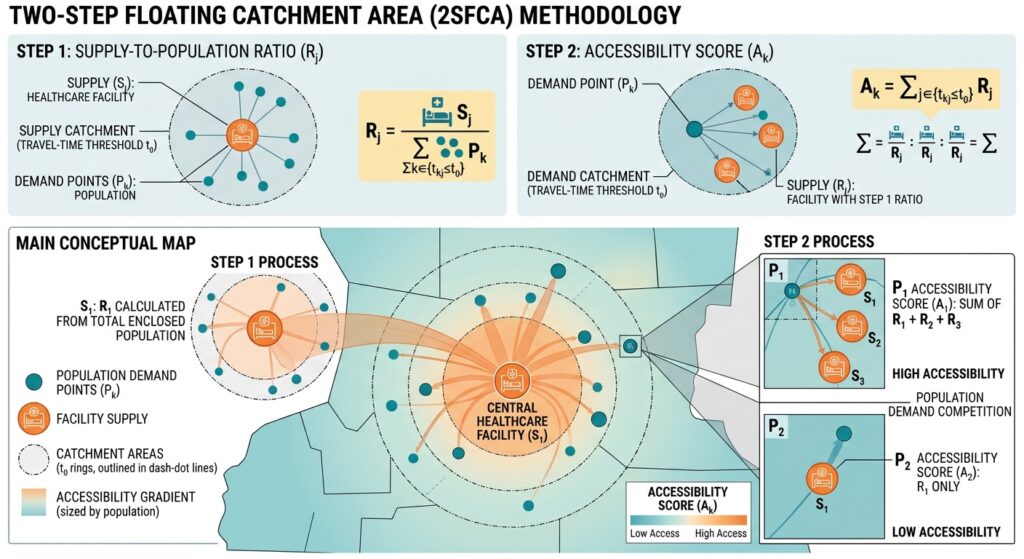
Originally formulated by Luo and Wang (2003), the 2SFCA model calculates a comprehensive accessibility score for every population demand point through a sequential two-step computation.
Step 1: Provider-to-Population Ratio Calculation
For every healthcare facility $j$, the algorithm establishes a travel-time catchment zone $d_0$ (e.g., a 30-minute driving threshold). It identifies all population demand locations $k$ falling within that catchment ($d_{kj} \le d_0$). The provider-to-population ratio $R_j$ is computed as:
$$R_j = \frac{S_j}{\sum_{k \in \{d_{kj} \le d_0\}} P_k}$$
Where:
-
$S_j$ is the service capacity of facility $j$ (e.g., number of physicians or hospital beds).
-
$P_k$ is the population demand at location $k$ within the catchment.
-
$R_j$ represents the congestion-adjusted service level per capita at facility $j$.
Step 2: Summation of Accessibility Scores
In the second step, the algorithm shifts its perspective to each population demand location $i$. It searches for all healthcare facilities $j$ located within the travel catchment threshold of $i$ ($d_{ij} \le d_0$). It then sums the provider-to-population ratios $R_j$ of those accessible facilities:
$$A_i^{\text{2SFCA}} = \sum_{j \in \{d_{ij} \le d_0\}} R_j$$
The resulting score $A_i^{\text{2SFCA}}$ represents the total supply of healthcare providers available per capita to residents at location $i$. Lower scores indicate severe service deserts.
Executing spatial accessibility Python scripts enables urban analysts to efficiently handle massive vector datasets and complex distance matrices without performance bottlenecks.
Step-by-Step Python Implementation
To execute this analysis programmatically, we use Python with
geopandas, pandas, and numpy.1. Generating Travel-Time Matrices and Preparing Data
Python
import geopandas as gpd
import pandas as pd
import numpy as np
from shapely.validation import make_valid

def standardize_and_validate(gdf: gpd.GeoDataFrame, target_epsg: int, name: str) -> gpd.GeoDataFrame:
    """Reproject to a metric CRS, repair invalid geometries, and drop empty features."""
    if gdf.crs is None:
        raise ValueError(f"[{name}] missing CRS; define a valid coordinate reference system.")
    if gdf.crs.to_epsg() != target_epsg:
        gdf = gdf.to_crs(epsg=target_epsg)
    gdf = gdf.copy()
    gdf["geometry"] = gdf["geometry"].apply(make_valid)
    valid_mask = ~gdf.is_empty & gdf.geometry.notna()
    return gdf[valid_mask].copy()

# Example loading of population centroids and healthcare providers (UTM Zone 37S / EPSG:32737)
TARGET_CRS = 32737
2. Structuring Population Demand Weights and Provider Capacities
Python
def load_accessibility_inputs(pop_path: str, facility_path: str):
    pop_df = gpd.read_file(pop_path)
    fac_df = gpd.read_file(facility_path)

    pop_gdf = standardize_and_validate(pop_df, TARGET_CRS, "Population")
    fac_gdf = standardize_and_validate(fac_df, TARGET_CRS, "Facilities")

    # Ensure necessary attribute columns exist
    if 'pop_count' not in pop_gdf.columns or 'capacity' not in fac_gdf.columns:
        raise ValueError("Population dataset must contain 'pop_count' and facilities must contain 'capacity'.")

    return pop_gdf, fac_gdf
3. Calculating Step 1 and Step 2 Spatial Accessibility Python Scores
Instead of relying solely on Euclidean distance, analysts can ingest network travel-time matrices (e.g., generated via OSRM or
pandana). Below is the core matrix-based 2SFCA computation engine:Python
def compute_2sfca(pop_gdf: gpd.GeoDataFrame, fac_gdf: gpd.GeoDataFrame, travel_cost_matrix: pd.DataFrame, threshold_mins: float = 30.0) -> pd.DataFrame:
    """
    Computes standard Two-Step Floating Catchment Area accessibility scores.
    travel_cost_matrix: Index = pop_id, Columns = facility_id, Values = travel time in minutes.
    """
    pop_ids = pop_gdf['pop_id'].values
    fac_ids = fac_gdf['fac_id'].values

    pop_demand = pop_gdf.set_index('pop_id')['pop_count'].to_dict()
    fac_capacity = fac_gdf.set_index('fac_id')['capacity'].to_dict()

    # Step 1: Calculate Provider-to-Population ratio (R_j) for each facility j
    r_j = {}
    for j in fac_ids:
        # Find all population points within threshold travel time of facility j
        costs_to_fac = travel_cost_matrix[j]
        accessible_pops = costs_to_fac[costs_to_fac <= threshold_mins].index

        total_demand = sum(pop_demand.get(k, 0) for k in accessible_pops)

        if total_demand > 0:
            r_j[j] = fac_capacity.get(j, 0.0) / total_demand
        else:
            r_j[j] = 0.0

    # Step 2: Sum accessibility ratios for each population location i
    accessibility_scores = {}
    for i in pop_ids:
        costs_from_pop = travel_cost_matrix.loc[i]
        accessible_facs = costs_from_pop[costs_from_pop <= threshold_mins].index

        score = sum(r_j.get(j, 0.0) for j in accessible_facs)
        accessibility_scores[i] = score

    result_df = pd.DataFrame(list(accessibility_scores.items()), columns=['pop_id', 'accessibility_score'])
    return result_df
4. Mapping Spatial Accessibility Scores and Identifying Healthcare Deserts
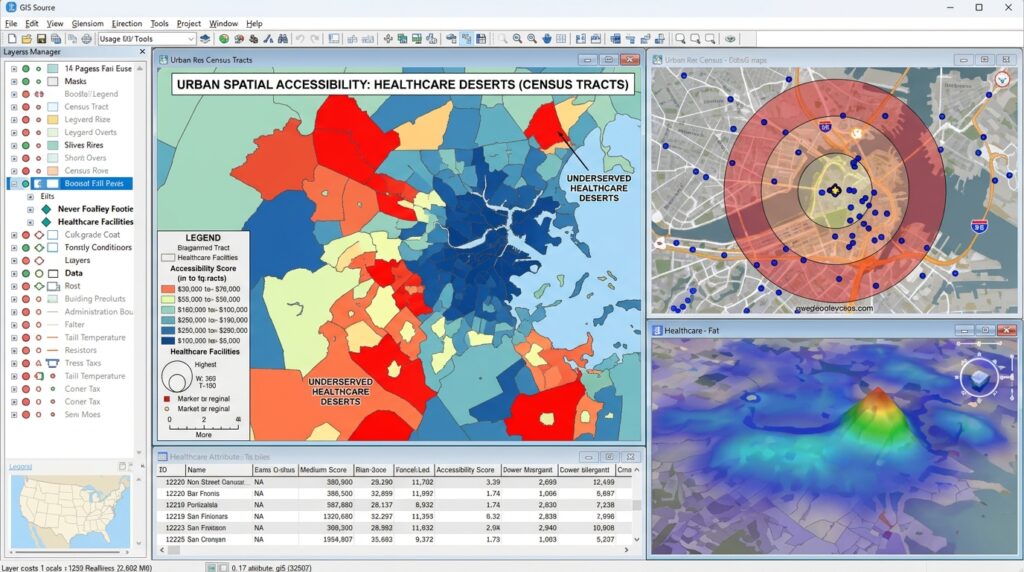
Once accessibility scores are merged back into the population spatial layer, classification routines (such as Natural Breaks or Quantiles) highlight spatial disparities. Areas falling below critical service thresholds are flagged as healthcare deserts.
Python
def classify_healthcare_deserts(pop_gdf: gpd.GeoDataFrame, accessibility_df: pd.DataFrame, output_path: str):
    merged = pop_gdf.merge(accessibility_df, on='pop_id')

    # Define desert threshold (e.g., bottom 10% or zero access)
    q_low = merged['accessibility_score'].quantile(0.10)
    merged['is_desert'] = merged['accessibility_score'] <= q_low

    merged.to_file(output_path, driver="GeoJSON")
    print(f"Analysis complete. Exported accessibility mapping to {output_path}. Desert threshold: {q_low:.4f}")
Advanced Spatial Extensions & Ecosystem Interlinking
To extend spatial health research beyond static 2SFCA models, analysts frequently combine accessibility metrics with advanced spatial statistics:
-
Spatial Autocorrelation: Evaluate clustering patterns of underserved tracts using Spatial Autocorrelation Global Local Moran’s I workflows to test whether healthcare deserts form statistically significant regional clusters.
-
Density Clustering: Inspect underlying demographic risk factors by pairing accessibility scores with Spatial Point Pattern KDE Analysis to locate vulnerable populations residing far from emergency nodes.
-
Interactive Visualization: Deploy findings to non-technical stakeholders by embedding computation results into Python Streamlit Dashboards for dynamic policy exploration.
Integrating spatial accessibility Python pipelines with broader geographic information systems ensures that policy decisions are backed by transparent and scalable quantitative metrics.
Summary
The Two-Step Floating Catchment Area (2SFCA) model provides a mathematically rigorous, capacity-aware framework for measuring healthcare accessibility. By integrating travel-time friction, facility throughput, and population demand competition via Python and GeoPandas, urban planners and spatial health analysts can transition from subjective estimates to defensible quantitative metrics, ultimately guiding targeted infrastructure investments to eliminate healthcare deserts.
Need help implementing these workflows for your project or academic coursework? Explore our comprehensive guides and reach out for expert assistance to master advanced spatial accessibility Python modeling today!