
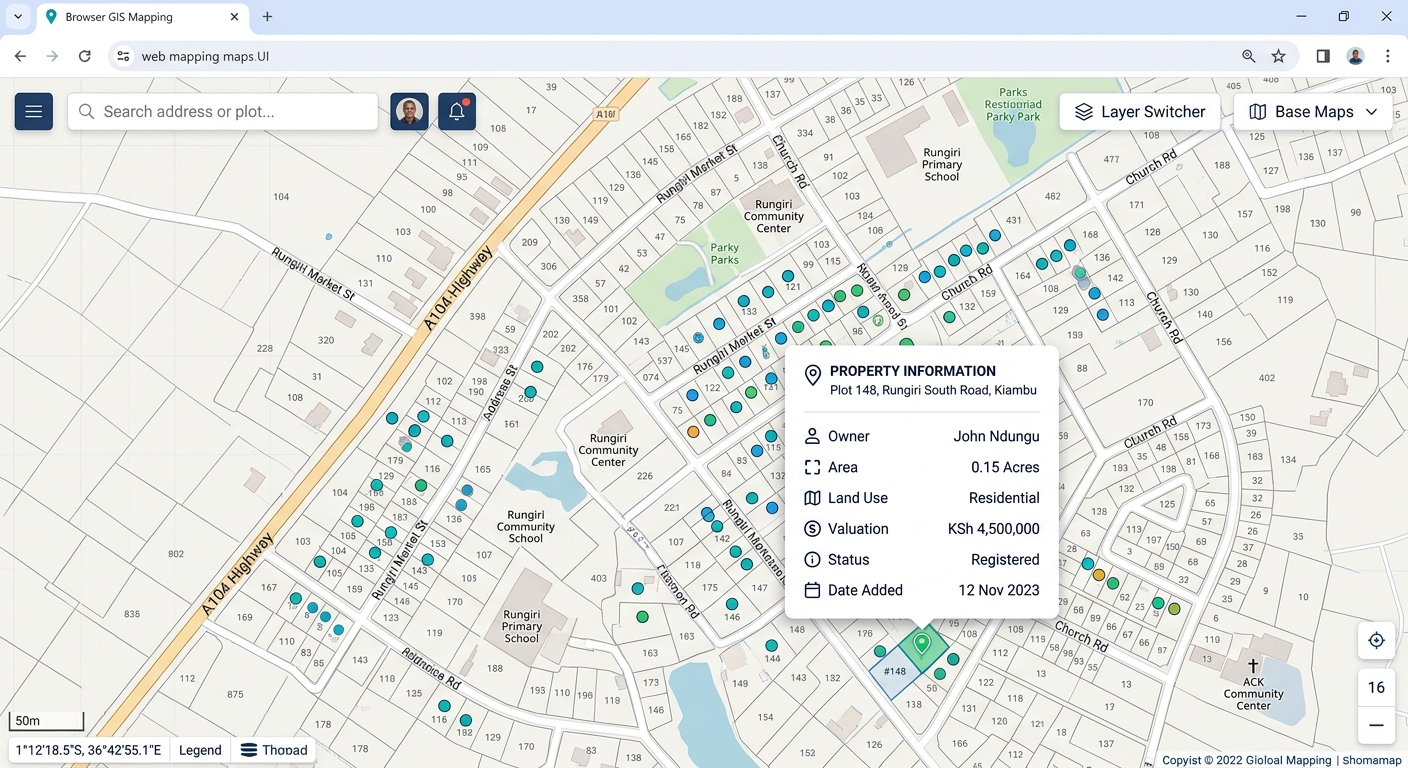
Publishing PostGIS Layers to the Web Using GeoServer and OpenLayers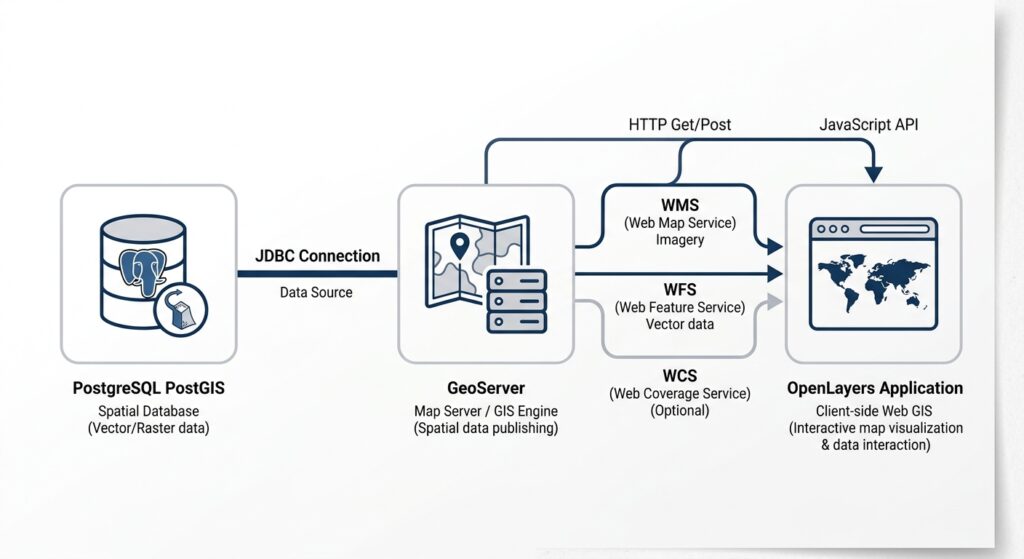
Technical tutorial · Web GIS architecture · PostgreSQL/PostGIS, GeoServer, OpenLayers
A web map is more than a map displayed in a browser. It is a connected system in which spatial data is stored in a database, exposed through a map server, styled for presentation, and rendered interactively by a front-end application.
This GeoServer PostGIS OpenLayers web map tutorial walks through that complete workflow using open-source tools. You will connect a PostGIS database to GeoServer, publish a spatial layer through WMS and WFS, apply a Styled Layer Descriptor (SLD), and build a browser-based map with zoom, pan, and feature pop-ups.
By the end, you will have the foundations of a reusable Web GIS application rather than a static map image.
Architecture for Publishing PostGIS Layers to the Web Using GeoServer and OpenLayers
PostgreSQL + PostGIS
Stores spatial tables, attributes, geometries and spatial indexes
JDBC database connection
GeoServer
Publishes layers, applies styles and serves OGC web services
HTTP requests and responses
OpenLayers web application
Renders maps, handles navigation and displays feature information
Each component has a distinct responsibility:
-
PostGIS: Stores authoritative spatial data and supports spatial queries.
-
GeoServer: Connects to the database and exposes layers as web services. WMS produces map images; WFS can expose vector features and their attributes.
-
OpenLayers: Runs in the browser and requests the layers it needs to display or interact with.
This separation lets you update the database without rebuilding the front-end map, change a layer’s appearance on the server, or reuse published services in other GIS clients.
Prerequisites and example dataset
You need a working PostgreSQL installation with PostGIS enabled, a GeoServer instance, and a web server or development server for the front-end files.
For this walkthrough, assume:
| Setting | Example value |
|---|---|
| Database | webgis |
| Database schema | public |
| Spatial table | public.city_assets |
| Geometry column | geom |
| GeoServer workspace | city |
| Published layer | city:city_assets |
| Front-end | HTML, CSS and JavaScript with OpenLayers |
These are illustrative names. Replace them with the values in your environment. The examples assume the layer contains point features and uses a known coordinate reference system.
If you already have a suitable PostGIS table, use it. Otherwise, create a small sample table and populate it with test features before proceeding.
Step 1: Connect PostGIS to GeoServer
1.1 Prepare the spatial table
GeoServer needs a database table with valid geometry metadata and a coordinate reference system (CRS).
For a sample point layer, the following SQL creates a table of city assets. Run it in the webgis database using pgAdmin or psql.
CREATE EXTENSION IF NOT EXISTS postgis;

CREATE TABLE public.city_assets (
    asset_id SERIAL PRIMARY KEY,
    asset_name VARCHAR(100) NOT NULL,
    asset_type VARCHAR(50),
    geom geometry(Point, 4326)
);

INSERT INTO public.city_assets
    (asset_name, asset_type, geom)
VALUES
    (
        'City Hall',
        'Government',
        ST_SetSRID(ST_MakePoint(36.8219, -1.2921), 4326)
    ),
    (
        'Central Hospital',
        'Healthcare',
        ST_SetSRID(ST_MakePoint(36.8070, -1.2864), 4326)
    ),
    (
        'Railway Station',
        'Transport',
        ST_SetSRID(ST_MakePoint(36.8250, -1.3010), 4326)
    );

CREATE INDEX city_assets_geom_idx
ON public.city_assets
USING GIST (geom);

ANALYZE public.city_assets;
The coordinates are illustrative locations in Nairobi, not a verified inventory of real facilities.
The important parts are:
-
geometry(Point, 4326)declares a point geometry in WGS 84. -
ST_SetSRIDassigns the CRS identifier to the supplied longitude and latitude coordinates. It does not transform coordinates. -
The GiST index helps PostgreSQL accelerate supported spatial queries.
-
ANALYZEupdates table statistics used by the query planner.
Check the result:
SELECT
    asset_id,
    asset_name,
    asset_type,
    ST_AsText(geom) AS geometry,
    ST_SRID(geom) AS srid
FROM public.city_assets;
If you already have data, verify its geometry type, CRS, primary key and spatial index before publishing it.
1.2 Create a dedicated database user
Avoid connecting GeoServer using the PostgreSQL superuser account. Create a restricted login for reading the published layer:
CREATE ROLE geoserver_reader
    LOGIN PASSWORD 'replace-with-a-strong-password';

GRANT CONNECT ON DATABASE webgis
    TO geoserver_reader;

GRANT USAGE ON SCHEMA public
    TO geoserver_reader;

GRANT SELECT ON public.city_assets
    TO geoserver_reader;
Replace the example password with a securely managed secret. In production, also consider default privileges for future tables and restrict database network access to the GeoServer application.
1.3 Create a workspace in GeoServer
Open the GeoServer administration interface. In a local development environment, its URL is commonly:
http://localhost:8080/geoserver
Your production URL will differ.
-
Sign in with an administrator account.
-
Navigate to Data → Workspaces.
-
Select Add new workspace.
-
Enter
cityas the workspace name. -
Set a namespace URI, such as
https://example.org/city. -
Save.
A workspace organizes related published resources. It also becomes part of the qualified layer name, city:city_assets.
1.4 Configure the PostGIS Data Store
GeoServer’s PostGIS Data Store connects a workspace to the spatial database. The official GeoServer quick-start follows this same general workflow.
Navigate to Data → Stores → Add new Store → PostGIS.
Enter the connection settings:
| Parameter | Example value |
|---|---|
| Workspace | city |
| Data source name | webgis_postgis |
| Host | Database server hostname |
| Port | 5432 |
| Database | webgis |
| Schema | public |
| User | geoserver_reader |
| Password | Your configured secret |
Important: If GeoServer and PostgreSQL run in separate containers, localhost inside the GeoServer container refers to that container—not the database container. Use the database’s service name or reachable hostname.
Save the store. If the connection fails, check the database credentials, PostgreSQL access rules, firewall, JDBC connectivity and server logs.
1.5 Publish the vector layer
Once the Data Store is saved:
-
Open the list of available layers for
webgis_postgis. -
Locate
city_assetsand choose Publish. -
Set the declared and native CRS to
EPSG:4326if the data genuinely uses WGS 84. -
Under the bounding-box settings, use Compute from data and Compute from native bounds, where available.
-
Review the layer metadata and save.
The published layer should now be identified as:
city:city_assets
The layer name is case-sensitive in many practical configurations. Use the exact name shown in GeoServer when making service requests.
1.6 Understand the WMS and WFS endpoints
GeoServer commonly exposes both services through its workspace or global service URL.
WMS — Web Map Service
Returns rendered map images. Suitable for displaying styled data without sending all underlying feature geometries to the browser.
/geoserver/city/wms
Example operation: GetMap
WFS — Web Feature Service
Returns vector features and attributes for client-side querying or analysis, subject to the server’s configuration and output-format support.
/geoserver/city/ows
Example operation: GetFeature
You can test the services by opening these URLs in a browser, replacing the hostname and port as needed.
WMS capabilities:
http://localhost:8080/geoserver/city/wms?service=WMS&version=1.3.0&request=GetCapabilitiesWFS capabilities:
http://localhost:8080/geoserver/city/ows?service=WFS&version=2.0.0&request=GetCapabilitiesA valid XML response describing available operations and layers indicates that the service endpoint is responding. It does not, by itself, prove that the individual layer is published correctly.
Test WFS feature retrieval:
http://localhost:8080/geoserver/city/ows?service=WFS&version=2.0.0&request=GetFeature&typeNames=city:city_assets&outputFormat=application/jsonIf JSON output is supported and the layer is accessible, the response should contain GeoJSON features. Avoid exposing unrestricted WFS access to large or sensitive datasets.
Step 2: Style the layer using SLD
A spatial database stores geometry and attributes, not necessarily the visual design you want users to see. GeoServer’s Styled Layer Descriptor (SLD) lets you define server-side symbology, including symbol shapes, colors, outlines, labels and attribute-based rules.
2.1 Create an SLD file
For the sample point layer, create a file named city_assets.sld:
<?xml version="1.0" encoding="UTF-8"?>
<StyledLayerDescriptor
    version="1.0.0"
    xmlns="http://www.opengis.net/sld"
    xmlns:ogc="http://www.opengis.net/ogc"
    xmlns:xsi="http://www.w3.org/2001/XMLSchema-instance"
    xsi:schemaLocation="
      http://www.opengis.net/sld
      http://schemas.opengis.net/sld/1.0.0/StyledLayerDescriptor.xsd">

  <NamedLayer>
    <Name>city:city_assets</Name>

    <UserStyle>
      <Title>City Assets</Title>
      <FeatureTypeStyle>
        <Rule>
          <Name>Healthcare</Name>
          <ogc:Filter>
            <ogc:PropertyIsEqualTo>
              <ogc:PropertyName>asset_type</ogc:PropertyName>
              <ogc:Literal>Healthcare</ogc:Literal>
            </ogc:PropertyIsEqualTo>
          </ogc:Filter>

          <PointSymbolizer>
            <Graphic>
              <Mark>
                <WellKnownName>circle</WellKnownName>
                <Fill>
                  <CssParameter name="fill">#D94841</CssParameter>
                </Fill>
                <Stroke>
                  <CssParameter name="stroke">#FFFFFF</CssParameter>
                  <CssParameter name="stroke-width">1.5</CssParameter>
                </Stroke>
              </Mark>
              <Size>12</Size>
            </Graphic>
          </PointSymbolizer>
        </Rule>

        <Rule>
          <Name>Other assets</Name>
          <ElseFilter/>
          <PointSymbolizer>
            <Graphic>
              <Mark>
                <WellKnownName>circle</WellKnownName>
                <Fill>
                  <CssParameter name="fill">#247BA0</CssParameter>
                </Fill>
                <Stroke>
                  <CssParameter name="stroke">#FFFFFF</CssParameter>
                  <CssParameter name="stroke-width">1.5</CssParameter>
                </Stroke>
              </Mark>
              <Size>9</Size>
            </Graphic>
          </PointSymbolizer>
        </Rule>
      </FeatureTypeStyle>
    </UserStyle>
  </NamedLayer>
</StyledLayerDescriptor>
The first rule selects features whose asset_type is Healthcare and renders them as larger red circles. The ElseFilter rule styles features that did not match that rule.
2.2 Upload and apply the style
In GeoServer:
-
Open Data → Styles → Add a new style.
-
Name the style
city_assets_style. -
Upload the SLD file or paste its XML into the editor.
-
Validate the style and save it.
-
Open Data → Layers → city:city_assets.
-
Under the publishing or layer settings, select
city_assets_styleas the default style and save.
The exact placement of style controls can vary slightly by GeoServer version.
Preview the layer using the GeoServer layer preview page. If the style fails to validate, inspect the XML namespaces, element nesting, property names and filter values.
When should you use GeoServer CSS instead? GeoServer supports a CSS-style extension for people who prefer a shorter, more familiar syntax. It is not the same as the browser’s CSS, and it requires the appropriate GeoServer extension. SLD is the better baseline for this tutorial because it is supported by default.
Step 3: Build the OpenLayers front end
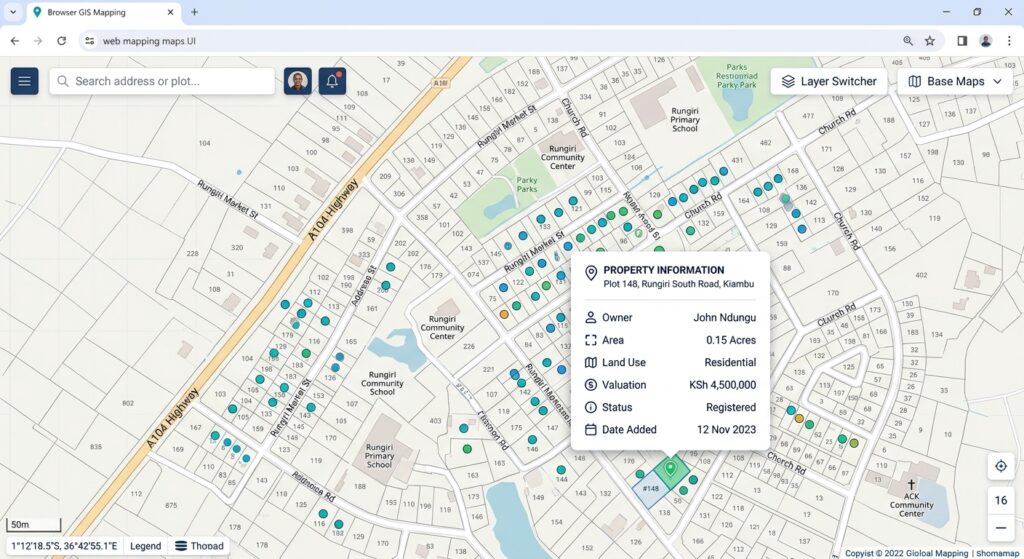
Now that GeoServer exposes the layer, the browser needs a map application that can request and render it.
We’ll use WMS for map rendering and WMS GetFeatureInfo for click-based pop-ups. This is a useful starting architecture because the browser receives rendered map images rather than downloading every feature geometry.
OpenLayers supports both WMS rendering and GetFeatureInfo requests through its WMS source classes.
3.1 Create the OpenLayers project
Install Node.js and npm, then run the official OpenLayers project setup:
npm create ol-app city-webgis
cd city-webgis
npm start
The starter project includes index.html, main.js, style.css and a development server.
Open the project in your code editor. We’ll replace the contents of those three files.
3.2 Create the HTML page
In index.html, provide a map container and a pop-up container:
<!doctype html>
<html lang="en">
<head>
  <meta charset="utf-8">
  <meta name="viewport"
        content="width=device-width, initial-scale=1">
  <title>City Assets Web GIS</title>
</head>
<body>
  <header class="app-header">
    <h1>City Assets Explorer</h1>
    <p>Explore published PostGIS data</p>
  </header>

  <main>
    <div id="map" aria-label="Interactive city map"></div>

    <div id="popup" class="ol-popup" hidden>
      <button id="popup-closer"
              class="popup-closer"
              aria-label="Close popup">×</button>
      <div id="popup-content"></div>
    </div>

    <p id="status" role="status">
      Loading map…
    </p>
  </main>

  <script type="module" src="./main.js"></script>
</body>
</html>
The map element is where OpenLayers renders the map. The pop-up is a separate HTML element positioned over the map when a user selects a feature.
3.3 Add the CSS
In style.css, define the page layout and pop-up appearance:
@import "ol/ol.css";

html,
body {
  margin: 0;
  min-height: 100%;
  font-family: Arial, sans-serif;
  color: #1f2937;
}

.app-header {
  padding: 16px 22px;
  background: #17324d;
  color: white;
}

.app-header h1 {
  margin: 0 0 6px;
  font-size: 1.35rem;
}

.app-header p {
  margin: 0;
  font-size: 0.9rem;
}

#map {
  width: 100%;
  height: 72vh;
  min-height: 420px;
}

#status {
  padding: 0 16px;
  font-size: 0.9rem;
}

.ol-popup {
  position: absolute;
  min-width: 190px;
  max-width: 280px;
  padding: 14px;
  background: white;
  border: 1px solid #d1d5db;
  border-radius: 8px;
  box-shadow: 0 3px 14px #0002;
  bottom: 12px;
  left: -50px;
}

.ol-popup[hidden] {
  display: none;
}

.popup-closer {
  float: right;
  border: 0;
  background: transparent;
  font-size: 1.3rem;
  cursor: pointer;
}

.popup-title {
  margin: 0 24px 8px 0;
}

.popup-row {
  margin: 5px 0;
  overflow-wrap: anywhere;
}
The ol/ol.css import supplies OpenLayers’ built-in controls and map styling.
3.4 Connect OpenLayers to the published WMS layer
Replace main.js with the following code.
This implementation:
-
Displays the published GeoServer layer.
-
Starts the map over Nairobi.
-
Supports built-in zoom and drag-to-pan navigation.
-
Requests feature information when a user clicks the map.
-
Displays selected attributes using safe DOM text insertion.
-
Handles failed requests without silently pretending that the map is working.
import Map from 'ol/Map.js';
import View from 'ol/View.js';
import TileLayer from 'ol/layer/Tile.js';
import TileWMS from 'ol/source/TileWMS.js';
import Overlay from 'ol/Overlay.js';
import { fromLonLat } from 'ol/proj.js';

import './style.css';

// Replace this with your accessible GeoServer URL.
// Use HTTPS in production.
const geoserverUrl =
  'http://localhost:8080/geoserver/city/wms';

const layerName = 'city:city_assets';

const status = document.getElementById('status');
const popup = document.getElementById('popup');
const popupContent = document.getElementById('popup-content');
const popupCloser = document.getElementById('popup-closer');

// Configure the WMS source.
const wmsSource = new TileWMS({
  url: geoserverUrl,
  params: {
    LAYERS: layerName,
    TILED: true,
    FORMAT: 'image/png',
    TRANSPARENT: true
  },
  serverType: 'geoserver'
});

// Render the server-styled map.
const assetsLayer = new TileLayer({
  source: wmsSource
});

// Configure the HTML popup.
const popupOverlay = new Overlay({
  element: popup,
  autoPan: {
    animation: { duration: 200 }
  },
  positioning: 'bottom-center',
  offset: [0, -12]
});

// Create the map.
const map = new Map({
  target: 'map',
  layers: [assetsLayer],
  overlays: [popupOverlay],
  view: new View({
    center: fromLonLat([36.8219, -1.2921]),
    zoom: 12
  })
});

// Close the popup.
popupCloser.addEventListener('click', () => {
  popupOverlay.setPosition(undefined);
  popup.hidden = true;
});

// Report that the map has initialized.
// This does not guarantee that the WMS request succeeded.
status.textContent =
  'Map initialized. Click a city asset to inspect its attributes.';

// Handle map clicks using WMS GetFeatureInfo.
map.on('singleclick', async (event) => {
  popupOverlay.setPosition(undefined);
  popup.hidden = true;
  popupContent.replaceChildren();

  const resolution = map.getView().getResolution();

  const url = wmsSource.getFeatureInfoUrl(
    event.coordinate,
    resolution,
    map.getView().getProjection(),
    {
      INFO_FORMAT: 'application/json',
      QUERY_LAYERS: layerName,
      FEATURE_COUNT: 5
    }
  );

  if (!url) {
    status.textContent =
      'Could not construct the feature information request.';
    return;
  }

  status.textContent = 'Querying feature information…';

  try {
    const response = await fetch(url);

    if (!response.ok) {
      throw new Error(`HTTP ${response.status}`);
    }

    const data = await response.json();
    const feature = data.features?.[0];

    if (!feature) {
      status.textContent =
        'No queryable feature found at this location.';
      return;
    }

    const properties = feature.properties ?? {};

    const title = document.createElement('h3');
    title.className = 'popup-title';
    title.textContent =
      String(properties.asset_name ?? 'Selected asset');

    popupContent.appendChild(title);

    for (const key of ['asset_id', 'asset_type']) {
      if (properties[key] === undefined) continue;

      const row = document.createElement('p');
      row.className = 'popup-row';
      row.textContent = `${key}: ${properties[key]}`;
      popupContent.appendChild(row);
    }

    popup.hidden = false;
    popupOverlay.setPosition(event.coordinate);

    status.textContent = 'Feature information loaded.';
  } catch (error) {
    console.error('GetFeatureInfo failed:', error);

    status.textContent =
      'Could not retrieve feature information. Check the service, ' +
      'browser network panel and CORS configuration.';
  }
});
The example assumes that GeoServer is reachable at the configured URL, the layer is queryable, and the service returns JSON for GetFeatureInfo. If your server uses another host, port or workspace, change the URL accordingly.
The click request uses the current map coordinate, map resolution and view projection to identify the clicked location. QUERY_LAYERS specifies which layer should be queried.
Security detail: The code uses textContent rather than inserting returned feature attributes as HTML. This reduces the risk of interpreting untrusted attribute values as executable markup.
3.5 Run and test the map
Start the development server:
npm startOpen the local URL printed by the terminal, commonly http://localhost:5173/.
Test the following:
-
Rendering: The city asset layer appears over the map.
-
Navigation: The zoom controls work, and dragging pans the map.
-
Styling: Healthcare features are red and other assets are blue.
-
Feature query: Clicking a point opens a pop-up containing its attributes.
-
Error handling: If GeoServer is unavailable, inspect the browser’s developer tools for failed network requests.
If the page loads but the layer is blank, check the WMS request in the browser’s Network panel. Confirm the requested layer name, CRS, bounding box and server response. A successful HTTP response can still contain a GeoServer exception rather than a valid map image.
Step 4: Add WFS for client-side vector interaction
WMS is appropriate when the server should render the layer. WFS is useful when the application needs actual vector geometries and attributes—for example, to apply client-side styling, select features or perform browser-side analysis.
However, loading an entire WFS layer can be expensive. The following optional example loads features by map extent, which is more appropriate for larger datasets than downloading everything at startup.
Add these imports to main.js:
import VectorLayer from 'ol/layer/Vector.js';
import VectorSource from 'ol/source/Vector.js';
import GeoJSON from 'ol/format/GeoJSON.js';
import { bbox as bboxStrategy } from 'ol/loadingstrategy.js';
import { Style, Circle, Fill, Stroke } from 'ol/style.js';
Then create a WFS vector layer:
const wfsUrl =
  'http://localhost:8080/geoserver/city/ows';

const wfsSource = new VectorSource({
  format: new GeoJSON(),

  url: (extent) => {
    const params = new URLSearchParams({
      service: 'WFS',
      version: '2.0.0',
      request: 'GetFeature',
      typeNames: 'city:city_assets',
      outputFormat: 'application/json',
      srsName: 'EPSG:3857',
      bbox: `${extent.join(',')},EPSG:3857`
    });

    return `${wfsUrl}?${params.toString()}`;
  },

  strategy: bboxStrategy
});

const wfsLayer = new VectorLayer({
  source: wfsSource,
  style: new Style({
    image: new Circle({
      radius: 6,
      fill: new Fill({ color: '#F59E0B' }),
      stroke: new Stroke({
        color: '#FFFFFF',
        width: 1.5
      })
    })
  })
});

// Add this after the existing map has been created.
map.addLayer(wfsLayer);
This layer uses a bounding-box loading strategy and requests GeoJSON in Web Mercator (EPSG:3857), matching the default OpenLayers view projection. The server must support the requested WFS version, GeoJSON output and CRS.
The WFS layer is deliberately styled separately in the browser, so it will not automatically inherit the SLD styling used by the WMS layer. If you add both layers simultaneously, the WFS points may overlap the WMS points; you can disable the WMS layer or use a layer switcher to compare them.
For very large datasets, consider paging, server-side filters, scale-dependent loading or vector tiles instead of repeatedly fetching large feature collections.
Step 5: Troubleshooting common problems
| Symptom | Likely cause | What to check |
|---|---|---|
| WMS layer is blank | Incorrect layer name, CRS or bounds | Inspect the WMS request and GeoServer logs |
| Database store fails | Incorrect credentials or unreachable host | Test connectivity and PostgreSQL access rules |
| Pop-up never appears | Layer isn’t queryable or response format differs | Test GetFeatureInfo directly and inspect the response |
| WFS request fails | Unsupported output format, version or CRS | Check WFS capabilities and the request parameters |
| Browser reports a CORS error | Cross-origin access isn’t allowed | Configure CORS on GeoServer or the reverse proxy |
| Map is slow | Too many features or expensive rendering | Add indexes, filter requests, simplify data or cache suitable map tiles |
A particularly common mistake is confusing CRS assignment with coordinate transformation. If the database coordinates are in a projected CRS but the layer is declared as EPSG:4326, GeoServer may display the features in the wrong place. Correct the source data’s CRS metadata and transform coordinates when necessary; do not simply change the label.
Step 6: Security and production deployment
A working development map is not yet a secure production Web GIS. Before exposing the stack publicly, address the following concerns.
Configure CORS deliberately
If OpenLayers runs on a different origin from GeoServer, the browser may block cross-origin requests. GeoServer provides built-in CORS configuration under Server → Global Settings → CORS Settings in supported versions. Configure the specific application origin, required methods and headers, then restart GeoServer as required by the installation.
For example, a production application might allow only:
https://maps.example.orgAvoid allowing every origin by default for a private or authenticated service. CORS is a browser access policy, not an authentication or authorization mechanism.
Restrict service and layer access
-
Create separate database roles for read-only access and controlled editing.
-
Configure GeoServer service and layer permissions to expose only intended data and operations.
-
Keep the GeoServer administrator interface and REST API private to trusted operators.
-
Do not put database passwords, GeoServer administrator credentials or long-lived privileged tokens in browser JavaScript.
-
Use HTTPS and protect secrets in server-side configuration or a secrets manager.
GeoServer supports service-level and layer-level security controls; use them rather than assuming an obscure endpoint URL protects the data.
Limit expensive requests
WFS can expose large collections, and poorly constrained requests can place substantial load on PostgreSQL and GeoServer. Set sensible request limits, apply filters where appropriate, monitor database connections and execution times, and consider caching for frequently requested map imagery.
Use a reverse proxy or gateway to terminate HTTPS, control public exposure, apply rate limits where appropriate, and avoid exposing internal database ports to the internet. Keep GeoServer and its extensions updated, and back up both the spatial database and GeoServer configuration.
Conclusion
This workflow demonstrates the core of an open-source web GIS architecture:
-
PostGIS stores structured spatial data and supports spatial queries.
-
GeoServer publishes those tables through WMS and WFS, with SLD controlling server-side map styling.
-
OpenLayers builds the browser interface, rendering map layers and enabling navigation and feature interaction.
The key architectural choice is to match the service to the task: use WMS when the browser primarily needs a rendered map, and use WFS when it needs vector features for interaction or analysis. For production systems, add access control, HTTPS, CORS configuration, database indexing and request limits before exposing the application publicly.