
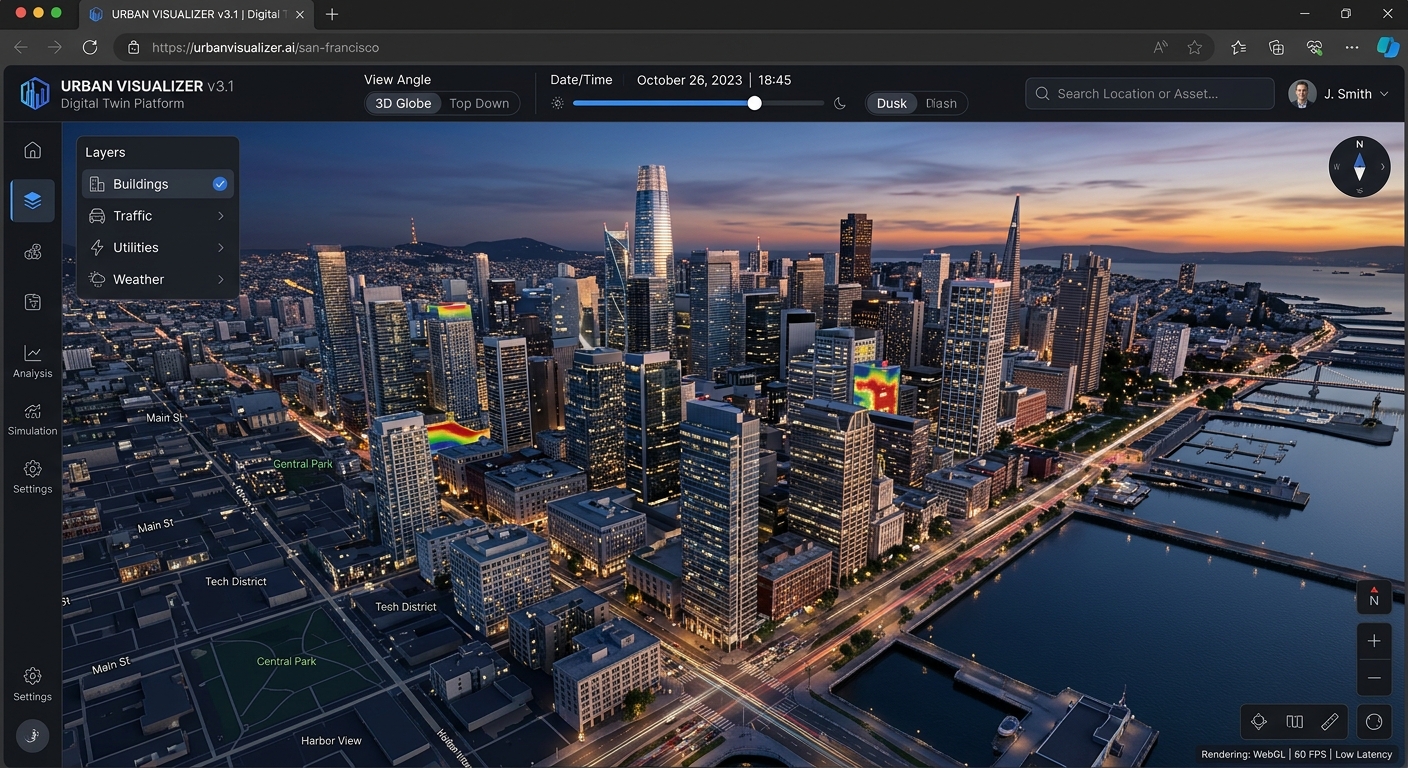
Building Immersive 3D Digital Twins in the Browser with Deck.gl, MapLibre GL JS, and 3D Tiles
Introduction: From 2D web maps to immersive digital twins
Welcome to this practical OGC 3D Tiles web map tutorial on building immersive 3D digital twins in the browser using MapLibre GL JS and Deck.gl. Traditional web maps are excellent at displaying roads, land parcels, administrative boundaries, and points of interest. However, they become less expressive when developers need to represent complex building facades, construction progress, urban infrastructure, or the real-time state of physical assets. A three-dimensional digital twin extends this familiar mapping environment into an interactive spatial model that combines geographic context, realistic geometry, asset information, and live operational data.
For urban planners, infrastructure engineers, and smart-city developers, a browser-based digital twin can support building inspections, solar exposure analysis, utility monitoring, construction coordination, and environmental assessment without requiring users to install specialist desktop GIS software.
The challenge is rendering large, detailed three-dimensional scenes without overwhelming browser memory or sacrificing interaction quality. Loading an entire photogrammetric city as one mesh is rarely practical. Instead, modern 3D geospatial systems stream only the model content needed for the current camera position and level of detail.
This tutorial demonstrates how to build a 3D digital twin in the browser using MapLibre GL JS, Deck.gl, and the Open Geospatial Consortium (OGC) 3D Tiles standard. We will configure a shared rendering environment, load photogrammetry and building meshes, introduce dynamic lighting and camera controls, implement building-level feature selection, and overlay live Internet of Things (IoT) sensor observations.
The approach uses modern JavaScript modules and a Vite development environment. It assumes that you already have a published 3D Tiles dataset and, for building-level interaction, a matching building-footprint dataset with stable asset identifiers.
1. Core frontend architecture
A reliable implementation separates geographic navigation, detailed geometry, and application data rather than attempting to manage everything inside a single rendering layer.
Application and data services
Building registry · IoT API · asset metadata · selection state
MapLibre GL JS
Basemap, geographic camera, zoom, bearing, pitch, and map controls
Deck.gl
3D Tiles, GPU-accelerated layers, interactive features, and sensor overlays
OGC 3D Tiles and geospatial services
Photogrammetry · building meshes · footprints · live observations
MapLibre GL JS: the geographic foundation
MapLibre GL JS renders interactive vector-tile maps using WebGL. It manages the map’s geographic camera and navigation, making it a suitable base for applications that require familiar pan, zoom, rotation, and pitch controls.
Deck.gl: the geospatial rendering engine
Deck.gl provides a layer-based visualization framework designed for high-volume geospatial rendering. Its Tile3DLayer loads 3D Tiles or supported Esri I3S datasets, while other layers can display building footprints, sensor locations, labels, and analytical overlays.
deck.gl+1
For MapLibre GL JS versions 4.5.1, 5, and 6, use MapLibreOverlay from @deck.gl/maplibre. The interleaved rendering mode shares MapLibre’s WebGL2 rendering context, allowing Deck.gl layers to participate in the map’s layer stack. This is particularly important when 3D models must interact visually with other geographic layers.
deck.gl+1
OGC 3D Tiles: the streaming data format
3D Tiles organizes massive geospatial scenes into a hierarchy of tiles. The renderer selects appropriate detail as the camera moves, avoiding the need to download every model at maximum resolution. The standard supports photogrammetry, 3D buildings, point clouds, and building information modelling (BIM) or computer-aided design (CAD) content.
Streaming Massive 3D Geospatial Data+1
One important compatibility detail: B3DM (Batched 3D Model) is a legacy 3D Tiles 1.0 format that was deprecated in 3D Tiles 1.1. Deck.gl supports B3DM through its 3D Tiles loader, but new publishing workflows should generally favour glTF-based tile content and current 3D Tiles 1.1 capabilities where possible.
GitHub+1
2. Step-by-step implementation
Step 1: Set up the frontend project
Create a new Vite application and install the required packages:
npm create vite@latest city-digital-twin -- --template vanilla
cd city-digital-twin
npm install
npm install maplibre-gl @deck.gl/core @deck.gl/layers @deck.gl/geo-layers @deck.gl/maplibre
npm run dev
Use a recent compatible version of each package. For the examples below, the integration uses MapLibreOverlay rather than the older Mapbox-specific overlay class.
In index.html, create a map container:
<div id="map"></div>
<div id="asset-popup" aria-live="polite"></div>
<script type="module" src="/src/main.js"></script>
Add the following styles to src/style.css:
html,
body,
#map {
  width: 100%;
  height: 100%;
  margin: 0;
  overflow: hidden;
}

#asset-popup {
  position: absolute;
  z-index: 10;
  left: 16px;
  bottom: 16px;
  max-width: 320px;
  padding: 12px;
  background: white;
  color: #202a35;
  border-radius: 8px;
  font: 14px/1.5 system-ui, sans-serif;
  box-shadow: 0 4px 20px #0002;
}
The popup is an HTML interface rather than a canvas-rendered label, making it suitable for detailed building attributes, accessible text, and links to maintenance records.
Step 2: Initialize MapLibre and Deck.gl
Import the relevant modules in src/main.js:
import {
  Map,
  NavigationControl,
  setWorkerUrl
} from 'maplibre-gl';

import maplibreWorkerUrl
  from 'maplibre-gl/dist/maplibre-gl-worker.mjs?worker&url';

import { MapLibreOverlay } from '@deck.gl/maplibre';
import { Tile3DLayer } from '@deck.gl/geo-layers';
import { GeoJsonLayer, ScatterplotLayer } from '@deck.gl/layers';

import {
  AmbientLight,
  DirectionalLight,
  LightingEffect
} from '@deck.gl/core';

import 'maplibre-gl/dist/maplibre-gl.css';
import './style.css';

setWorkerUrl(maplibreWorkerUrl);

const map = new Map({
  container: 'map',
  style: 'https://tiles.openfreemap.org/styles/positron',
  center: [36.8219, -1.2921],
  zoom: 15,
  pitch: 58,
  bearing: -25,
  maxPitch: 80,
  antialias: true
});

map.addControl(
  new NavigationControl({ visualizePitch: true }),
  'top-right'
);
The camera starts over Nairobi as an example; replace the center, zoom, and bearing with values appropriate for your own city. The basemap URL is a development starting point, so verify the service’s usage terms and availability before production deployment.
The antialias option requests a smoother shared rendering context. Interleaved mode requires WebGL2, so the target device and browser must support it.
deck.gl+1
Step 3: Load photogrammetry and 3D building models
Publish a valid 3D Tiles dataset, then point Tile3DLayer at its root tileset.json document.
A tileset may contain textured photogrammetry, detailed building meshes, or multiple levels of geometric detail. The loader resolves the tileset hierarchy and fetches content as required by the camera.
const cityLayer = new Tile3DLayer({
  id: 'city-model',
  data: '/assets/city/tileset.json',
  pickable: true,

  onTilesetLoad: (tileset) => {
    console.log('3D Tileset loaded', tileset);
  },

  onTileError: (tile, url, message) => {
    console.error('Tile loading failed:', url, message);
  }
});
The URL is an example. Serve the tileset and its referenced content from your own static asset host or a compatible 3D Tiles service. Ensure relative content URIs resolve correctly and the server supplies appropriate cross-origin resource sharing (CORS) headers.
Initialize the layer after MapLibre has loaded:
await map.once('load');

const overlay = new MapLibreOverlay({
  interleaved: true,
  layers: [cityLayer]
});

map.addControl(overlay);
This creates the initial map-and-model integration. The camera remains under MapLibre’s control, while Deck.gl handles the 3D Tiles layer. For interactive buildings that must appear correctly alongside map labels and other 3D elements, interleaving is generally preferable to placing an independent canvas over the map.
deck.gl+1
Production consideration: A valid tileset is more than a directory of model files. It includes spatial bounding volumes, geometric error thresholds, refinement rules, and references to tile content. Incorrect coordinate transforms or bounding volumes can cause models to appear displaced, disappear at certain zoom levels, or load inefficiently.
Step 4: Configure dynamic lighting, shadows, and camera controls
Realistic illumination helps distinguish facades, rooftops, roads, and terrain. Deck.gl’s LightingEffect supplies ambient and directional lighting for supported material-aware layers, including the scenegraph rendering used for supported 3D Tiles content.
deck.gl+1
Create a lighting effect:
const ambientLight = new AmbientLight({
  color: [255, 255, 255],
  intensity: 0.65
});

const sunLight = new DirectionalLight({
  color: [255, 244, 224],
  intensity: 1.4,
  direction: [-3, -5, -2]
});

const lightingEffect = new LightingEffect({
  ambientLight,
  sunLight
});
Attach the effect to the overlay when creating it:
const overlay = new MapLibreOverlay({
  interleaved: true,
  effects: [lightingEffect],
  layers: [cityLayer]
});

map.addControl(overlay);
If you have already constructed the overlay, add effects through its supported setProps method rather than creating a second overlay. Only one interleaved overlay should be attached to a map at a time.
Enabling shadow projections
Deck.gl provides an experimental directional-light shadow option:
const sunLight = new DirectionalLight({
  color: [255, 244, 224],
  intensity: 1.4,
  direction: [-3, -5, -2],
  _shadow: true
});
The _shadow property is experimental, not a guarantee of production-quality shadows across every layer and device. Shadow rendering also has a performance cost. Test the result using your actual model formats, browser, and target hardware.
deck.gl+1
It is equally important to distinguish lighting from shadows: directional lighting can give a facade realistic shading without projecting a shadow onto the street. For predictable production results, test shadow support explicitly and provide a fallback with directional lighting only.
Controlling camera pitch
MapLibre controls the camera through geographic coordinates, zoom, bearing, and pitch. For a dramatic urban view, set pitch between approximately 45 and 70 degrees and let users switch between aerial and street-level perspectives.
map.easeTo({
  center: [36.8219, -1.2921],
  zoom: 16,
  pitch: 65,
  bearing: -35,
  duration: 1200
});
Use flyTo for longer transitions between districts and easeTo for shorter camera adjustments. Avoid automatically animating the camera while users are selecting assets or examining sensor readings.
Step 5: Implement building-level feature picking and attribute popups
Selecting a building is more complicated than detecting a mouse click. A 3D Tiles dataset may contain an entire cluster of buildings inside one tile. Selecting that tile does not necessarily identify the individual structure under the pointer.
Deck.gl uses GPU-based picking rather than requiring developers to implement a separate CPU raycasting engine. However, Tile3DLayer‘s documented picking result is a tile header, not a guaranteed individual building feature. Building-level picking therefore depends on the available per-feature identifiers and metadata.
deck.gl+1
A practical frontend architecture combines the detailed mesh with an indexed GeoJSON building-footprint dataset. Each footprint must contain a stable identifier matching the building registry. The footprint layer provides dependable GIS feature selection, while the Tiles layer supplies detailed visual geometry.
For example, assume buildingFootprints contains valid GeoJSON features with properties such as building_id, name, use, and height_m.
let selectedBuildingId = null;

const popup = document.querySelector('#asset-popup');

function showBuilding(feature) {
  const p = feature.properties;

  popup.replaceChildren();

  const title = document.createElement('strong');
  title.textContent = p.name || `Building ${p.building_id}`;

  const details = document.createElement('p');
  details.textContent =
    `Use: ${p.use || 'Unknown'} · ` +
    `Height: ${p.height_m ?? 'Unknown'} m`;

  const id = document.createElement('small');
  id.textContent = `Asset ID: ${p.building_id}`;

  popup.append(title, details, id);
}
Use a pickable GeoJsonLayer for selecting indexed buildings:
function createBuildingLayer(buildingFootprints) {
  return new GeoJsonLayer({
    id: 'building-selection',
    data: buildingFootprints,
    pickable: true,
    filled: true,
    stroked: true,

    // Keep the hit-test geometry subtle but visible.
    getFillColor: (feature) =>
      feature.properties.building_id === selectedBuildingId
        ? [255, 165, 0, 100]
        : [40, 130, 220, 18],

    getLineColor: [40, 145, 230, 180],
    getLineWidth: 1,
    lineWidthUnits: 'pixels',

    onClick: (info) => {
      if (!info.object) return;

      selectedBuildingId =
        info.object.properties.building_id;

      showBuilding(info.object);
    }
  });
}
Load the companion dataset and include the layer in the same Deck.gl overlay:
const buildingFootprints = await fetch(
  '/data/building-footprints.geojson'
).then((response) => {
  if (!response.ok) {
    throw new Error('Unable to load building footprints');
  }
  return response.json();
});

overlay.setProps({
  layers: [
    cityLayer,
    createBuildingLayer(buildingFootprints)
  ]
});
This sample establishes building-level selection through the footprint geometry. The highlight and popup depend on that indexed feature layer, so verify alignment and picking behaviour in your scene; footprints alone do not perform exact triangle-level raycasting against a roof or facade.
For direct model picking, inspect the tile format and its feature IDs or structural metadata. Where a tile contains multiple structures, map those identifiers to the authoritative building registry and implement a feature-aware picking path. If exact surface coordinates are also required, use depth-aware picking where supported by the rendering layer, or a custom 3D picking implementation. This distinction matters for engineering inspections, BIM selection, and asset-specific maintenance workflows.
3. Overlay real-time IoT sensor streams
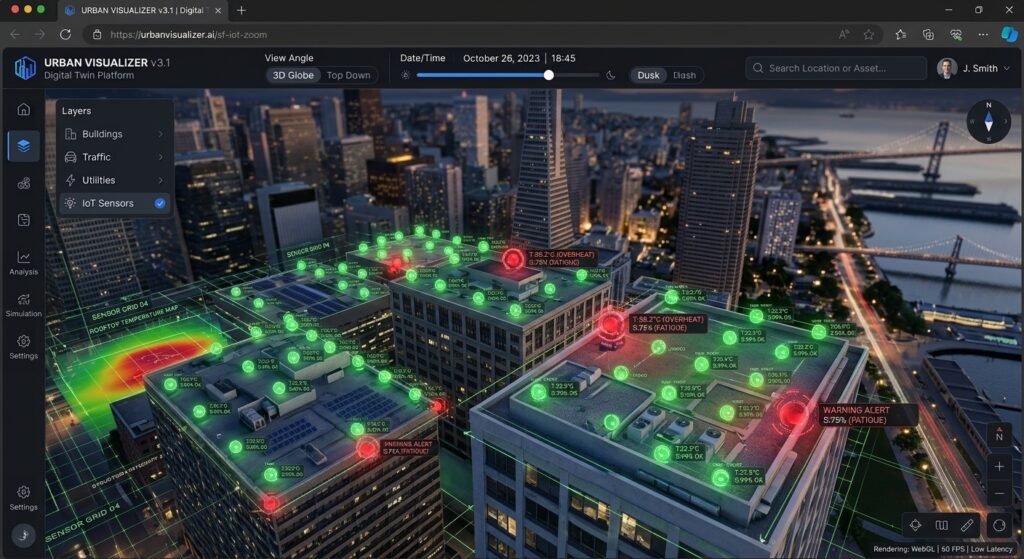
A digital twin becomes operationally useful when it connects model geometry to changing data. Consider a city application that tracks rooftop temperature, electricity consumption, indoor air quality, or structural vibration.
Each sensor observation should have a stable asset or sensor ID, a timestamp, a measurement, and preferably a quality or status flag. The frontend should transform these observations into visualization-ready objects rather than rebuilding the underlying 3D Tiles model whenever a new reading arrives.
Example sensor records:
let sensors = [
  {
    id: 'sensor-104',
    buildingId: 'BLD-001',
    position: [36.8219, -1.2921, 28],
    temperature: 34.8,
    status: 'warning'
  },
  {
    id: 'sensor-105',
    buildingId: 'BLD-002',
    position: [36.8230, -1.2915, 16],
    temperature: 25.6,
    status: 'normal'
  }
];
The third coordinate represents an elevation in metres above the geographic reference level used by your visualization. Confirm that it matches the model’s vertical datum and transformation rules.
Create a sensor layer:
function createSensorLayer() {
  return new ScatterplotLayer({
    id: 'iot-sensors',
    data: sensors,
    pickable: true,

    getPosition: (d) => d.position,
    getRadius: 7,
    radiusUnits: 'pixels',

    getFillColor: (d) =>
      d.status === 'warning'
        ? [240, 70, 50, 230]
        : [40, 190, 120, 220],

    getLineColor: [255, 255, 255, 220],
    lineWidthMinPixels: 1
  });
}
Add the sensor layer to the existing overlay:
overlay.setProps({
  layers: [
    cityLayer,
    createBuildingLayer(buildingFootprints),
    createSensorLayer()
  ]
});
To receive measurements over time, connect the frontend to an authorized WebSocket service:
const socket = new WebSocket(
  'wss://example.com/api/city-sensors'
);

socket.addEventListener('message', (event) => {
  const update = JSON.parse(event.data);

  sensors = sensors.map((sensor) =>
    sensor.id === update.id
      ? { ...sensor, ...update }
      : sensor
  );

  overlay.setProps({
    layers: [
      cityLayer,
      createBuildingLayer(buildingFootprints),
      createSensorLayer()
    ]
  });
});
This is a simplified update handler: validate incoming messages, verify sensor IDs, handle connection failures, and throttle redraws when observations arrive rapidly. For thousands of sensors, batch updates, maintain a normalized sensor store, and update only the affected layer data rather than reloading static datasets.
Also, a sensor’s geographic position should be registered to the actual building or roof elevation. Arbitrary elevation values may display an otherwise valid sensor above the wrong floor or outside its architectural model.
4. Visualizing the completed digital twin
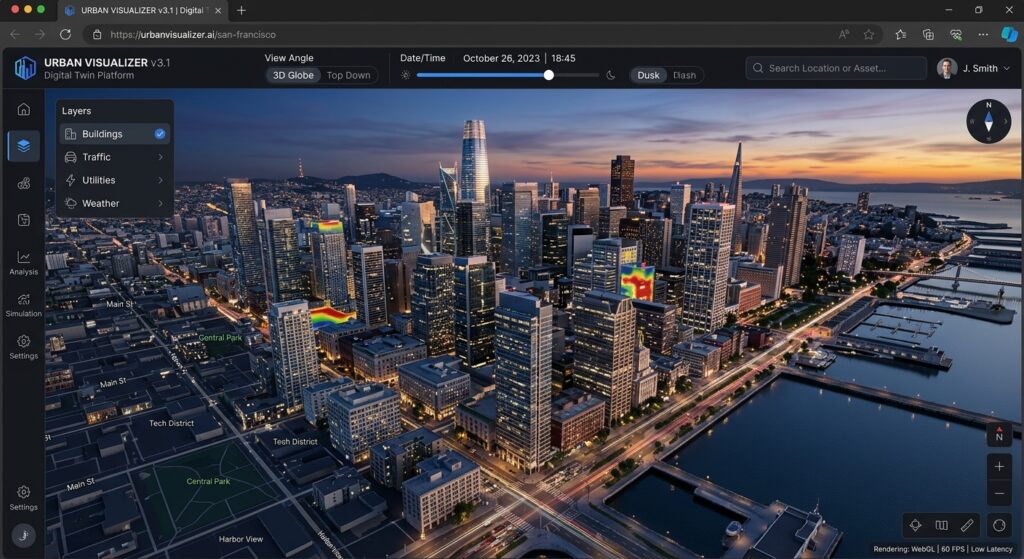
[Image 1: Web browser rendering a 3D city digital twin with lit architectural models and sensor data overlays]
Alt text: “Browser screenshot showing an interactive 3D city digital twin rendered using Deck.gl and 3D Tiles with dynamic lighting and attribute overlays.”
The finished interface should show detailed building geometry, recognizable geographic context, camera navigation, a selected-building highlight, an attribute popup, and sensor markers whose colors reflect their current status.
Design for operational clarity rather than visual complexity alone. A user should be able to distinguish physical geometry from analytical overlays immediately. Keep the default camera position useful, make selections easy to clear, and ensure that the asset panel remains readable when the map is rotated or pitched.
5. Performance, deployment, and troubleshooting
Large 3D scenes can stress GPU memory, CPU parsing, network bandwidth, and browser responsiveness. Address these concerns before deploying a city-scale model.
Optimize the tileset. Use sensible geometric error thresholds, level-of-detail hierarchies, texture resolutions, and tile sizes. Avoid using maximum-resolution photogrammetry throughout the entire camera view.
Keep interaction data lightweight. The building registry should contain identifiers and display attributes, not duplicate entire 3D model files. Fetch maintenance histories or detailed telemetry only when a user opens an asset.
Validate spatial alignment. Check the coordinate reference system, vertical units, tile transforms, and feature IDs. Use the same stable building identifiers across the tileset, footprints, and IoT data.
Monitor network and rendering failures. Confirm that tileset.json and its child resources return successfully, CORS allows the requests, and the browser supports the required WebGL features. Use the onTileError callback for diagnostics.
| Symptom | Likely cause | Recommended check |
|---|---|---|
| Model does not appear | Invalid URL, CORS, or failed tile request | Inspect network requests and tile errors |
| Model is displaced | Incorrect transform or coordinate reference | Validate geographic origin and elevation |
| Building selection is inconsistent | Missing or misaligned footprint features | Check asset IDs and geometry alignment |
| Frame rate drops | Excessive geometry, textures, or redraws | Reduce detail and batch sensor updates |
| Shadows look incorrect | Unsupported feature or costly shadow pass | Disable shadows and compare lighting-only output |
For production, also verify the licensing and attribution requirements of the basemap, imagery, photogrammetry, and building data. Implement authentication and authorization on data services that expose sensitive infrastructure information; a browser interface alone does not protect private endpoints.
6. SEO best practices and internal interlinking
The main keyword, 3D Digital Twin Browser Deck.gl MapLibre 3D Tiles, should appear naturally in the introduction and be reinforced through relevant headings, image alt text, and the conclusion. Avoid repeating the entire keyword unnaturally in every paragraph.
Use descriptive links to support readers who need deeper technical coverage. The following are suggested internal-link targets; replace the paths if your site’s published URLs differ.
-
Rendering 1 Million Points with WebGPU — expand on GPU rendering strategies for dense geospatial datasets.
-
Building Web GIS Feature Popups — explore reusable selection, popup, and attribute-display patterns.
-
Python Streamlit PyDeck — compare a Python-oriented workflow for building geospatial visualization applications.
Link from relevant existing articles back to this tutorial using varied, descriptive anchor text. Add structured data only when it accurately reflects the published article, and keep the page’s title, description, and heading structure consistent with its actual content.
Conclusion
Building an immersive 3D digital twin in the browser requires more than rendering a detailed city model. It requires coordinating a geographic camera, streamed geometry, lighting, asset selection, and live data while keeping the user interface responsive.
MapLibre GL JS provides the mapping foundation, Deck.gl’s Tile3DLayer supplies the streamed 3D content, and indexed geospatial features connect the rendered environment to meaningful building attributes. Adding IoT overlays then turns a static city model into a dynamic view of physical assets.
The key engineering principle is to separate 3D geometry, geographic identity, and live operational state. With stable identifiers, carefully prepared tilesets, tested picking behaviour, and efficient data updates, the result is a scalable foundation for browser-based urban planning, infrastructure management, and smart-city applications.
Want to take your spatial development further? Bookmark this OGC 3D Tiles web map tutorial, or reach out to our team if you need expert guidance, code optimization, or professional assistance with your advanced GIS assignments and digital twin projects.
